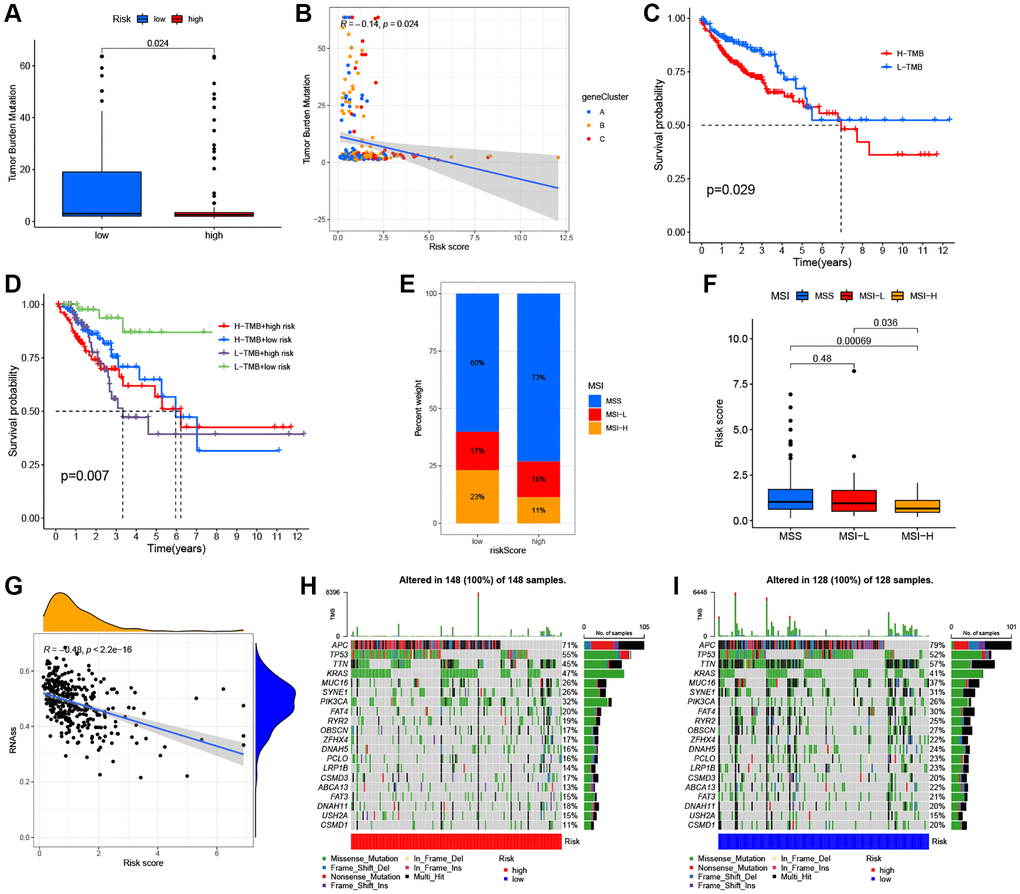
Figure 8.Comprehensive analysis of the ARG_score in CRC. (A, B) Relationships between the ARG_score and TMB. (C) Kaplan–Meier analysis of the RFS between the low- and high-TMB groups. (D) Survival analysis among four groups stratified by both TMB and ARG_score in CRC. (E, F) Relationships between ARG_score and MSI. (G) The correlation of the ARG_score with CSC index. (H, I) The waterfall plot of somatic mutation features established with the high- and low-ARG_score groups.