Aging
Navigate
Back to articleFigure 6(6 of 13)
100%
Figure 6
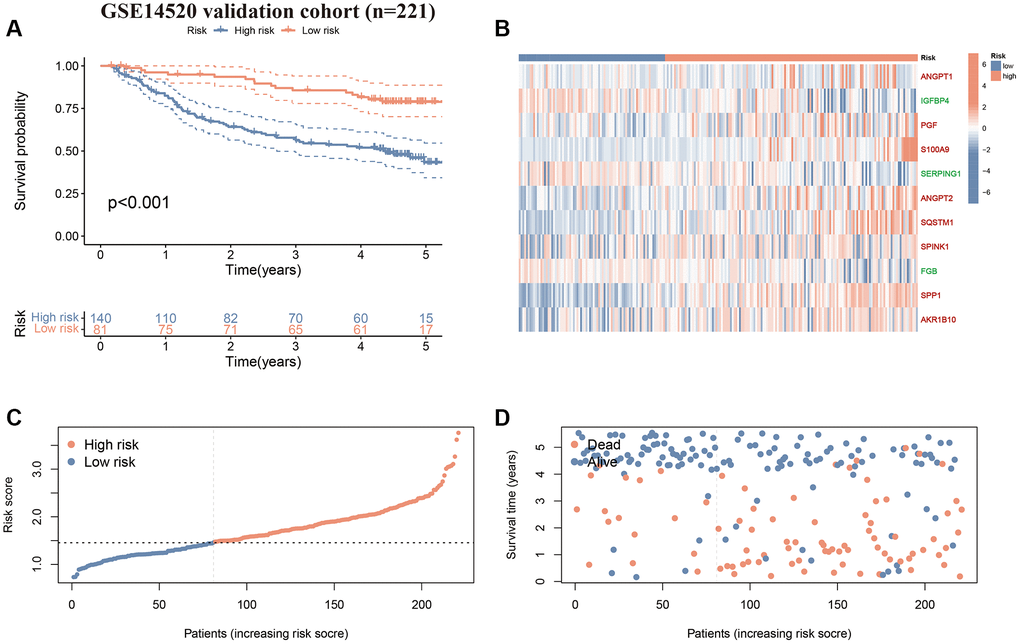
Figure 6.Validation of the CAFRss in GSE14520 cohort. (A) K-M curves for OS. (B) Heat map displaying the expression levels of the 11 genes in CAFRss (Red genes represent risk factors; green genes represent protective factors). (C, D) Risk score distribution curves and survival status plots.
Figure 6 — Identification and validation of a cancer-associated fibroblasts-related scoring system to predict prognosis and immune landscape in hepatocellular carcinoma through integrated analysis of single-cell and bulk RNA-sequencing | Aging