Aging
Navigate
Back to articleFigure 2(2 of 13)
100%
Figure 2
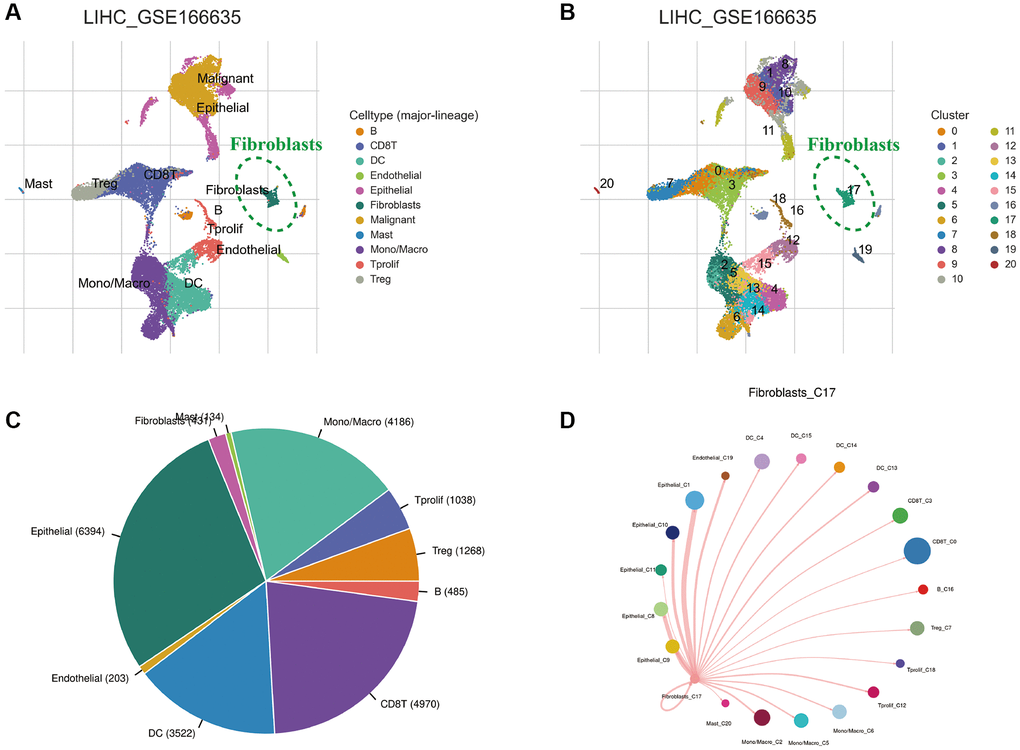
Figure 2.Single-cell sequencing analysis of HCC tissue. (A) Annotation of cell clusters into 11 cell categories. (B) Cluster classification of different cells. (C) The proportion of different cell types. (D) The communication network between CAFs and other cells.
Figure 2 — Identification and validation of a cancer-associated fibroblasts-related scoring system to predict prognosis and immune landscape in hepatocellular carcinoma through integrated analysis of single-cell and bulk RNA-sequencing | Aging