Submit an Article
Navigate
Home
Editorial Board
Editorial Policies
Current Volume
Archive
Scientific Integrity
Publication Ethics Statements
Interviews with Outstanding Authors
Newsroom
Sponsored Conferences
Podcast
Contact
Special Collections
Submit an Article
Online ISSN: 1945-4589
Research Paper
|
Volume 15, Issue 21
|
pp. 11811–11830
Systematic analysis of glutamine metabolism family genes and exploration of the biological role of GPT in colorectal cancer
Back to article
Figure 4
(4 of 11)
−
100%
+
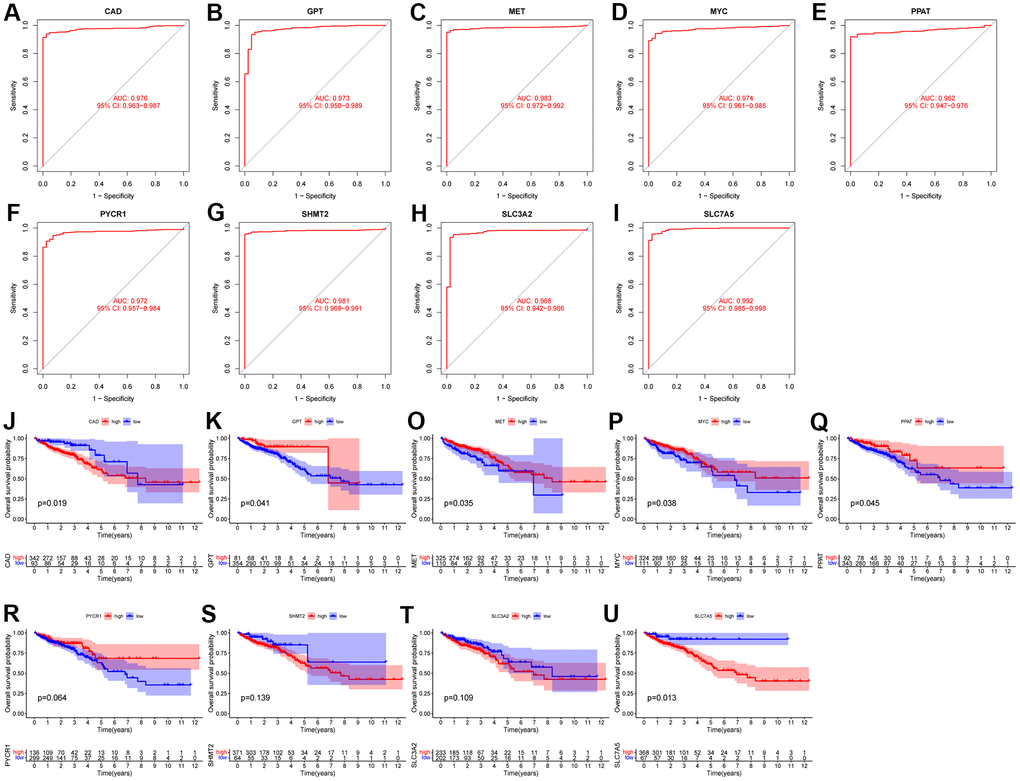
Figure 4.
Evaluation of diagnostic performance and prognostic value of characteristic genes.
(
A
–
I
) ROC curves of 9 characteristic genes. (
J
–
U
) KM survival curves of 9 characteristic genes.