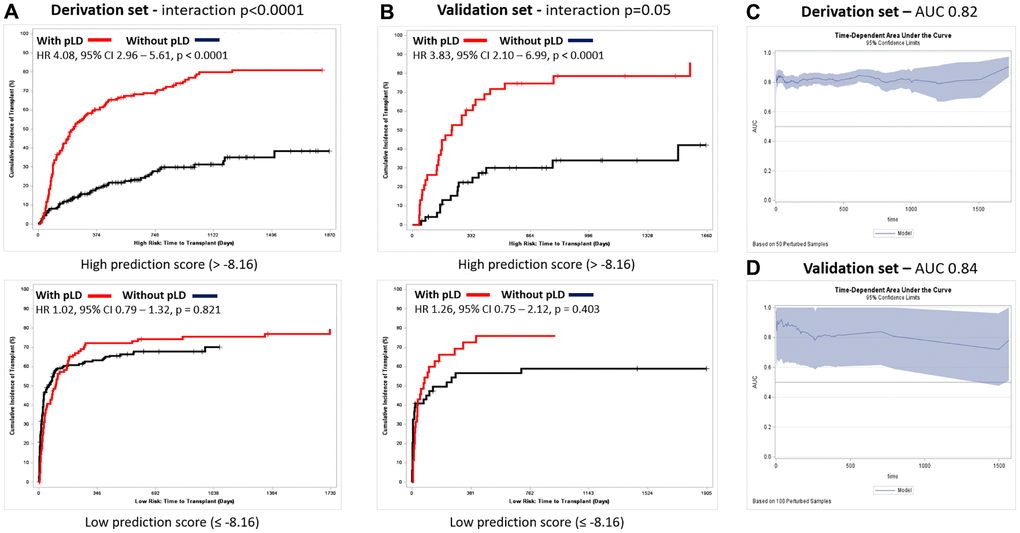
Figure 4.Prediction model performance. (A) Competing risk analysis for time to transplant stratified by availability of potential living donor for patients with Prediction score low vs. high on derivation set; interaction p < 0.0001. (B) Competing risk analysis for time to transplant stratified by availability of potential living donor for patients with Prediction score low vs. high on validation set; interaction p = 0.05. (C) Prediction Model area under curve on derivation set (0.82). (D) Prediction Model area under curve on validation set (0.84).