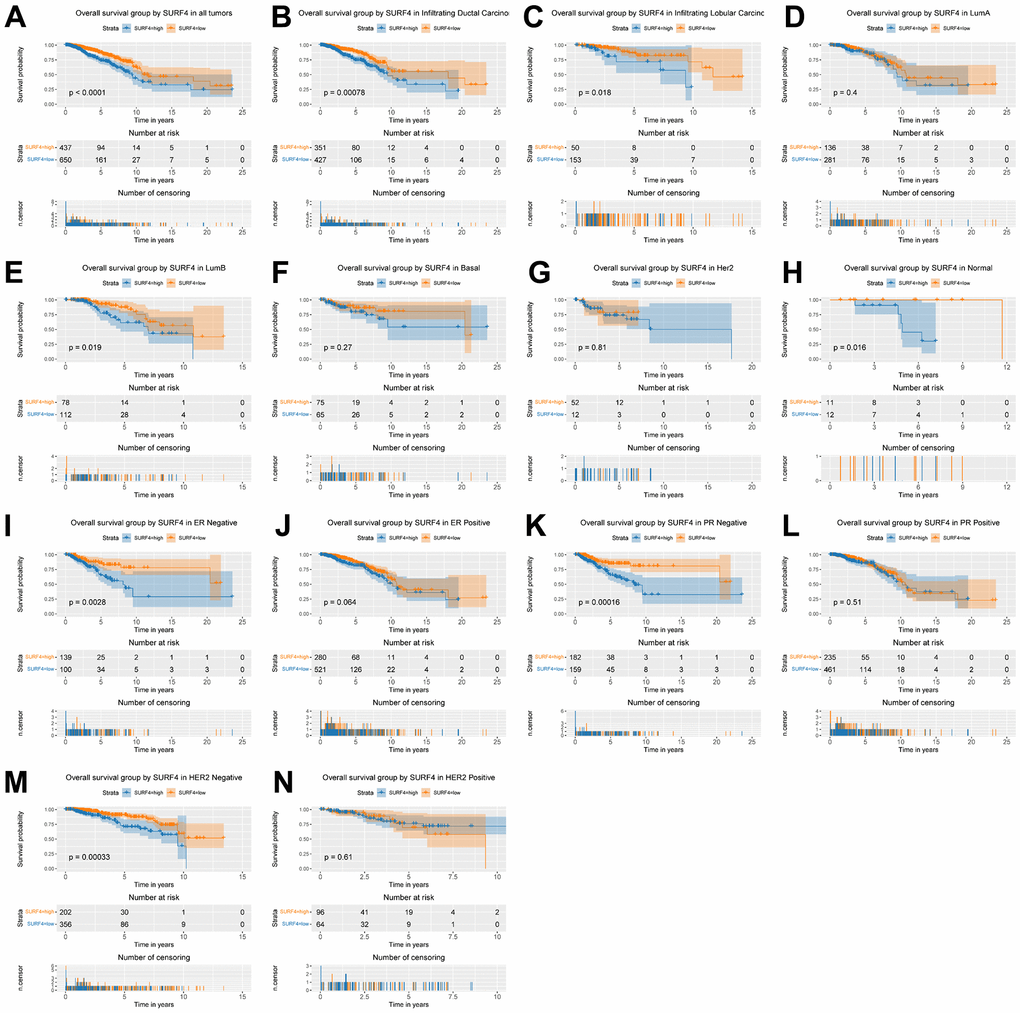
Figure 4.Kaplan-Meier curve for OS group by SURF4. (A) SURF4 in all tumors. (B–H) Subgroup analysis according to typing in infiltrating ductal carcinoma, infiltrating lobular carcinoma, Luminal A, Luminal B, basal-like, HER2 overexpression, normal-like. (I–N) Subgroup analysis according to status in ER negative, ER positive, PR negative, PR positive, HER2 negative, and HER2 positive.