Submit an Article
Navigate
Home
Editorial Board
Editorial Policies
Current Volume
Archive
Scientific Integrity
Publication Ethics Statements
Interviews with Outstanding Authors
Newsroom
Sponsored Conferences
Podcast
Contact
Special Collections
Submit an Article
Online ISSN: 1945-4589
Research Paper
|
Volume 14, Issue 21
|
pp. 8719–8728
Serum adenosine deaminase activity and acute cerebral infarction: a retrospective case-control study based on 7913 participants
Back to article
Figure 3
(3 of 4)
−
100%
+
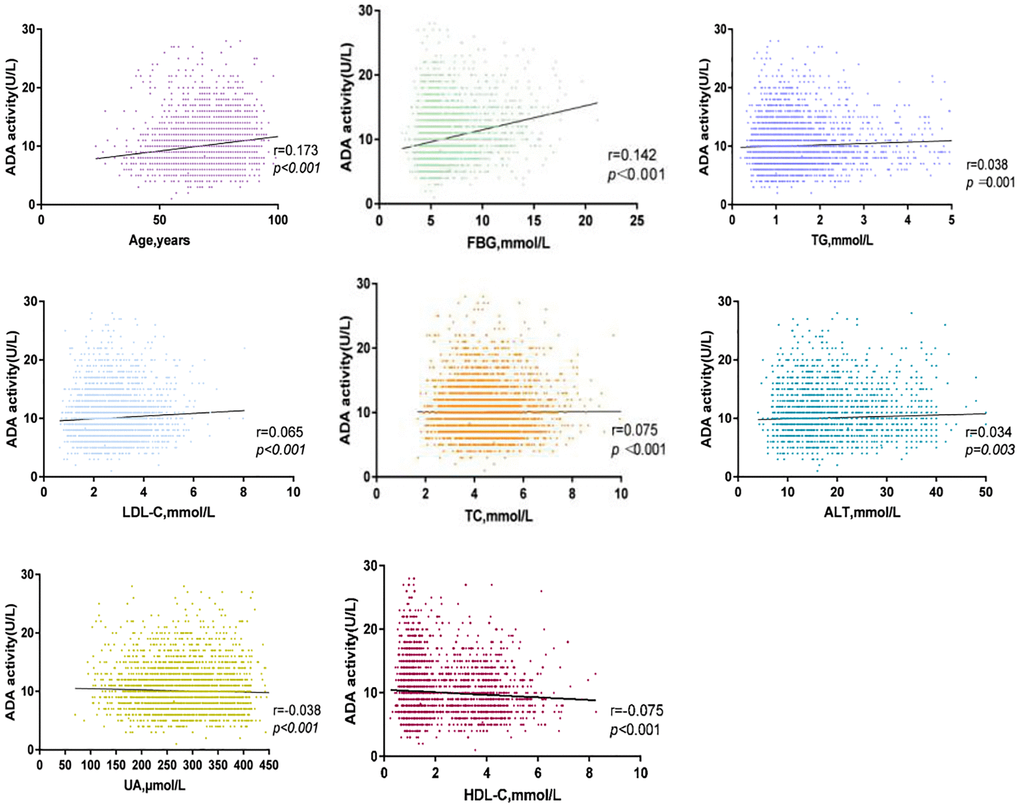
Figure 3.
Correlation between serum ADA and TC, ALT, FBG, LDL-C, Age, UA, HDL-C, TG in ACI group.