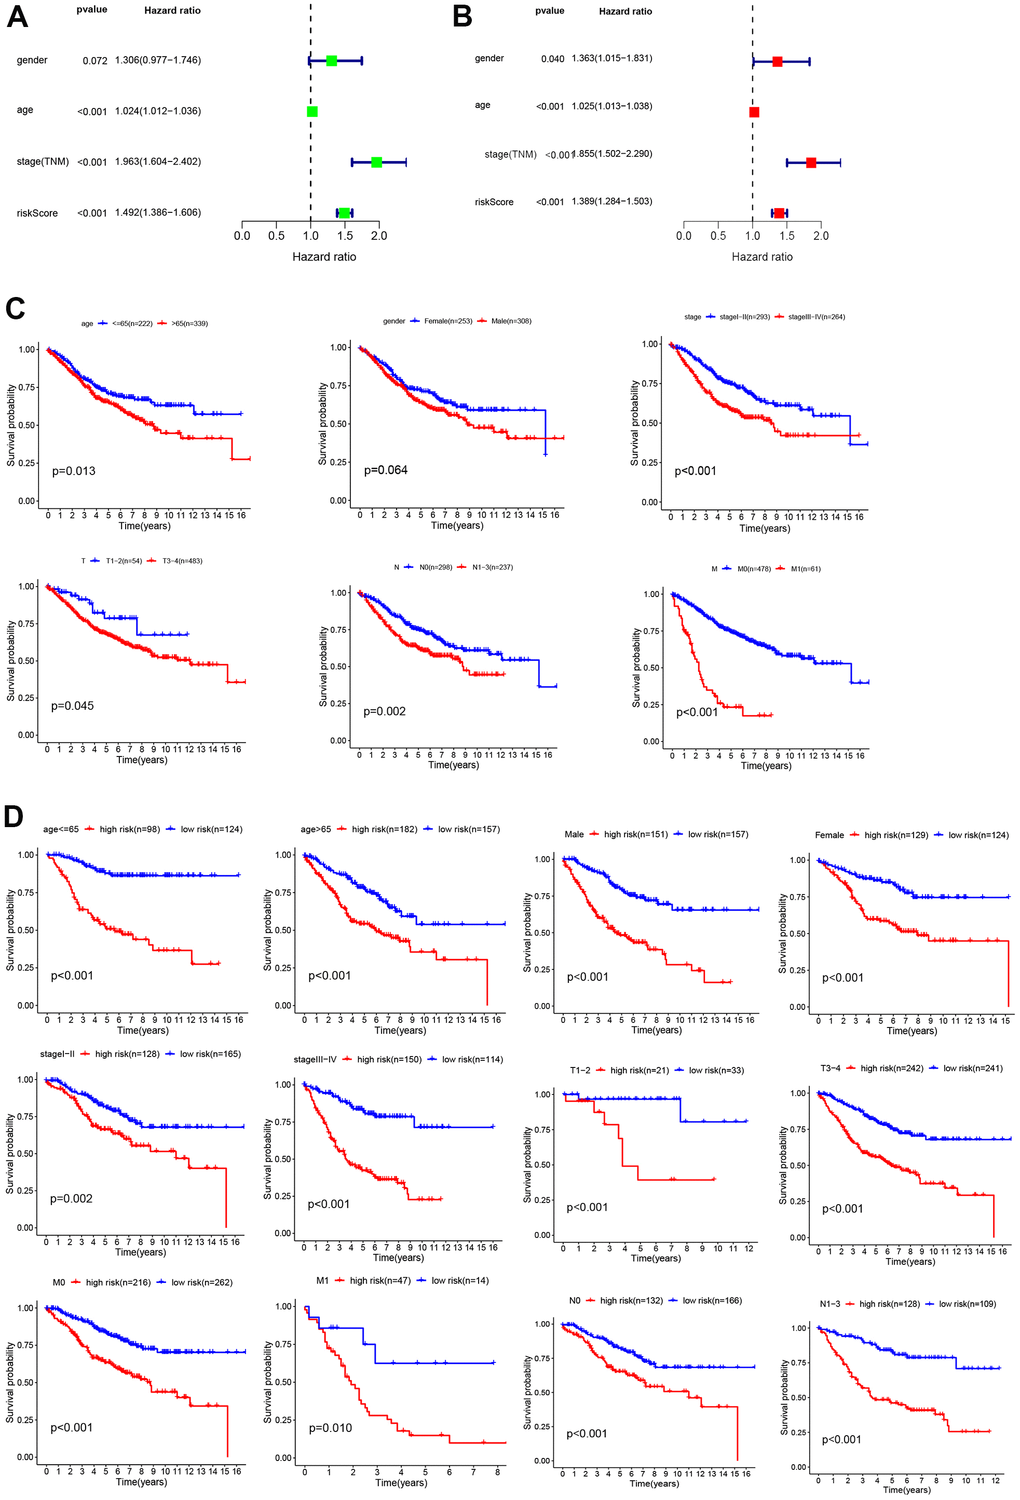
Figure 4.Analysis of risk factors. Univariate (A) and multivariate Cox regression analyses (B) of the relationship between risk core and other clinical features. (C) Kaplan–Meier analysis of clinical features, including age, sex, TNM stage, T stage, N stage, and M stage. (D) Kaplan–Meier analysis of clinical features in low- and high-risk subgroups.