Submit an Article
Navigate
Home
Editorial Board
Editorial Policies
Current Volume
Archive
Scientific Integrity
Publication Ethics Statements
Interviews with Outstanding Authors
Newsroom
Sponsored Conferences
Podcast
Contact
Special Collections
Submit an Article
Online ISSN: 1945-4589
Research Paper
|
Volume 14, Issue 14
|
pp. 5620–5627
Common electrocardiogram measures are not associated with telomere length
Back to article
Figure 2
(2 of 2)
−
100%
+
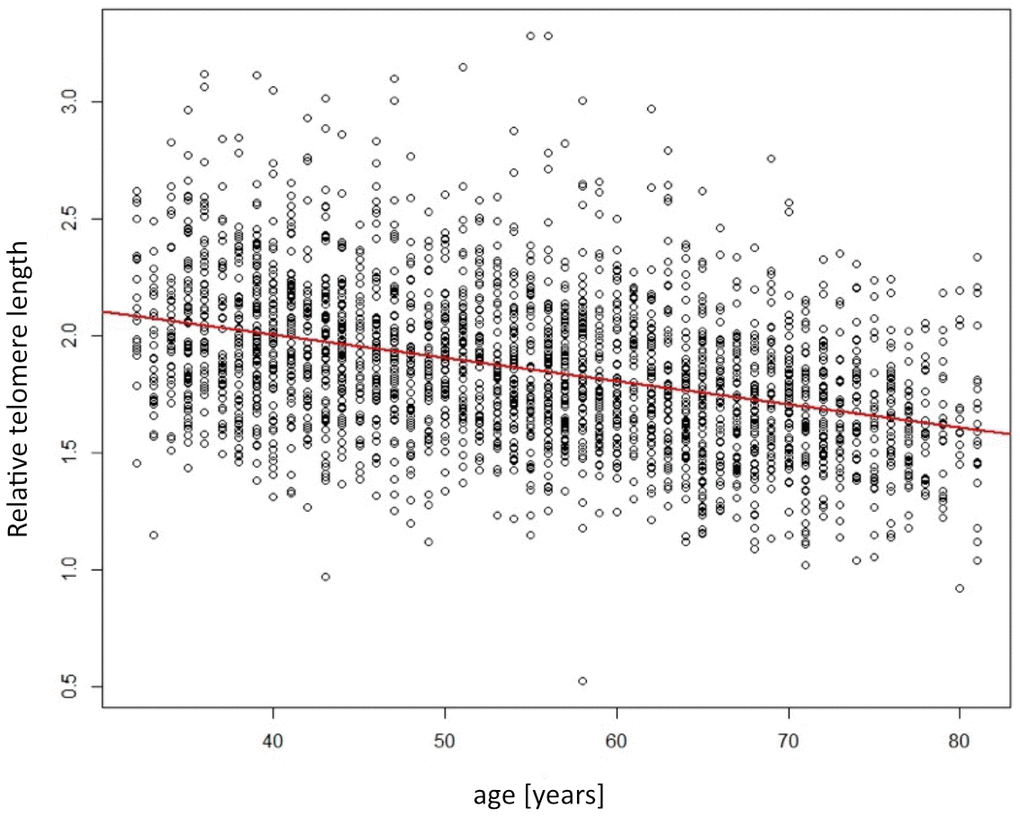
Figure 2.
Scatterplot showing the relation of telomere length (y-axis) depending on age (x-axis).
Red line indicates the linear regression line.