Submit an Article
Navigate
Home
Editorial Board
Editorial Policies
Current Volume
Archive
Scientific Integrity
Publication Ethics Statements
Interviews with Outstanding Authors
Newsroom
Sponsored Conferences
Podcast
Contact
Special Collections
Submit an Article
Online ISSN: 1945-4589
Research Paper
|
Volume 14, Issue 12
|
pp. 5223–5232
The efficacy of adding hyperthermia to the treatment of advanced NSCLC patients based on the states of EGFR
Back to article
Figure 2
(2 of 4)
−
100%
+
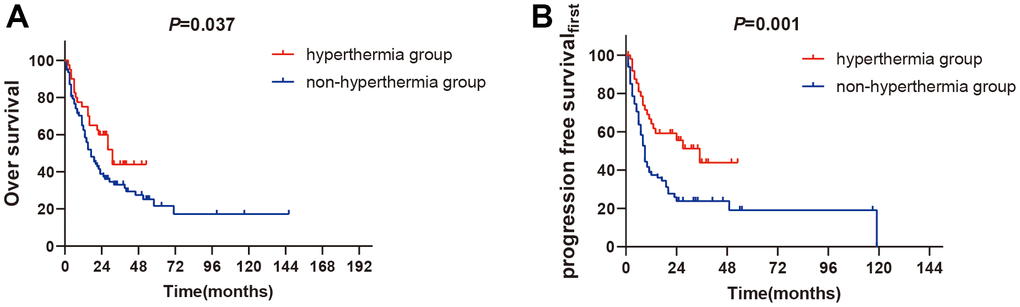
Figure 2.
The subgroups analysis of non-EGFR mutation between two groups.
(
A
) 1-year OS rates of non-EGFR mutation between two groups (P<0.05). (
B
) 1-year PFS
first
rates of non-EGFR mutation between two groups (
P<0.01
).