Submit an Article
Navigate
Home
Editorial Board
Editorial Policies
Current Volume
Archive
Scientific Integrity
Publication Ethics Statements
Interviews with Outstanding Authors
Newsroom
Sponsored Conferences
Podcast
Contact
Special Collections
Submit an Article
Online ISSN: 1945-4589
Research Paper
|
Volume 13, Issue 19
|
pp. 23262–23283
Whole-exome sequencing of rectal cancer identifies locally recurrent mutations in the Wnt pathway
Back to article
Figure 9
(9 of 11)
−
100%
+
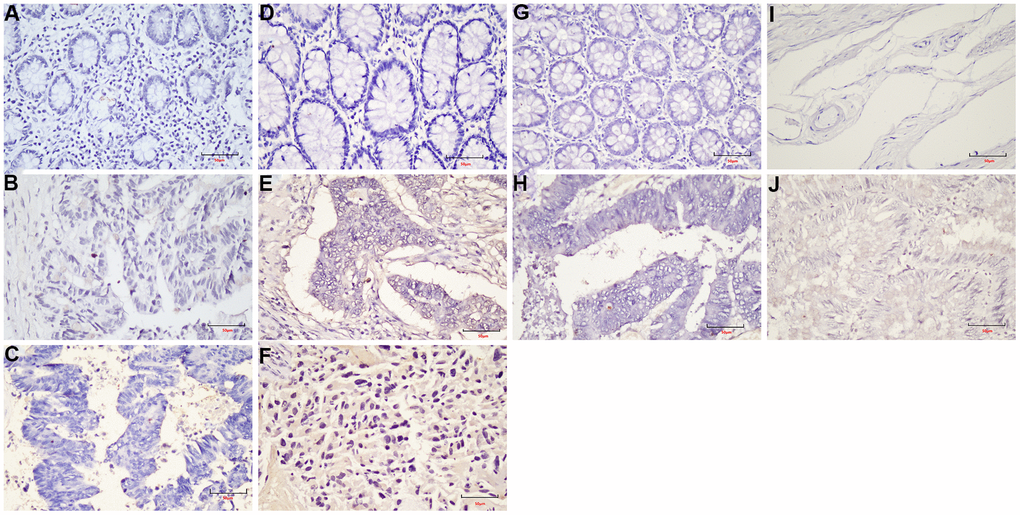
Figure 9.
The expression of
LEF1
in FFPE samples.
(
A
) DST-LRRC; (
B
) DST-PRC; (
C
) DST-rectal tissue; (
D
) LZQ-LRRC; (
E
) LZQ-PRC; (
F
) LZQ-rectal tissue; (
G
) LHC-NRRC; (
H
) LHC-rectal tissue; (
I
) SCC-NRRC; (
J
) SCC-rectal tissue. Scale bar=50μm.