Submit an Article
Navigate
Home
Editorial Board
Editorial Policies
Current Volume
Archive
Scientific Integrity
Publication Ethics Statements
Interviews with Outstanding Authors
Newsroom
Sponsored Conferences
Podcast
Contact
Special Collections
Submit an Article
Online ISSN: 1945-4589
Research Paper
|
Volume 13, Issue 4
|
pp. 5906–5927
Associations between
TUBB-WWOX
SNPs, their haplotypes, gene-gene, and gene-environment interactions and dyslipidemia
Back to article
Figure 5
(5 of 5)
−
100%
+
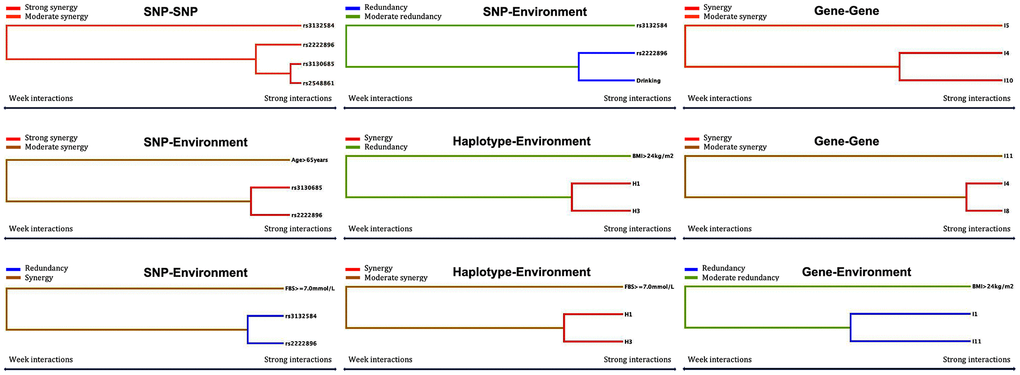
Figure 5.
Optimal interactions affecting dyslipidemia shown in a dendrogram.
Elements that interact strongly with each other appear close together in the leaves of the tree, while elements that interact weakly appear far from each other.