Submit an Article
Navigate
Home
Editorial Board
Editorial Policies
Current Volume
Archive
Scientific Integrity
Publication Ethics Statements
Interviews with Outstanding Authors
Newsroom
Sponsored Conferences
Podcast
Contact
Special Collections
Submit an Article
Online ISSN: 1945-4589
Research Paper
|
Volume 11, Issue 21
|
pp. 9328–9347
Bioinformatic profiling of prognosis-related genes in the breast cancer immune microenvironment
Back to article
Figure 4
(4 of 8)
−
100%
+
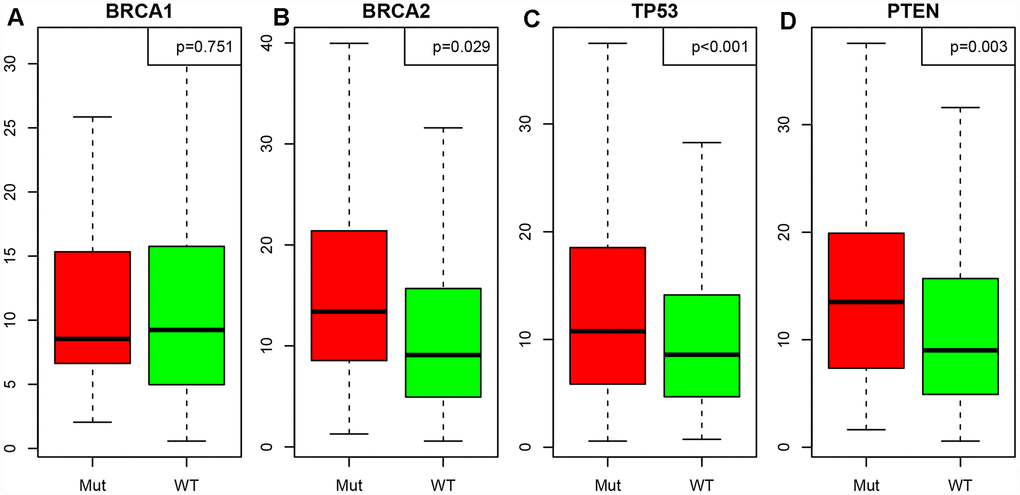
Figure 4.
Correlation between the LCK metagene score and gene mutations.
(
A
)
BRCA1
, (
B
)
BRCA2
, (
C
)
TP53
, (
D
)
PTEN
. Mut: mutant; WT: wild-type. Data are presented as the mean ± SEM.