


Introduction
A significant global health challenge is presented by colorectal cancer (CRC), with high mortality rates and an urgent requirement for improved diagnostic and therapeutic strategies [1, 2]. Successful treatment outcomes rely heavily on early detection, but the lack of reliable biomarkers currently poses a significant obstacle [3]. Thankfully, recent progress in transcriptome analysis provides a promising avenue for the identification of potential biomarkers and the unraveling of the complex molecular mechanisms involved in CRC development [4]. Metabolic reprogramming is a key characteristic of CRC, involving changes in the energy metabolism of cancer cells [5]. This reprogramming has generated increased interest in the role of solute carrier (SLC) transporters, a protein family accountable for the transportation of various metabolites across cell membranes [6].
Cancer, including colorectal cancer, is characterized by metabolic reprogramming [7]. Altered metabolic phenotypes are observed in cancer cells to fulfill their heightened energy requirements for rapid growth and survival [8]. In colorectal cancer (CRC), a significant metabolic change known as the Warburg effect occurs [9]. This effect involves an increased dependence on glycolysis, even in the presence of oxygen, leading to higher lactate production [10]. This metabolic shift not only supplies cancer cells with ample energy but also aids in the generation of metabolic intermediates essential for biosynthesis and maintaining redox homeostasis [11].
Alongside increased glycolysis, dysregulated nutrient uptake and utilization are observed in CRC cells, regulated by SLC transporters [12]. These transporters play vital roles in the cellular acquisition of nutrients, including glucose, amino acids, vitamins, and ions [13]. In CRC, specific SLC transporters exhibit disrupted expression and activity, indicating their potential as targets for diagnosis and treatment [14]. For instance, CRC is associated with elevated expression of glucose transporters (GLUTs), particularly GLUT1 and GLUT3, which enhance glucose uptake and metabolism [15]. Similarly, altered expression of amino acid transporters like SLC1A5 and SLC7A5 is linked to increased uptake of amino acids, fueling the anabolic processes required for tumor growth and survival [16, 17].
The dysregulation of SLC transporters in CRC offers a promising prospect for the discovery of new biomarkers [18]. RNA sequencing and other transcriptome analysis methods allow researchers to study the gene expression patterns of cancer cells and compare them to those of healthy tissue samples [19]. By employing these analyses, changes in the expression of SLC transporters and related metabolic genes can be detected, leading to the identification of potential biomarker candidates.
The potential of SLC transporters as CRC biomarkers has already been established through various studies. For example, the upregulation of SLC2A1 (encoding GLUT1) has been linked to advanced stages of CRC, unfavorable prognosis, and enhanced resistance to chemotherapy [20]. Additionally, overexpression of SLC6A14, an amino acid transporter, has been associated with lymph node metastasis and unfavorable survival outcomes in CRC patients [21]. These findings indicate that the expression levels of certain SLC transporters can serve as indicators of disease progression and patient prognosis.
Furthermore, the dysregulation of SLC transporters in CRC holds potential for targeted therapies [22]. By leveraging the abnormal expression of these transporters, it may be feasible to devise innovative therapeutic approaches that specifically disrupt the metabolic weaknesses of cancer cells while preserving normal tissues [23]. For instance, preclinical studies have demonstrated promising outcomes by targeting GLUT transporters in conjunction with conventional chemotherapy or radiotherapy. This combination approach has enhanced treatment effectiveness and surmounted drug resistance.
This study aimed to explore the involvement of SLC12A9 in colorectal cancer (CRC) through multiple analysis techniques, including expression analysis and prognostic evaluation. The objective was to investigate the expression patterns of SLC12A9 and determine its potential as a prognostic indicator and therapeutic target in CRC. The findings aimed to provide insights into the significance of SLC12A19 as a potential biomarker and therapeutic target in CRC.
Methods
Data download and processing
The transcriptome dataset used in this study to investigate colorectal cancer (CRC) was obtained from the TCGA and GEO databases. The dataset was selected based on specific inclusion criteria, including: (1) the tissue samples were of human origin, (2) there were more than 6 tumor and normal tissue samples, (3) the expression data included SLC12A9, and (4) the platform annotation file allowed for the conversion of probe names to gene names. The dataset underwent filtration based on these conditions, and all data were log-standardized for subsequent analysis. Additionally, for single-cell analysis of colorectal cancer, the dataset GSE188711 from the GEO database was utilized [24]. This dataset contains the transcriptomes of 27,927 cells from 3 left and 3 right CRC patients. In this study, the authors found differences in T-cell exhaustion between left-sided and right-sided colon cancer and differences in immunotherapy.
Quality control and processing of single cell sequencing data
In this study, the single-cell sequencing data were processed and analyzed using the “Seurat” R package. Specific screening criteria were applied to both genes and cells, which included the following steps: (1) Genes expressed in less than 3 cells were removed. (2) Cells with less than 200 gene expressions were excluded. (3) Cells expressing more than 6000 genes were excluded. (4) Cells with a mitochondrial gene percentage higher than 0.15 were removed. (5) Cells with a total gene expression value exceeding 100,000 were removed.
For data integration, the “SCTransform” method was employed, with a high-variable gene threshold set at 3000. Standardization was performed using the “SCT” method. The dimensions were reduced using the RunTSNE function, with the “dims” parameter set to 20. Clustering of the samples was conducted with the parameters “k.perl = 20, resolution = 0.6, algorithm = 3, random.seed = 2023”.
Cell types were annotated based on marker genes described in published literature, and the results were visualized using a t-distributed stochastic neighbor embedding (TSNE) map.
The expression of SLC12A9 was investigated in colon cancer and normal tissues
The R software version 4.2.2 was utilized in this study. The expression of SLC12A9 in normal and colorectal cancer samples in each dataset was examined using the independent sample t-test. For visualization of the results, the “ggplot2” package was employed, presenting the findings through boxplots.
Clinical diagnostic value of SLC12A9 gene
ROC analysis of colorectal cancer and normal samples from each dataset was conducted using the “pROC” package. The results of the analysis were visualized to provide a graphical representation of the performance of the classifier.
The meta-analysis of different cohorts
For the meta-analysis, STATA 14.0 software and the “meta” R package were utilized. The standard mean deviation (SMD) was calculated to assess the expression level of SLC12A9 in colorectal cancer. In cases where significant heterogeneity was present (I2 > 0.50) among the included datasets, the random-effects model was selected for the analysis. To detect publication bias, the funnel function of the “meta” R package was employed, with a p-value ≥ 0.05 indicating no publication bias. Furthermore, the diagnostic value of SLC12A9 was assessed using the summary receiver operating characteristic (sROC) curve. Specificity and sensitivity measures were calculated to evaluate the diagnostic performance of SLC12A9.
Prognostic and clinical correlation analysis of SLC12A9
Based on the median value of SLC12A9 gene expression, the samples were categorized into high and low expression groups. The Kaplan-Meier (KM) survival analysis method was employed to generate survival curves based on these groups. Furthermore, the expression of SLC12A9 was examined in relation to different clinical characteristics, including gender, age, T stage, N stage, M stage, lymph node metastasis, and pathological stage. The rank-sum test was utilized to assess the significance of the differences in SLC12A9 expression among these clinical characteristics.
Gene set enrichment analysis
To identify the signaling pathways associated with SLC12A9 in colorectal cancer, Gene Set Enrichment Analysis (GSEA) was conducted. Initially, the differences between the high and low SLC12A9 expression groups were analyzed. The genes were then sorted in descending order of log2 fold change (log2FC) using the clusterProfiler package. Pathways with an adjusted p-value below 0.05 were considered enriched, indicating their potential association with SLC12A9 in colorectal cancer.
Correlation analysis of immune cell infiltration
In this study, the CIBERSORT method was employed to calculate the immune infiltration in each colorectal cancer sample. The rank sum test was then utilized to investigate the immune cell infiltration between the Low_SLC12A9 and High_SLC12A9 groups. Furthermore, the correlation between immune cells and SLC12A9 was analyzed using the “spearman” method. This analysis aimed to examine the relationship between the expression of SLC12A9 and the presence of immune cells in the tumor microenvironment of colorectal cancer.
Pseudo-time series analysis
In this study, the pseudo-time series analysis was conducted using the monocle2 package. Specifically, all immune cells were extracted for analysis. The parameters “max_components” were set to 2, and the method used was “DDRTree.” The results of the analysis were visualized using the plot_cell_trajectory function, which provided insights into the developmental trajectories of immune cells in colorectal cancer.
The construction of a nomogram
In this study, the “regplot” package was employed to integrate the expression of the gene SLC12A9 with other clinical features. This integration facilitated the construction of a nomogram, which was utilized to predict the 1, 3, and 5-year survival outcomes in colorectal cancer. The nomogram provided a graphical representation of the predictive model, incorporating multiple factors including SLC12A9 expression and clinical features to estimate survival probabilities at different time points.
The expression of SLC2A9 was verified by PCR
Next, we performed qRT-PCR assay on 6 pairs of colorectal cancer samples to obtain mRNA quantization from colorectal cancer and adjacent tissues. All six patients signed informed consent forms. This study was approved by the Ethics Committee of Fuyang Hospital affiliated to Anhui Medical University. Total cellular RNA was isolated from cells using Trizol Reagent (Invitrogen, Carlsbad, CA, USA) according to manufacturer’s instructions. Reverse transcription was performed using a reverse transcription kit provided by Takara (Otsu, Shiga, Japan). Real-time polymerase chain reaction (RT-PCR) was performed using a quantitative SYBR Green PCR kit (Takara) and Applied Biosystems QuantStudio 1 (Thermo Fisher, Waltham, MA, USA). The relative quantitative determination was performed by −2ΔΔCt method. The relative mRNA expression of each gene was normalized to the level of glyceraldehyde-3-phosphate dehydrogenase (GAPDH) mRNA. PCR uses the following primer sequence:
| SLC12A9: | |
| Forward | TGGCTATGCTGAGGACTA |
| Reverse | ATAGACGAAGAAGGTGTAGG |
| GAPDH: | |
| Forward | GAACGGGAAGCTCACTGG |
| Reverse | GCCTGCTTCACCACCTTCT |
Statistics analysis
Bioinformatics analysis was performed in R software (version 4.2.2). The Seurat package was used for single-cell sequencing analysis. The expression of SLC12A9 was analyzed using an independent sample t-test. p < 0.05 was considered statistically significant.
Results
Sample information for the datasets
A total of 10 data sets have been gathered, which encompass databases such as TCGA and GEO. The particulars of these data sets are provided in Table 1. Each dataset comprises data pertaining to both colorectal cancer and normal control. In order to analyze SLC12A9, the mean (Mean) and standard deviation (SD) were computed for both colorectal cancer and normal tissue samples.
Table 1. Characteristics of TCGA and GEO datasets included in the study.
| GSE number | Platform | NO | MO | SDO | N1 | M1 | SD1 | Total | |||||||||||||||||||||||||||||||||||||||||||||||||||||||||||||||||||||||||||||||||||||||||||
| TCGA Cohort | NR | 51 | 2.54 | 0.323 | 616 | 3.26 | 0.538 | 667 | |||||||||||||||||||||||||||||||||||||||||||||||||||||||||||||||||||||||||||||||||||||||||||
| GSE8671 | GPL570 | 32 | 7.44 | 0.281 | 32 | 7.86 | 0.305 | 64 | |||||||||||||||||||||||||||||||||||||||||||||||||||||||||||||||||||||||||||||||||||||||||||
| GSE10972 | GPL6104 | 24 | 10.4 | 0.337 | 24 | 11 | 0.552 | 48 | |||||||||||||||||||||||||||||||||||||||||||||||||||||||||||||||||||||||||||||||||||||||||||
| GSE41657 | GPL6480 | 12 | −0.321 | 0.284 | 25 | 0.315 | 0.4 | 37 | |||||||||||||||||||||||||||||||||||||||||||||||||||||||||||||||||||||||||||||||||||||||||||
| GSE73360 | GPL17586 | 31 | 6.36 | 0.212 | 55 | 6.72 | 0.224 | 86 | |||||||||||||||||||||||||||||||||||||||||||||||||||||||||||||||||||||||||||||||||||||||||||
| GSE84984 | GPL17586 | 6 | 6.12 | 0.206 | 9 | 6.79 | 0.177 | 15 | |||||||||||||||||||||||||||||||||||||||||||||||||||||||||||||||||||||||||||||||||||||||||||
| GSE106582 | GPL10558 | 117 | 8.64 | 0.3 | 77 | 9.17 | 0.506 | 194 | |||||||||||||||||||||||||||||||||||||||||||||||||||||||||||||||||||||||||||||||||||||||||||
| GSE110224 | GPL570 | 17 | 6.22 | 0.174 | 17 | 6.41 | 0.15 | 34 | |||||||||||||||||||||||||||||||||||||||||||||||||||||||||||||||||||||||||||||||||||||||||||
| GSE113513 | GPL15207 | 14 | 7.1 | 0.214 | 14 | 7.61 | 0.368 | 28 | |||||||||||||||||||||||||||||||||||||||||||||||||||||||||||||||||||||||||||||||||||||||||||
| GSE156355 | GPL21185 | 6 | 9.49 | 0.084 | 6 | 10 | 0.323 | 12 | |||||||||||||||||||||||||||||||||||||||||||||||||||||||||||||||||||||||||||||||||||||||||||
| Abbreviations: NO: normal tissue sample number; M0 and SD0: mean and standard deviation of normal (non-tumor) tissues; M1 and SD1: mean and Standard deviation of colorectal cancer; Total: total sample number. | |||||||||||||||||||||||||||||||||||||||||||||||||||||||||||||||||||||||||||||||||||||||||||||||||||
Expression of SLC12A9 in colorectal cancer and normal tissue samples
In the initial phase of this study, the expression of SLC12A9 was examined in tumor and normal tissues within each data set. Figure 1A–1J illustrates the findings, indicating that SLC12A9 exhibited an increased expression pattern in colorectal cancer across all data sets (TCGA cohort, GSE8671, GSE10972, GSE41657, GSE73360, GSE84984, GSE106582, GSE110224, GSE113513, GSE156355), in comparison to normal tissues (*p < 0.05, **p < 0.01, ***p < 0.001).
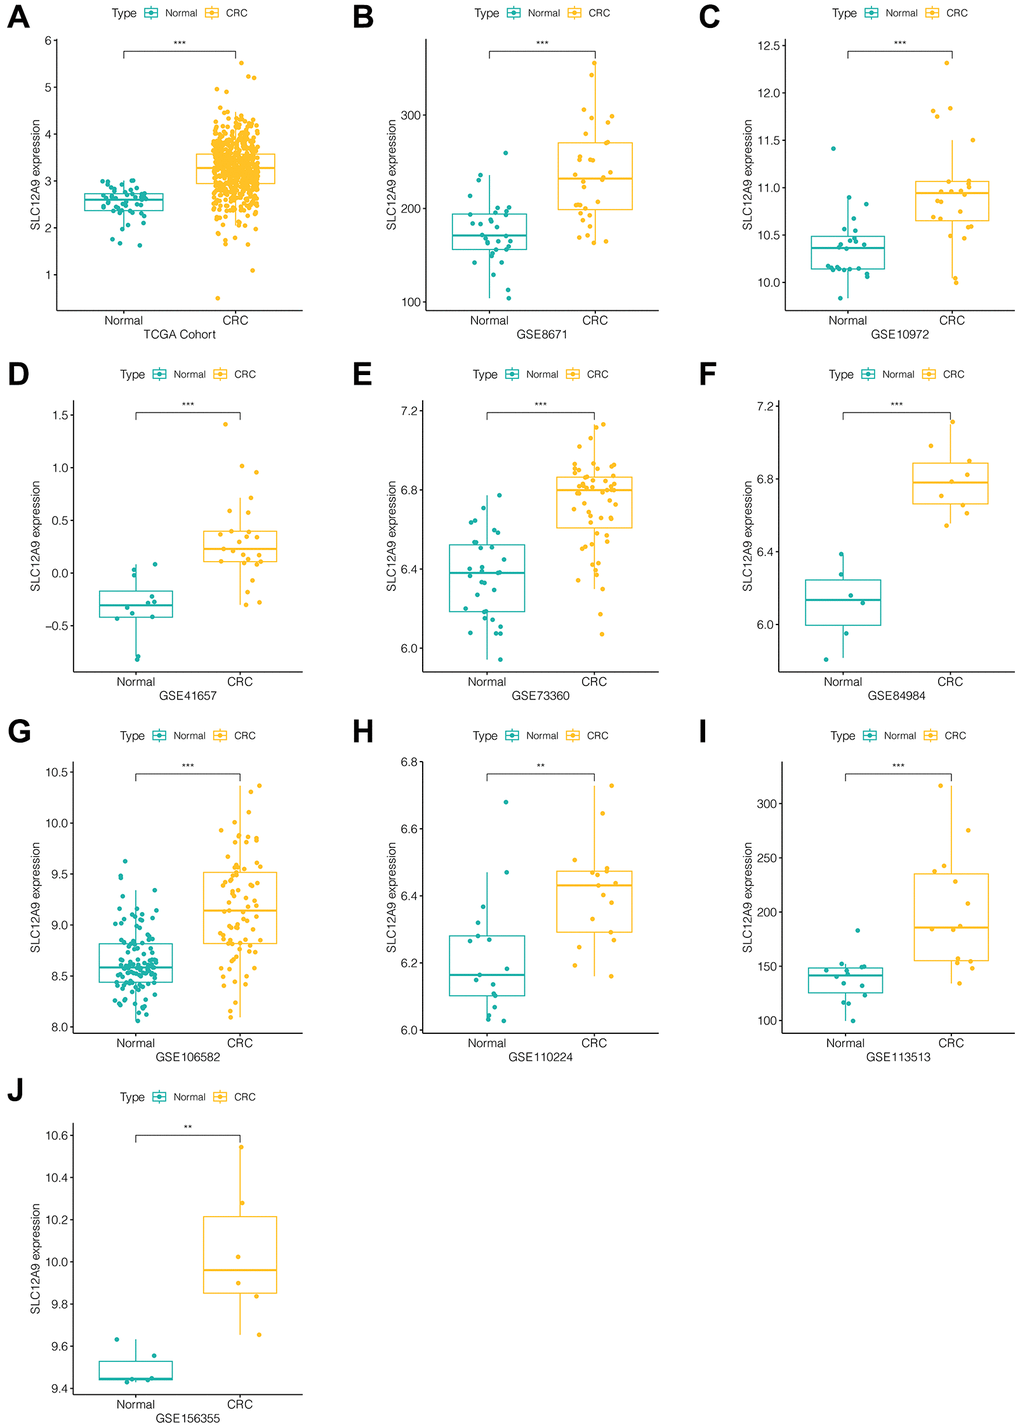
Figure 1. Expression of SLC12A9 in different cohorts. (A) TCGA cohort. (B) GSE8671. (C) GSE10972. (D) GSE41657. (E) GSE73360. (F) GSE84984. (G) GSE106582. (H) GSE110224. (I) GSE113513. (J) GSE156355.
Clinical diagnostic value of SLC12A9 gene
The study further investigated the diagnostic potential of SLC12A9 in colorectal cancer. Figure 2A demonstrates that in the TCGA dataset, the area under the curve (AUC) was 0.892, indicating a moderate diagnostic value. Similarly, in Figure 2B–2J, specifically in data sets GSE8671, GSE10972, GSE73360, GSE106582, and GSE110224, the AUC values exceeded 0.8, signifying a substantial diagnostic value. Moreover, in data sets GSE41657, GSE84984, GSE113513, and GSE156355, the AUC values surpassed 0.9, indicating a high diagnostic value.
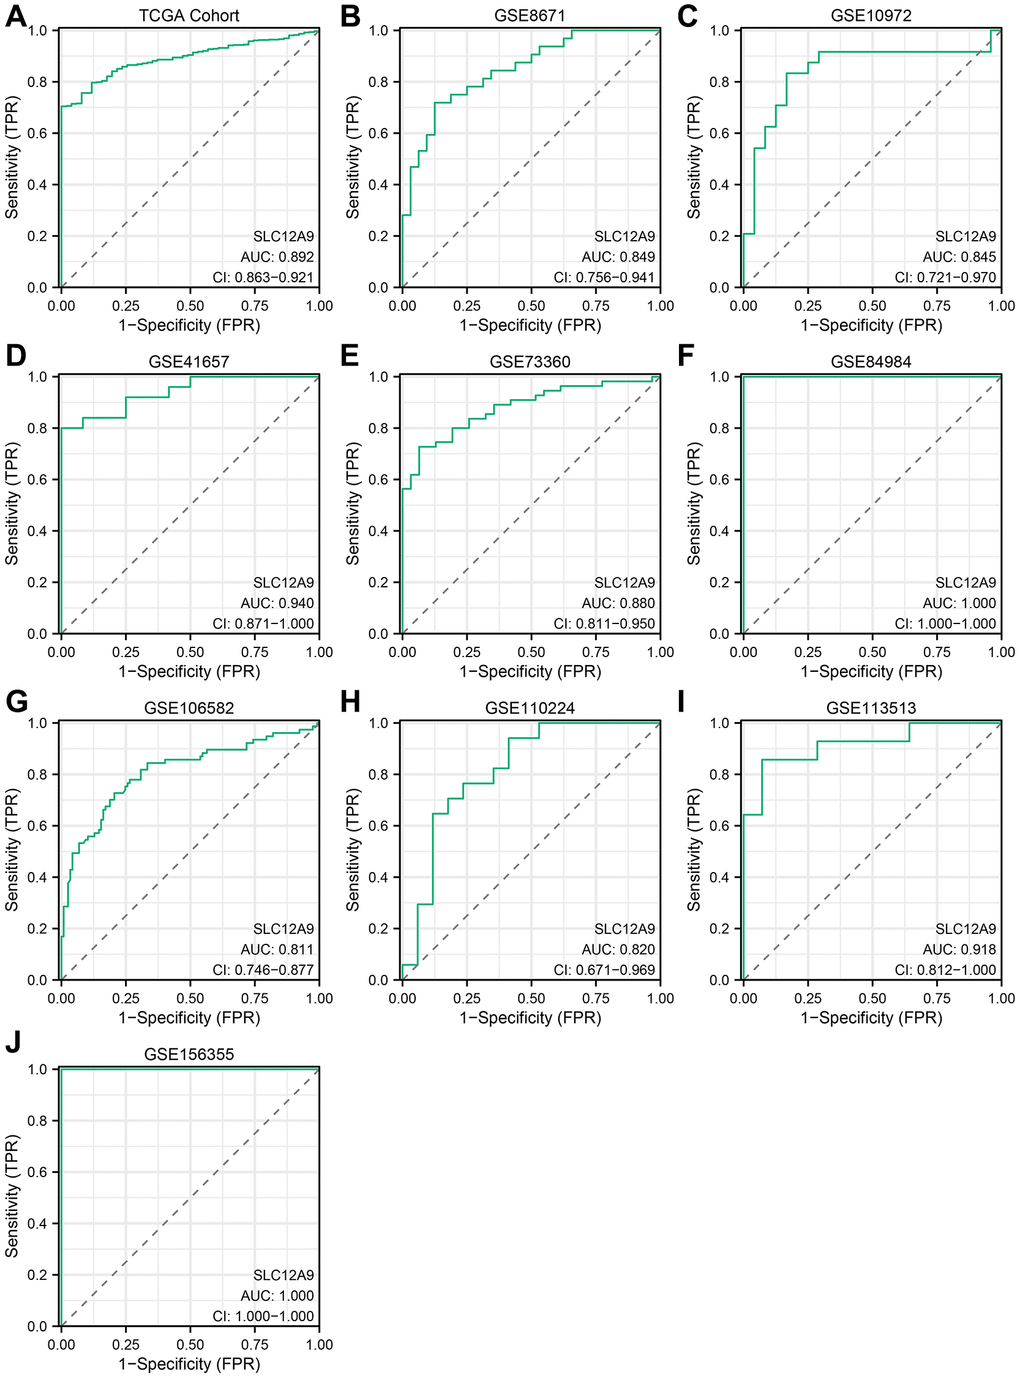
Figure 2. ROC curve of SLC12A9 in different cohorts. (A) TCGA cohort. (B) GSE8671. (C) GSE10972. (D) GSE41657. (E) GSE73360. (F) GSE84984. (G) GSE106582. (H) GSE110224. (I) GSE113513. (J) GSE156355.
The meta-analysis of SLC12A9 in multiple cohorts
Following that, a comprehensive analysis of the expression and clinical diagnostic value of the SLC12A9 gene was conducted. Figure 3A, 3B illustrates the results of the heterogeneity test, indicating significant heterogeneity with I2 = 68.6% (p-value < 0.05). To calculate the standardized mean difference (SMD), a random effects model was utilized, revealing a high expression of SLC12A9 in colorectal cancer (SMD = 1.42, 95%CI: 1.26–1.59). Additionally, sROC analysis was performed, as shown in Figure 3C, 3E, which yielded an AUC of 0.78 (95%CI: 0.74–0.82), sensitivity of 0.92 (95% CI: 0.83–0.96), and specificity of 0.74 (95% CI: 0.69–0.78), indicating that SLC12A9 possesses a moderate diagnostic value in colorectal cancer. Furthermore, Figure 3D presents Fagan’s diagram, where at a pre-detection probability of 50%, the probability of positive colorectal cancer detection using SLC12A9 was 90%, and the probability of negative colorectal cancer detection was 28%. Figure 3F shows no significant publication bias. These findings suggest that SLC12A9 holds potential as an effective biomarker for colorectal cancer.
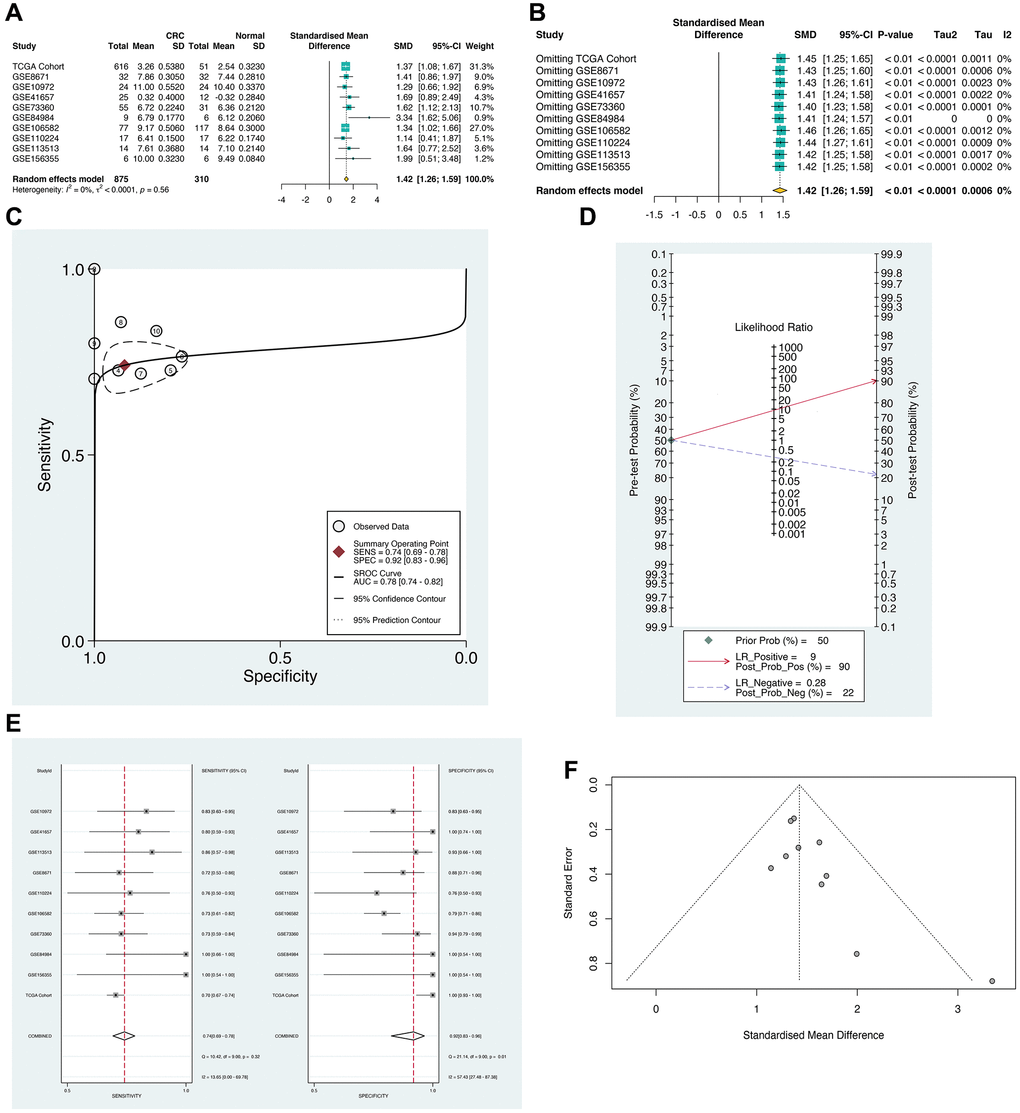
Figure 3. The meta-analysis of SLC12A9 in multiple cohorts. (A) Meta analysis result. Heterogeneity test. I2 = 68.6%. The results showed the high expression of SLC12A9 in colorectal cancer (SMD = 1.42, CI: 1.26-1.59). (B) Results of meta analysis after omitting. (C) sROC analysis. (D) Fagan’s diagram. (E) sROC analysis. (F) Detection of publication bias.
Prognostic and clinical correlation analysis of SLC12A9 gene
The impact of SLC12A9 on the prognosis of colon cancer has been investigated, as depicted in Figure 4A. Notably, patients in the high SLC12A9 group exhibited a poorer prognosis (p < 0.05). Subsequently, the expression of the SLC12A9 gene in patients with different clinical characteristics was examined. Figure 4B–4D demonstrates that there were no significant abnormalities in SLC12A9 expression based on gender, age, and T stage of the patients. However, in Figure 4E–4H, it is evident that SLC12A9 expression was up-regulated in patients with N1&N2 compared to N0 patients (p < 0.01). Additionally, the expression of SLC12A9 was elevated in M1 patients compared to M0 patients (p < 0.05). Moreover, SLC12A9 expression was higher in patients with lymph node metastasis compared to those without, and it was also higher in Stage III and Stage IV patients compared to Stage II patients (*p < 0.05, **p < 0.01).
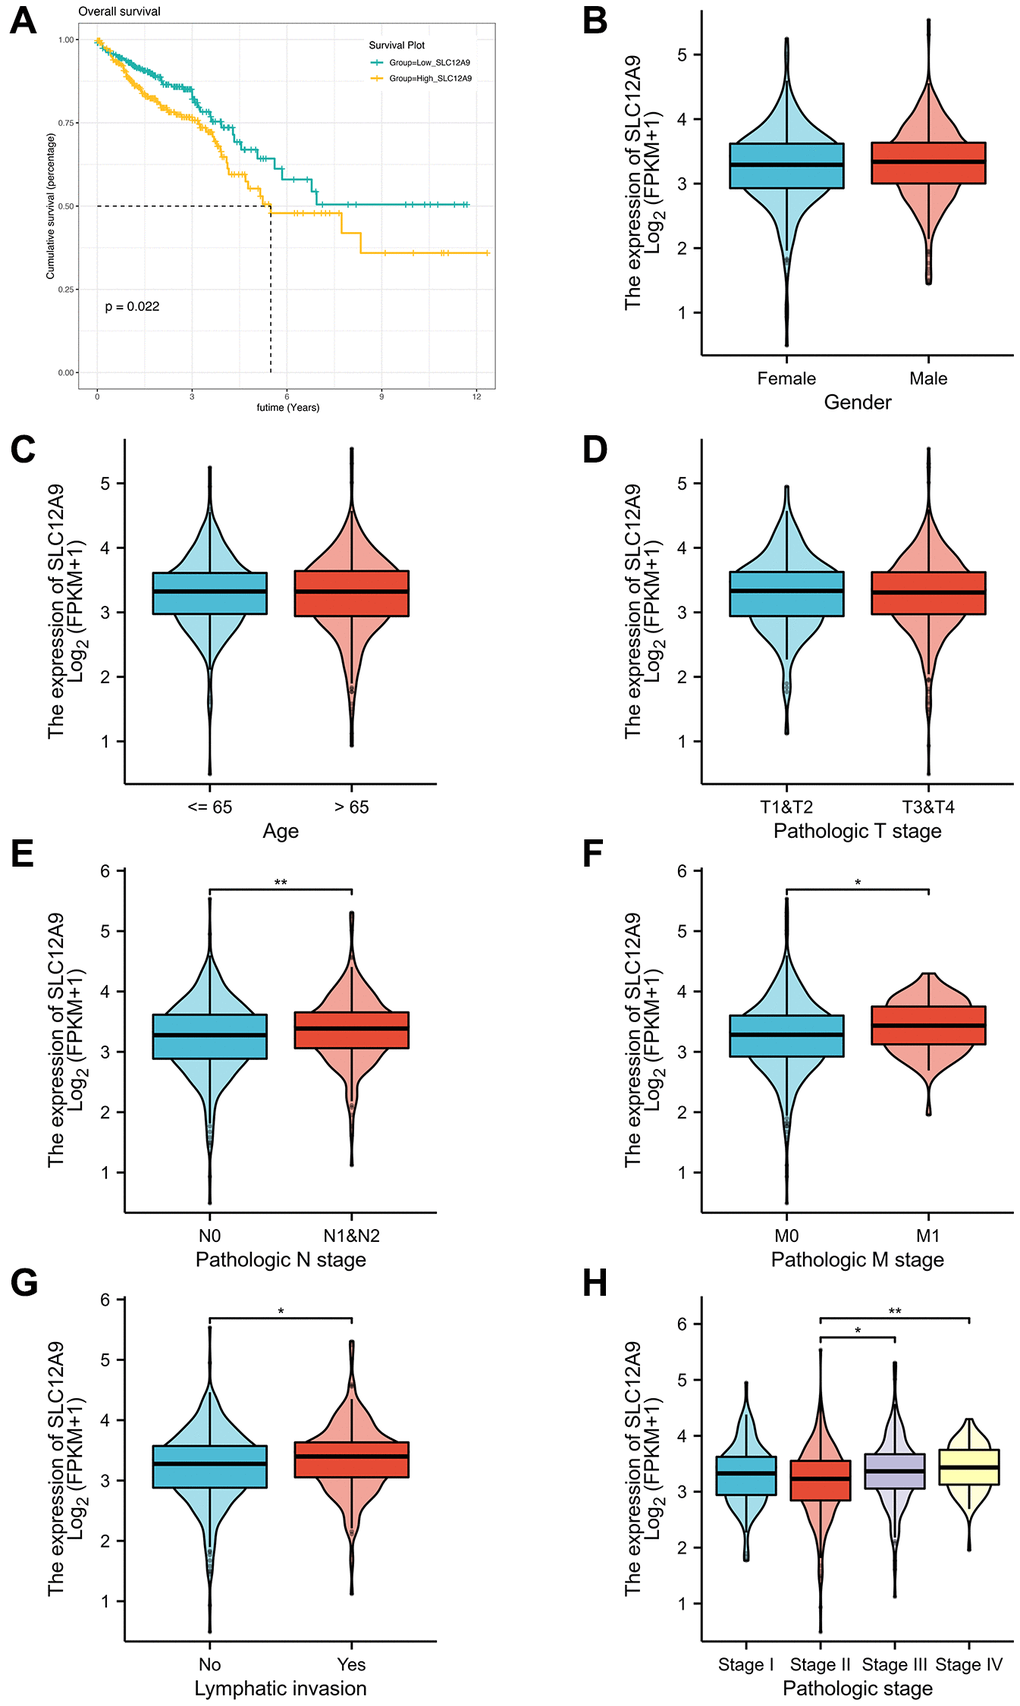
Figure 4. Prognostic and clinical correlation analysis of SLC12A9 gene. (A) Survival analysis showed that high expression of SLC12A9 was associated with poor prognosis in colorectal cancer. (B–D) There were no significant abnormalities in SLC12A9 expression based on gender, age, and T stage of the patients. (E–H) SLC12A9 expression was up-regulated in patients with N1&N2 compared to N0 patients (p < 0.01). Additionally, the expression of SLC12A9 was elevated in M1 patients compared to M0 patients (p < 0.05). Moreover, SLC12A9 expression was higher in patients with lymph node metastasis compared to those without, and it was also higher in Stage III and Stage IV patients compared to Stage II patients (p < 0.05).
Single cell analysis and enrichment analysis
Colorectal cancer single cell datasets were subjected to analysis. In Figure 5A, 5B, a total of 6 samples were utilized in the analysis. No noticeable batch effect was observed within these 6 samples, and the distribution of cell cycle types displayed a relatively even pattern in the TSNE diagram, indicating the suitability of the data for subsequent analysis. Figure 5C demonstrates the clustering of all cells into 19 distinct clusters, with clear gaps between them. Figure 5D, 5E shows the annotation of all cells into 10 cell types based on the expression of marker genes in each cluster. Notably, cluster 8 and cluster 12 exhibited no discernible expression of marker genes, and were therefore categorized as “unknown.” In Figure 5F, 5G, the expression of SLC12A9 in cells was examined, and cells were classified into high and low expression groups based on the median value. It was observed that cells with high SLC12A9 expression were primarily macrophages and epithelial cells. To delve deeper into the activation pathway of SLC12A9, the FindMarkers function of Seurat was employed to identify marker genes specifically expressed in high-level SLC12A9 cells, as depicted in Figure 5H–5J. This analysis revealed the activation of apoptosis, hypoxia, and epithelial mesenchymal transition signaling pathways.
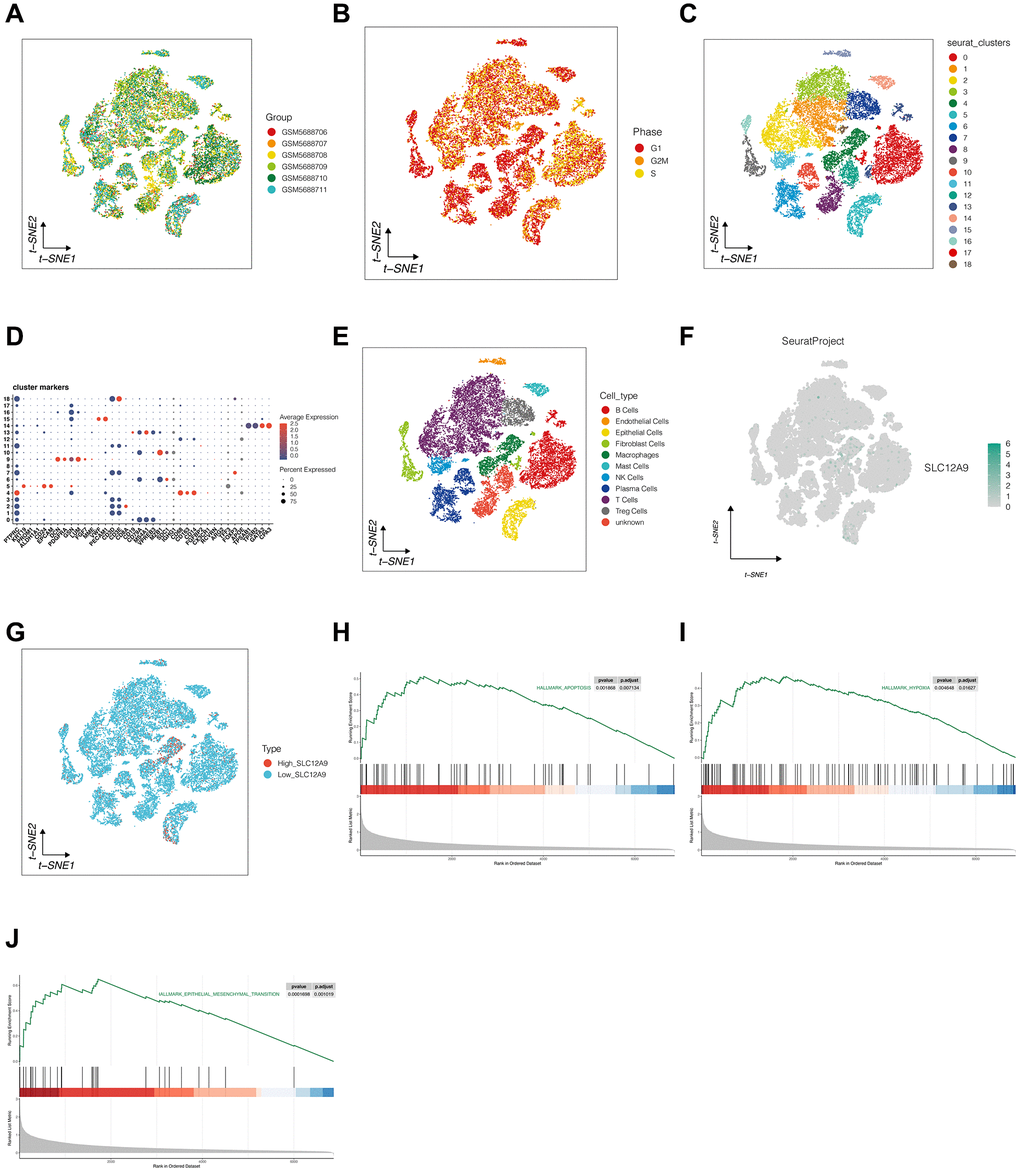
Figure 5. Single cell analysis and enrichment analysis. (A, B) Detection of batch effect. (C) The clustering of cells. (D, E) The annotation of all cells based on the expression of marker genes in each cluster. (F, G) The expression of SLC12A9 in different cells. (H–J) GSEA analysis.
Correlation analysis of immune cell infiltration
The investigation of the immune microenvironment in colorectal cancer was conducted. In Figure 6A, the infiltration of immune cells in each colorectal cancer sample from the TCGA dataset is displayed. Figure 6B reveals the significant upregulation of Macrophages M0, T cells regulatory (Tregs), and Macrophages M0 in the SLC12A9 group. Conversely, immune cells such as T cells CD4 memory activated, T cells CD4 naive, T cells follicular helper, T cells gamma delta, Neutrophils, and Eosinophils were significantly downregulated (p < 0.05). Figure 6C–6N demonstrate the positive correlation between immune cells and the expression of Macrophages M0, plasma cells, T cells CD4 naive, and T cells regulatory (Tregs). Moreover, the expression of SLC12A9 exhibited a positive correlation with the following immune cells: Dendritic cells activated, Eosinophils, Macrophage M1, Macrophage M2, Neutrophils, T cells CD4 memory activated, T cells follicular helper, and T cells gamma delta (p < 0.05). Subsequently, all immune cells were extracted, and time series analysis was simulated, as depicted in Figure 6O–6R. The color blue represents early differentiation of immune cells, while red represents late differentiation. Notably, macrophages were classified into three distinct differentiation states: Macrophage T cells, NK cells, Tregs, and macrophage B cells. State 3 corresponds to plasma cells, and the expression of SLC12A9 showed no significant changes across different states of immune cell differentiation.
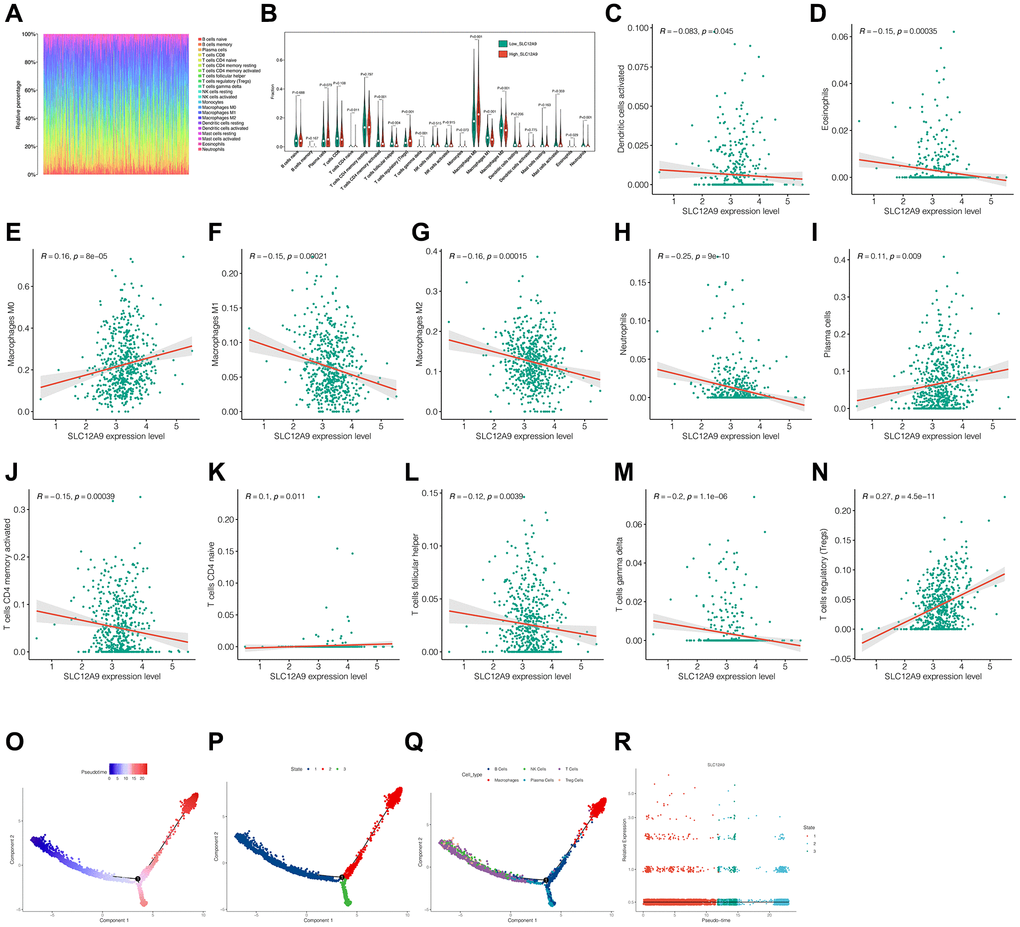
Figure 6. Correlation analysis of immune cell infiltration. (A) Immune landscape of colorectal cancer sample from the TCGA dataset. (B) Infiltration of different immune cells between high and low SLC12A9. (C–N) Correlation analysis between SLC12A9 and immune cells. (O–R) Pseudo-time series analysis of immune cells and SLC12A9.
The construction of Nomogram
To enhance the prediction of patient prognosis, a Nomogram was constructed based on the expression and clinical characteristics of patients with SLC12A9. Figure 7A presents the survival rates of patients with TCGA-G4-6309 at 1, 3, and 5 years, which were 0.959, 0.897, and 0.827, respectively. To further assess the prognostic accuracy of the Nomogram, prognostic ROC analysis was conducted, as depicted in Figure 7B–7D. The AUCs (Area Under the Curve) for the 1, 3, and 5-year prognostic ROC curves were 0.83, 0.81, and 0.72, respectively. These results indicate that the Nomogram exhibited a favorable predictive effect.
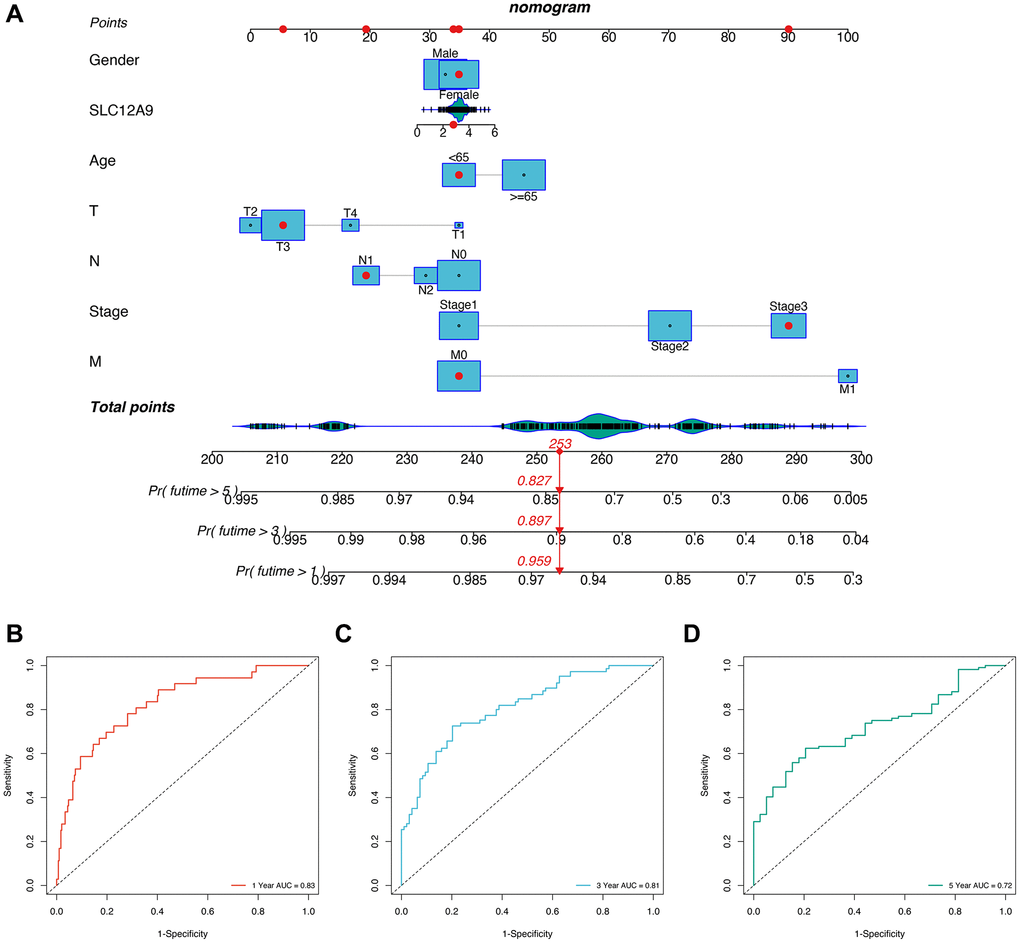
Figure 7. The construction of Nomogram. (A) The nomogram. (B–D) Prognostic ROC analysis in 1, 3, and 5-years.
The expression of SLC12A9 in clinical tissue samples was verified by qRT-PCR
To further validate the findings, qRT-PCR experiments were performed on 6 pairs of clinical colorectal cancer samples and their corresponding normal tissue samples, as illustrated in Figure 8. The results demonstrated a significant upregulation of SLC12A9 expression in colon cancer compared to the paired normal tissue samples (*p < 0.05).
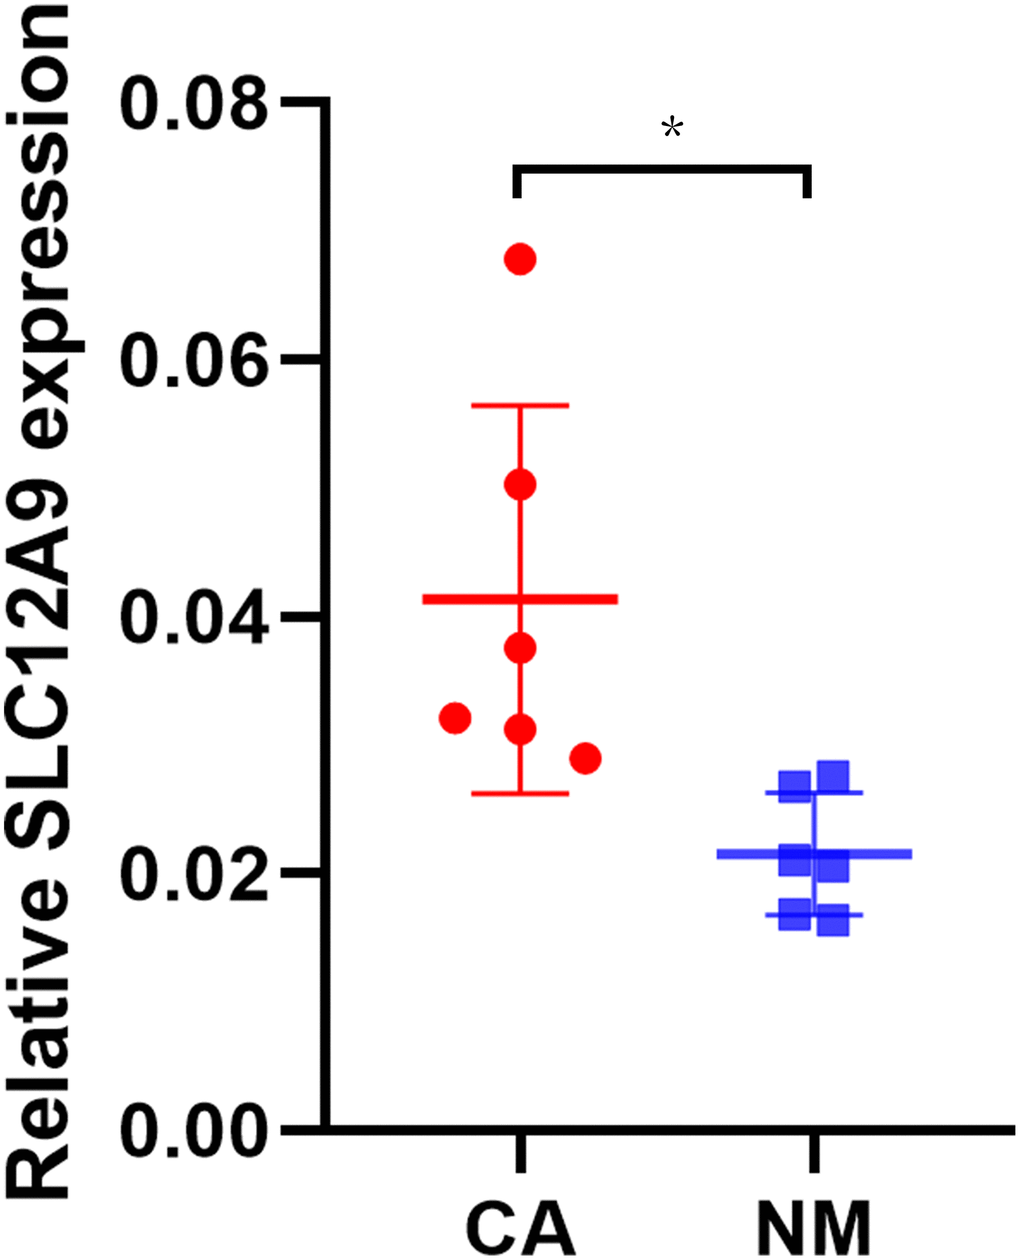
Figure 8. The qRT-PCR of SLC12A9. The results demonstrated a significant upregulation of SLC12A9 expression in colon cancer compared to the paired normal tissue samples (p < 0.05).
Discussion
CRC, a major worldwide health concern, contributes significantly to cancer-related mortality [25]. It originates from the epithelial cells of the colon or rectum and is influenced by a combination of genetic and environmental factors [26]. Timely detection of CRC is pivotal for effective treatment and enhanced patient survival rates [27]. However, existing diagnostic techniques like colonoscopy and fecal occult blood tests have drawbacks including invasiveness, high expenses, and limited sensitivity [28].
In addition, the prognosis of CRC exhibits significant variation based on the disease stage during diagnosis. Patients diagnosed with early-stage CRC generally experience more favorable prognoses, whereas those with advanced stages or metastasis encounter significantly poorer outcomes [29]. Hence, the identification of dependable biomarkers that can assist in early detection, risk assessment, and prognostic evaluation holds great significance in the management of CRC.
At present, some studies have preliminarily shown that SLC12A9 plays a key role in colorectal cancer. Yan et al. found that SLC12A9 promotes aggressiveness in uveal melanoma and may be associated with a poor prognosis [30]. However, no bioinformatics studies have explored the role of SLC12A9 in colorectal cancer in depth. This study aimed to comprehensively analyze the clinical significance of SLC12A9 in CRC using a combination of transcriptome analysis, single-cell sequencing, and qRT-PCR validation. Through the examination of SLC12A9 expression patterns and its potential diagnostic and prognostic relevance, valuable insights were obtained regarding its potential as a biomarker for CRC.
The findings of this study provide important information on the clinical utility of SLC12A9 as a potential biomarker for CRC diagnosis and prognosis. The analysis of SLC12A9 expression, supported by transcriptome analysis, single-cell sequencing, and qRT-PCR validation, highlights its potential as a diagnostic indicator for CRC. The observed upregulation of SLC12A9 in CRC tissues compared to adjacent normal tissues suggests its involvement in the development of CRC. Detecting elevated levels of SLC12A9 may enable clinicians to identify individuals at high risk of CRC, facilitating early intervention and ultimately leading to improved patient outcomes.
Additionally, our study uncovered the prognostic value of SLC12A9 in CRC, which is a significant finding. Patients with elevated SLC12A9 expression demonstrated inferior overall survival and disease-free survival, highlighting its potential as a prognostic biomarker. The independent prognostic significance of SLC12A9 further supports its value in risk stratification and guiding personalized treatment decisions. Integrating the assessment of SLC12A9 expression into existing prognostic models enables clinicians to better evaluate the aggressiveness of the disease and make informed decisions regarding tailored treatment approaches.
The clinical significance of our study lies in the potential practical application of SLC12A9 in routine clinical practice. The utilization of SLC12A9 as a target in non-invasive diagnostic tests, such as blood-based assays or stool-based tests, could revolutionize CRC screening and monitoring. These tests would offer enhanced sensitivity and specificity, enabling the early detection of CRC and its precancerous lesions. Moreover, incorporating SLC12A9 expression into existing prognostic models could augment their accuracy and provide more precise risk stratification for CRC patients, facilitating personalized treatment approaches and post-treatment care.
In conclusion, our study contributes to the growing body of evidence highlighting the clinical value of SLC12A9 as a diagnostic and prognostic biomarker in CRC. The dysregulated expression of SLC12A9 in CRC tissues, along with its association with clinicopathological features and patient outcomes, underscores its potential as a valuable tool in CRC management. Integrating SLC12A9 into clinical practice has the potential to enhance CRC screening, risk assessment, and treatment decision-making, ultimately leading to improved patient outcomes and a reduction in the global burden of CRC. However, there are some limitations to our study. We only have PCR validation of the samples. There is a lack of corresponding cohort for prognostic verification. At the same time, we did not study the downstream mechanism. We will improve it in the future.
Author Contributions
Wang Du and Guozhi Xia designed the study. Liang Chen, Lingjun Geng, Rubin Xu, Qingqing Han, Wang Du and Xiaomei Ying were involved in database search and statistical analyses. Liang Chen, Wang Du and Hongzhu Yu were involved in the writing of manuscript and its critical revision. Wang Du was involved in PCR experiment. All authors were responsible for the submission of the final version of the paper. All authors approved the final version. All authors agree to be accountable for all aspects of the work.
Acknowledgments
We are very grateful for data provided by databases such as TCGA and GEO.
Conflicts of Interest
The authors declare no conflicts of interest related to this study.
Ethical Statement and Consent
All procedures were performed in accordance with the declaration of the ethical standards of the institutional research committee and with the 1964 Helsinki 387 Declaration and its later amendments. The ethics committee has approved this study of Fuyang Hospital of Anhui Medical University (approval number KY2023052). All patients signed informed consent forms for the study.
Funding
All analysis and experiments were funded by Fuyang Hospital of Anhui Medical University.
References
- 1. Baidoun F, Elshiwy K, Elkeraie Y, Merjaneh Z, Khoudari G, Sarmini MT, Gad M, Al-Husseini M, Saad A. Colorectal Cancer Epidemiology: Recent Trends and Impact on Outcomes. Curr Drug Targets. 2021; 22:998–1009. https://doi.org/10.2174/1389450121999201117115717 [PubMed]
- 2. Haraldsdottir S, Einarsdottir HM, Smaradottir A, Gunnlaugsson A, Halfdanarson TR. [Colorectal cancer - review]. Laeknabladid. 2014; 100:75–82. https://doi.org/10.17992/lbl.2014.02.531 [PubMed]
- 3. Li J, Ma X, Chakravarti D, Shalapour S, DePinho RA. Genetic and biological hallmarks of colorectal cancer. Genes Dev. 2021; 35:787–820. https://doi.org/10.1101/gad.348226.120 [PubMed]
- 4. Joanito I, Wirapati P, Zhao N, Nawaz Z, Yeo G, Lee F, Eng CLP, Macalinao DC, Kahraman M, Srinivasan H, Lakshmanan V, Verbandt S, Tsantoulis P, et al. Single-cell and bulk transcriptome sequencing identifies two epithelial tumor cell states and refines the consensus molecular classification of colorectal cancer. Nat Genet. 2022; 54:963–75. https://doi.org/10.1038/s41588-022-01100-4 [PubMed]
- 5. Dong S, Liang S, Cheng Z, Zhang X, Luo L, Li L, Zhang W, Li S, Xu Q, Zhong M, Zhu J, Zhang G, Hu S. ROS/PI3K/Akt and Wnt/β-catenin signalings activate HIF-1α-induced metabolic reprogramming to impart 5-fluorouracil resistance in colorectal cancer. J Exp Clin Cancer Res. 2022; 41:15. https://doi.org/10.1186/s13046-021-02229-6 [PubMed]
- 6. Chen YJ, Hong WF, Liu ML, Guo X, Yu YY, Cui YH, Liu TS, Liang L. An integrated bioinformatic investigation of mitochondrial solute carrier family 25 (SLC25) in colon cancer followed by preliminary validation of member 5 (SLC25A5) in tumorigenesis. Cell Death Dis. 2022; 13:237. https://doi.org/10.1038/s41419-022-04692-1 [PubMed]
- 7. Ohshima K, Morii E. Metabolic Reprogramming of Cancer Cells during Tumor Progression and Metastasis. Metabolites. 2021; 11:28. https://doi.org/10.3390/metabo11010028 [PubMed]
- 8. Hay N. Reprogramming glucose metabolism in cancer: can it be exploited for cancer therapy? Nat Rev Cancer. 2016; 16:635–49. https://doi.org/10.1038/nrc.2016.77 [PubMed]
- 9. Zhong X, He X, Wang Y, Hu Z, Huang H, Zhao S, Wei P, Li D. Warburg effect in colorectal cancer: the emerging roles in tumor microenvironment and therapeutic implications. J Hematol Oncol. 2022; 15:160. https://doi.org/10.1186/s13045-022-01358-5 [PubMed]
- 10. Lu S, Han L, Hu X, Sun T, Xu D, Li Y, Chen Q, Yao W, He M, Wang Z, Wu H, Wei M. N6-methyladenosine reader IMP2 stabilizes the ZFAS1/OLA1 axis and activates the Warburg effect: implication in colorectal cancer. J Hematol Oncol. 2021; 14:188. https://doi.org/10.1186/s13045-021-01204-0 [PubMed]
- 11. Jing Z, Liu Q, He X, Jia Z, Xu Z, Yang B, Liu P. NCAPD3 enhances Warburg effect through c-myc and E2F1 and promotes the occurrence and progression of colorectal cancer. J Exp Clin Cancer Res. 2022; 41:198. https://doi.org/10.1186/s13046-022-02412-3 [PubMed]
- 12. De Mattia E, Toffoli G, Polesel J, D'Andrea M, Corona G, Zagonel V, Buonadonna A, Dreussi E, Cecchin E. Pharmacogenetics of ABC and SLC transporters in metastatic colorectal cancer patients receiving first-line FOLFIRI treatment. Pharmacogenet Genomics. 2013; 23:549–57. https://doi.org/10.1097/FPC.0b013e328364b6cf [PubMed]
- 13. Wang W, Zou W. Amino Acids and Their Transporters in T Cell Immunity and Cancer Therapy. Mol Cell. 2020; 80:384–95. https://doi.org/10.1016/j.molcel.2020.09.006 [PubMed]
- 14. Al-Abdulla R, Perez-Silva L, Abete L, Romero MR, Briz O, Marin JJG. Unraveling 'The Cancer Genome Atlas' information on the role of SLC transporters in anticancer drug uptake. Expert Rev Clin Pharmacol. 2019; 12:329–41. https://doi.org/10.1080/17512433.2019.1581605 [PubMed]
- 15. Chen H, Gao S, Liu W, Wong CC, Wu J, Wu J, Liu D, Gou H, Kang W, Zhai J, Li C, Su H, Wang S, et al. RNA N6-Methyladenosine Methyltransferase METTL3 Facilitates Colorectal Cancer by Activating the m6A-GLUT1-mTORC1 Axis and Is a Therapeutic Target. Gastroenterology. 2021; 160:1284–300.e16. https://doi.org/10.1053/j.gastro.2020.11.013 [PubMed]
- 16. Najumudeen AK, Ceteci F, Fey SK, Hamm G, Steven RT, Hall H, Nikula CJ, Dexter A, Murta T, Race AM, Sumpton D, Vlahov N, Gay DM, et al, and CRUK Rosetta Grand Challenge Consortium. The amino acid transporter SLC7A5 is required for efficient growth of KRAS-mutant colorectal cancer. Nat Genet. 2021; 53:16–26. https://doi.org/10.1038/s41588-020-00753-3 [PubMed]
- 17. Ma H, Wu Z, Peng J, Li Y, Huang H, Liao Y, Zhou M, Sun L, Huang N, Shi M, Bin J, Liao Y, Rao J, et al. Inhibition of SLC1A5 sensitizes colorectal cancer to cetuximab. Int J Cancer. 2018; 142:2578–88. https://doi.org/10.1002/ijc.31274 [PubMed]
- 18. Bendova P, Pardini B, Susova S, Rosendorf J, Levy M, Skrobanek P, Buchler T, Kral J, Liska V, Vodickova L, Landi S, Soucek P, Naccarati A, et al. Genetic variations in microRNA-binding sites of solute carrier transporter genes as predictors of clinical outcome in colorectal cancer. Carcinogenesis. 2021; 42:378–94. https://doi.org/10.1093/carcin/bgaa136 [PubMed]
- 19. Cecchin E, De Mattia E, Ecca F, Toffoli G. Host genetic profiling to increase drug safety in colorectal cancer from discovery to implementation. Drug Resist Updat. 2018; 39:18–40. https://doi.org/10.1016/j.drup.2018.07.001 [PubMed]
- 20. Liu XS, Yang JW, Zeng J, Chen XQ, Gao Y, Kui XY, Liu XY, Zhang Y, Zhang YH, Pei ZJ. SLC2A1 is a Diagnostic Biomarker Involved in Immune Infiltration of Colorectal Cancer and Associated With m6A Modification and ceRNA. Front Cell Dev Biol. 2022; 10:853596. https://doi.org/10.3389/fcell.2022.853596 [PubMed]
- 21. Lu Y, Jiang Z, Wang K, Yu S, Hao C, Ma Z, Fu X, Qin MQ, Xu Z, Fan L. Blockade of the amino acid transporter SLC6A14 suppresses tumor growth in colorectal Cancer. BMC Cancer. 2022; 22:833. https://doi.org/10.1186/s12885-022-09935-0 [PubMed]
- 22. Pizzagalli MD, Bensimon A, Superti-Furga G. A guide to plasma membrane solute carrier proteins. FEBS J. 2021; 288:2784–835. https://doi.org/10.1111/febs.15531 [PubMed]
- 23. Morioka S, Perry JSA, Raymond MH, Medina CB, Zhu Y, Zhao L, Serbulea V, Onengut-Gumuscu S, Leitinger N, Kucenas S, Rathmell JC, Makowski L, Ravichandran KS. Efferocytosis induces a novel SLC program to promote glucose uptake and lactate release. Nature. 2018; 563:714–8. https://doi.org/10.1038/s41586-018-0735-5 [PubMed]
- 24. Guo W, Zhang C, Wang X, Dou D, Chen D, Li J. Resolving the difference between left-sided and right-sided colorectal cancer by single-cell sequencing. JCI Insight. 2022; 7:e152616. https://doi.org/10.1172/jci.insight.152616 [PubMed]
- 25. Weitz J, Koch M, Debus J, Höhler T, Galle PR, Büchler MW. Colorectal cancer. Lancet. 2005; 365:153–65. https://doi.org/10.1016/S0140-6736(05)17706-X [PubMed]
- 26. Dekker E, Tanis PJ, Vleugels JLA, Kasi PM, Wallace MB. Colorectal cancer. Lancet. 2019; 394:1467–80. https://doi.org/10.1016/S0140-6736(19)32319-0 [PubMed]
- 27. Mahmoud NN. Colorectal Cancer: Preoperative Evaluation and Staging. Surg Oncol Clin N Am. 2022; 31:127–41. https://doi.org/10.1016/j.soc.2021.12.001 [PubMed]
- 28. Nfonsam V, Wusterbarth E, Gong A, Vij P. Early-Onset Colorectal Cancer. Surg Oncol Clin N Am. 2022; 31:143–55. https://doi.org/10.1016/j.soc.2021.11.001 [PubMed]
- 29. Kijima S, Sasaki T, Nagata K, Utano K, Lefor AT, Sugimoto H. Preoperative evaluation of colorectal cancer using CT colonography, MRI, and PET/CT. World J Gastroenterol. 2014; 20:16964–75. https://doi.org/10.3748/wjg.v20.i45.16964 [PubMed]
- 30. Yan C, Hu X, Liu X, Zhao J, Le Z, Feng J, Zhou M, Ma X, Zheng Q, Sun J. Upregulation of SLC12A3 and SLC12A9 Mediated by the HCP5/miR-140-5p Axis Confers Aggressiveness and Unfavorable Prognosis in Uveal Melanoma. Lab Invest. 2023; 103:100022. https://doi.org/10.1016/j.labinv.2022.100022 [PubMed]