


Introduction
Osteoporosis is a disease of the skeletal system, characterized by decreases in bone mass and density and structural deterioration, leading to bone fragility and increased fracture risk [1]. Globally, there are currently at least 200 million patients with osteoporosis. The prevalence of osteoporosis increases with aging in a population, particularly in female [2]. Data from the National Health Insurance Research Database in Taiwan revealed that the overall prevalence of osteoporosis in people aged ≥50 years increased from 17.4% to 25% in the period of 2001-2011 [3]. The prevalence of osteoporosis in males increased from 6.9% to 13.3%—and that of osteoporosis in females increased from 28.1% to 36.2% [3].
Bone mineral density (BMD) is a complex characteristic influenced by individual, environmental, and genetic factors. Aging, gender differences, vitamin D and calcium intake, smoking, and alcohol consumption influence bone mass and BMD [4–7]. Approximately 50%–80% of the decrease in BMD can be attributed to genetics and result in osteoporosis [8–11].
Genome-wide association study (GWAS) has become a widely used approach in genome research. This method is based on the use of linkage disequilibrium in chromosomes to map disease-causing alleles [12]. However, for several gene loci, despite repeated analyses by GWAS, their association with complex diseases has remained unclear [13]. An example has shown GWAS in osteoporosis-related study could only explain approximately 20% of the variation in BMD due to missing heritability and stringent statistical test value (p < 5 × 10⁻⁸) [14, 15]. The pathophysiological causes of osteoporosis are complex, with orchestration of various transcription factor (TF) and biological pathways, forming a complex regulatory network [16, 17]. A previous study used the GSE35958 database to analyze differentially expressed genes (DEGs) in patients with osteoporosis and a control group and identified the following osteoporosis-related TFs: E2F TF 4 (E2F4), early growth response 1 (EGR1), JUN proto-oncogene (JUN), trans-acting TF 1 (Sp1), TF 7-like 2 (TCF7L2), tumor protein p53 (TP53), and catenin (cadherin-associated protein) beta 1 (CTNNB1) [18, 19]. To our knowledge, polymorphisms in TF binding sites (TFBSs) have been explored their association with disease [20]. As a result, we aligned Taiwan BioBank polymorphisms database to binding sites of 7 chosen TFs by conserved motifs to seek potential disease-related single-nucleotide polymorphisms (SNPs) in Taiwanese. We performed a case–control study to investigate the association between the candidate SNPs and osteoporosis. Finally, we used the Genotype-Tissue Expression (GTEx) database to validate the functionality of SNPs.
Materials and Methods
Study participants
This case–control study was conducted between March 2015 and October 2019. In this study, 371 postmenopausal women (109 patients with osteoporosis and 262 healthy individuals) were enrolled from Tri-Service General Hospital (TSGH). None of the participants had any history of medication for treating osteoporosis. Data on the demographic and clinical characteristics of all participants were obtained from questionnaires and medical records.
Bone mineral density measurements
BMD (g/cm2), an indicator of osteoporosis, calculated by dividing the bone mineral content (g) by the bone area (cm2) [21], of all participants was measured using dual-energy X-ray absorptiometry (DXA) (GE Medical Systems Lunar, Madison, WI, USA) [22] at the lumbar spine 1–4, and the diagnosis of osteoporosis was based on the World Health Organization (WHO) standards. By osteoporosis is meant BMD measurements at or below the −2.5 standard deviation (SD) from the optimal peak bone density (T-score) of a healthy young adult of the same sex; by contrast, BMD measurement at or above −1 SD from T-score of a healthy young adult of the same sex was considered to reflect bone mass normal [23].
Bioinformatic analysis in gene screening
Screening procedures for genetic variation in Taiwanese
We referred to a previous study conducted by Xie et al. [19], which used microarray data to analyze DEGs and obtained seven osteoporosis-related TFs: E2F4, EGR1, JUN, Sp1, TCF7L2, TP53, and CTNNB1. Subsequently, we used the next-generation sequencing (NGS) data of 1,517 people; the data were available from the Taiwan BioBank database and included 74,861,556 genetic variants. We excluded the structural variants (insertions/deletions) because it was not available to use a multifunctional mass spectrometer (mass array) for genotyping. Then, we excluded the SNPs with a call rate of <90%. Finally, we used the chosen SNPs for further alignment.
Identifying the genetic variants that may influence TF binding
First, we used a human reference genome sequence downloaded from the University of California, Santa Cruz (UCSC; GRCh37/hg19). We analyzed genetic variants that may influence TF binding by using bioinformatic sequence alignment techniques and identified the variants located in the TFBS.
Alignment of the binding site of TF E2F4—5′-TTTSSCGC-3′ (S = C or G)—in all 52,392,270 SNPs derived from the Taiwan BioBank database revealed 12,124 SNPs that may influence the binding affinity: EGR1—5′-GCGGGGGCGG-3′— 689 SNPs; JUN—5′-TGASTCA-3′— 81,754 SNPs; Sp1—5′-GGGCGG-3′— 97,654 SNPs; TCF7L2—5′-CTTTGA-3′— 169,619 SNPs; TP53—5′-RRRCWWGYYY-3′ (R = A or G;W = A or T; Y = C or T)— 169,319 SNPs; and CTNNB1, 5′—TGAYTCA-3′— 84,951 SNPs. We selected SNPs with a minor allele frequency (MAF) <5% as the SNP fragments that influence the TFBSs. The code used for bioinformatics sequence alignment in R is shown in Supplementary File 1.
Confirming the TF binding affinity of the genetic variants through ChIP-Seq
ChIP-Seq data from the JASPAR database were used to confirm whether the genetic variants had a combination of the following sites [24]: E2F4 (Matrix ID: MA0470.1) [25], EGR1 (Matrix ID: MA0162.2) [26], JUN (Matrix ID: MA0488.1) [27], Sp1 (Matrix ID: MA0079.3) [28], TCF7L2 (Matrix ID: MA0523.1) [29], and TP53 (Matrix ID: MA0106.2) [30]. As ChIP-Seq data were not available for CTNNB1, further examination of this TF did not perform in this study. Finally, a total of 14 SNPs were successfully selected: rs55785541, rs2295624, rs79436692, rs1243673, rs6108246, rs6688233, rs130347, rs6509294, rs3758354, rs117405516, rs3813600, rs3803353, rs77796751, and rs28481460 (Figure 1).
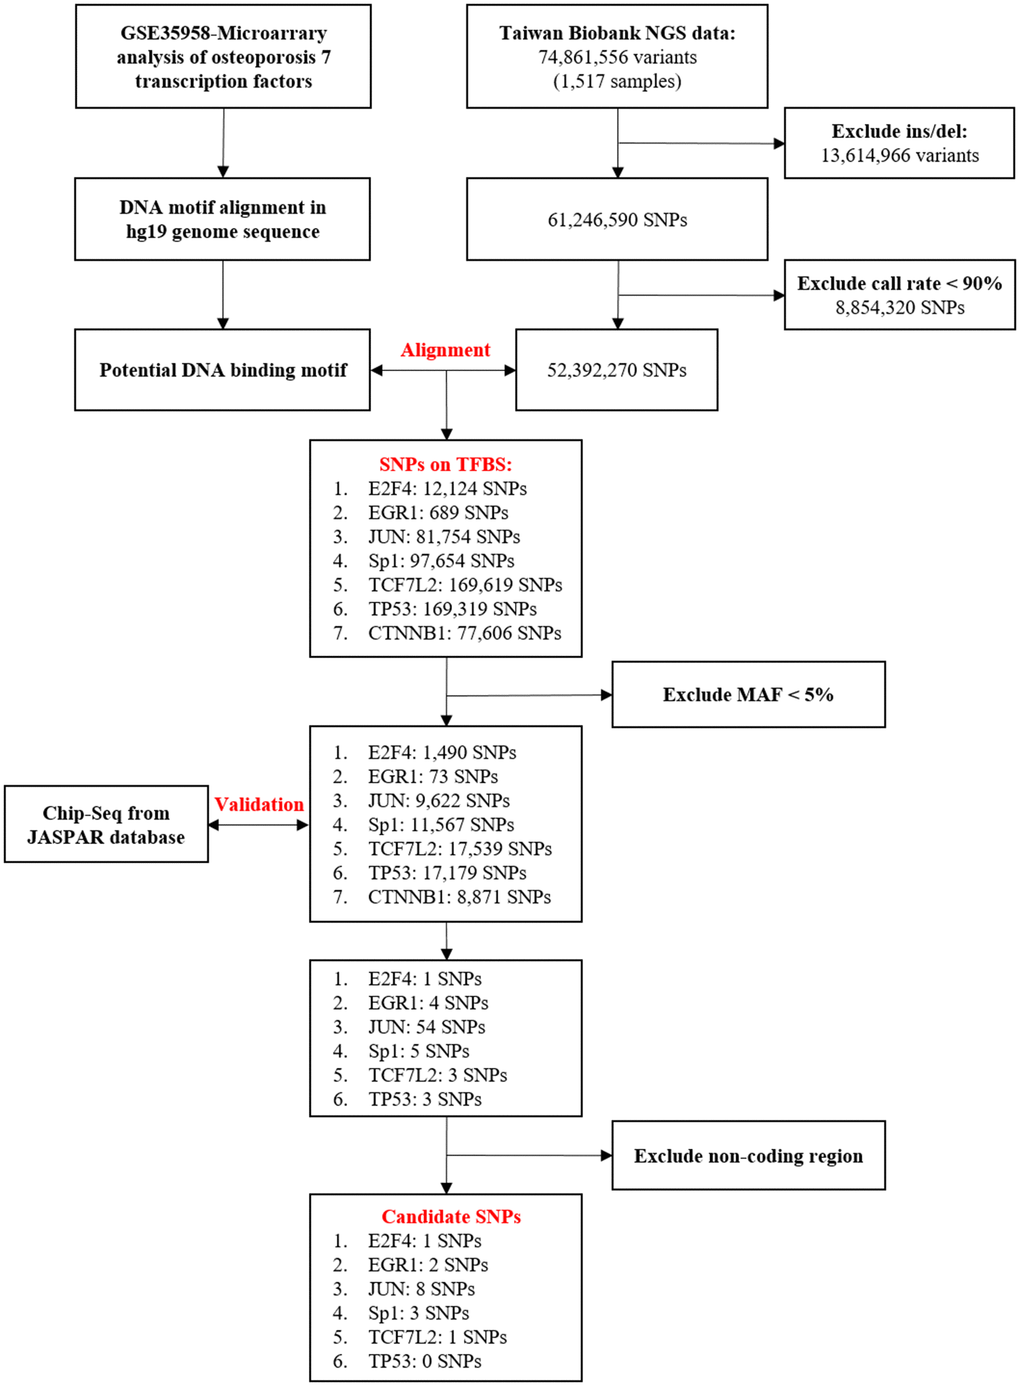
Figure 1. Flowchart of the stepwise approach to screen for candidate transcription factors (TFs) and binding site SNPs. Upstream predictors of seven TFs, E2F4, EGR1, JUN, Sp1, TCF7L2, TP53, and CTNNB1, in osteoporosis [19]. Identification of genetic variants that may influence TFBS through bioinformatic sequence alignment. First, we used the data of a total of 74,861,556 variants (1,517 samples) obtained from the Taiwan BioBank database to screen for Taiwanese population-specific genetic variation. Then, through genetic alignment of GRCh37/hg19 obtained from the National Center for Biotechnology Information database, we found SNPs that may influence the binding affinity. SNPs with an MAF of <5% were excluded from the samples. Chromatin immunoprecipitation sequencing (ChIP-Seq) data obtained from the JASPAR database were used to confirm whether these genetic variants had a combination of the sites. No ChIP-Seq data were available for CTNNB1 validation, and this gene was thus excluded. Finally, we excluded results of the noncoding regions. The variation of 14 SNPs may influence transcription factor binding activity. DEG, differentially expressed gene; NGS, next-generation sequencing; SNP, single-nucleotide polymorphism; Ins/del, insertion/deletion; TFBS, TF binding site; MAF, minor allele frequency.
Genomic DNA extraction and SNP genotyping
Genomic DNA was isolated from the peripheral blood samples using the standard procedures for proteinase K (Invitrogen, Carlsbad, CA, USA) digestion and the phenol/chloroform method [31]. 14 SNPs, mentioned above, in the TFBSs were genotyped by iPLEX Gold SNP genotyping [32], a genotyping example, rs55785541, shown in Supplementary Figure 1. We used inter-replication validation to assess the quality of the genotyping experiment, which was performed with 19 replicate samples (approximately 5%), and the concordance rate was 100%.
Ethics
This study was reviewed and approved by the institutional ethics committee of TSGH (B202105044). After a detailed explanation of the study objectives, written informed consent was obtained from all participants. All clinical and biological samples were collected and DNA was genotyped after obtaining patient consent.
Statistical analysis
Continuous variables were reported as the mean ± SD and were tested using t-tests and ANOVA. Genotype and allelic frequencies were compared between patients with osteoporosis and healthy individuals using chi-squared or Fisher’s exact test. Logistic regression analysis was performed to estimate odds ratios (ORs) and 95% confidence intervals (CIs) [13] with adjustment for age and gender. The analysis was performed using allele type, genotype, dominant, and recessive models. Statistical analyses were performed using SPSS 22.0 (SPSS Inc., Chicago, IL, USA) and R 3.5.1 (R Project for Statistical Computing, Vienna, Austria). A p-value of <0.05 was considered statistically significant.
Results
Candidate TFs and polymorphic TFBSs
According to Xie et al. [19], upstream TFs, E2F4, EGR1, JUN, Sp1, TCF7L2, TP53 and CTNNB1, were identified from DEGs associated with osteoporosis. We then selected NGS data on 1,517 samples from the Taiwan BioBank and excluded 13,614,966 SNPs with structural mutations (insertions/deletions) and 8,854,320 SNPs with a sequencing quality control call rate of <90%. As a result, 52,392,270 SNPs were included in this study.
The UCSC human genomic sequence hg19 and homologous or motif sequences were used for sequence alignment with the SNPs screened from the Taiwan BioBank. The TFs E2F4, EGR1, JUN, Sp1, TCF7L2, TP53, and CTNNB1 had 12,124, 689, 81,754, 97,654, 169,619, 169,319, and 77,606 SNPs, respectively, on the binding sites. After excluding the sites with an MAF of <5%, 1,490, 73, 9,622, 11,567, 17,539, 17,179, and 8,871 binding sites remained, respectively, for E2F4, EGR1, JUN, Sp1, TCF7L2, TP53, and CTNNB1. This was followed by repeated validation using ChIP-Seq data and the exclusion of noncoding regions. Finally, for E2F4, EGR1, JUN, Sp1, TCF7L2, and TP53, 1, 2, 8, 3, 1, and 0 SNPs, respectively, were successfully included in this study. For CTNNB1, as ChIP-Seq data were not available for validation, no SNP was included in this study. In summary, 14 sites in the abovementioned results were included in this study. The detailed candidate results are shown in Table 1.
Table 1. Summary of three candidate SNPs obtained from bioinformatics analyses.
| SNPs | Chromosome:Position | TF | MAF | Gene | DNA sequence near the SNP | ||||||||||||||||||||||||||||||||||||||||||||||||||||||||||||||||||||||||||||||||||||||||||||||
| rs55785541 | 15:100890478 | E2F4 | 0.20 (G/A) | SPATA41 | CTTTCCC[G/A]CGTCAGC | ||||||||||||||||||||||||||||||||||||||||||||||||||||||||||||||||||||||||||||||||||||||||||||||
| rs2295624 | 1:229644157 | EGR1 | 0.17 (G/T) | ABCB10 | GCGGGGGCG[G/T]GATCGTGAC | ||||||||||||||||||||||||||||||||||||||||||||||||||||||||||||||||||||||||||||||||||||||||||||||
| rs79436692 | 15:41576159 | EGR1& SP1 | 0.16 (G/A) | OIP5-AS1 | CAGCGGCGG[G/A]GGCGGGGCT | ||||||||||||||||||||||||||||||||||||||||||||||||||||||||||||||||||||||||||||||||||||||||||||||
| rs12463673 | 2:43412531 | JUN | 0.23 (C/T) | ZFP36L2 | AATGAG[C/T]CAGAGA | ||||||||||||||||||||||||||||||||||||||||||||||||||||||||||||||||||||||||||||||||||||||||||||||
| rs6108246 | 20:9032379 | JUN | 0.14 (T/G) | PLCB4 | GTTTAT[T/G]ACTCAT | ||||||||||||||||||||||||||||||||||||||||||||||||||||||||||||||||||||||||||||||||||||||||||||||
| rs6688233 | 1:9335745 | JUN | 0.21(C/T) | SPSB1 | CTGACT[C/T]ATAGCT | ||||||||||||||||||||||||||||||||||||||||||||||||||||||||||||||||||||||||||||||||||||||||||||||
| rs130347 | 22:43076809 | JUN | 0.27(C/T) | A4GALT | CTGCAC[C/T]GAGTCA | ||||||||||||||||||||||||||||||||||||||||||||||||||||||||||||||||||||||||||||||||||||||||||||||
| rs6509294 | 19:47323384 | JUN | 0.10(G/A) | SNAR-E | TGAGTC[G/A]TGGTGA | ||||||||||||||||||||||||||||||||||||||||||||||||||||||||||||||||||||||||||||||||||||||||||||||
| rs3758354 | 9:75764565 | JUN | 0.17 (A/C) | ANXA1 | CGATGA[A/C]TCATCA | ||||||||||||||||||||||||||||||||||||||||||||||||||||||||||||||||||||||||||||||||||||||||||||||
| rs117405516 | 17:42983641 | JUN | 0.09(G/A) | GFAP | GGATGA[G/A]TCACTT | ||||||||||||||||||||||||||||||||||||||||||||||||||||||||||||||||||||||||||||||||||||||||||||||
| rs3813600 | 1:85786166 | JUN | 0.23(G/A) | LOC646626 | TACGGT[G/A]AGTCAG | ||||||||||||||||||||||||||||||||||||||||||||||||||||||||||||||||||||||||||||||||||||||||||||||
| rs3803353 | 15:40857240 | SP1 | 0.10(G/A) | C15orf57 | GGGAG[G/A]GGCGG | ||||||||||||||||||||||||||||||||||||||||||||||||||||||||||||||||||||||||||||||||||||||||||||||
| rs77796751 | 5:137878943 | SP1 | 0.05(G/A) | ETF1 | GCCAG[G/A]GGCGG | ||||||||||||||||||||||||||||||||||||||||||||||||||||||||||||||||||||||||||||||||||||||||||||||
| rs28481460 | 15:89610555 | TCF7L2 | 0.33(A/C) | ABHD2 | CTTTG[A/C]AGCAT | ||||||||||||||||||||||||||||||||||||||||||||||||||||||||||||||||||||||||||||||||||||||||||||||
| TF, transcription factor; MAF, minor allele frequency (major/minor). | |||||||||||||||||||||||||||||||||||||||||||||||||||||||||||||||||||||||||||||||||||||||||||||||||||
Basic demographic analysis
Basic demographics are shown in Table 2. There were 262 healthy individuals in the control group and 109 patients in the osteoporosis group. The body mass index (BMI) of the osteoporosis group was lower than that of the control group (p < 0.001). The waist circumference of the osteoporosis group was lower than that of the control group (p < 0.001). Higher proportions of participants in the osteoporosis group took calcium tablets (p = 0.002) and suffered from knee osteoarthritis (p = 0.01).
Table 2. Basic demographic variables.
| Variable | Control group (N = 262) | Osteoporosis group (N = 109) | p-value | ||||||||||||||||||||||||||||||||||||||||||||||||||||||||||||||||||||||||||||||||||||||||||||||||
| Age (mean ± SD) | 71.88 ± 6.48 | 72.03 ± 6.62 | 0.538 | ||||||||||||||||||||||||||||||||||||||||||||||||||||||||||||||||||||||||||||||||||||||||||||||||
| BMI (mean ± SD) | 25.03 ± 3.74 | 22.19 ± 3.17 | <0.001* | ||||||||||||||||||||||||||||||||||||||||||||||||||||||||||||||||||||||||||||||||||||||||||||||||
| Waist circumference (mean ± SD) | 81.85 ± 10.73 | 76.27 ± 8.85 | <0.001* | ||||||||||||||||||||||||||||||||||||||||||||||||||||||||||||||||||||||||||||||||||||||||||||||||
| Alcohol consumption, n (%) | 0.461 | ||||||||||||||||||||||||||||||||||||||||||||||||||||||||||||||||||||||||||||||||||||||||||||||||||
| No | 254 (98.8) | 105 (98.1) | |||||||||||||||||||||||||||||||||||||||||||||||||||||||||||||||||||||||||||||||||||||||||||||||||
| Yes | 3 (1.2) | 2 (1.9) | |||||||||||||||||||||||||||||||||||||||||||||||||||||||||||||||||||||||||||||||||||||||||||||||||
| Smoking status, n (%) | 0.793 | ||||||||||||||||||||||||||||||||||||||||||||||||||||||||||||||||||||||||||||||||||||||||||||||||||
| No | 243 (97.6) | 102 (99.0) | |||||||||||||||||||||||||||||||||||||||||||||||||||||||||||||||||||||||||||||||||||||||||||||||||
| Yes | 6 (2.4) | 1 (1.0) | |||||||||||||||||||||||||||||||||||||||||||||||||||||||||||||||||||||||||||||||||||||||||||||||||
| Periodic use of calcium tablets, n (%) | 0.002* | ||||||||||||||||||||||||||||||||||||||||||||||||||||||||||||||||||||||||||||||||||||||||||||||||||
| No | 181 (70.4) | 58 (54.2) | |||||||||||||||||||||||||||||||||||||||||||||||||||||||||||||||||||||||||||||||||||||||||||||||||
| Yes | 76 (29.6) | 49 (45.8) | |||||||||||||||||||||||||||||||||||||||||||||||||||||||||||||||||||||||||||||||||||||||||||||||||
| Medical history, n (%) | |||||||||||||||||||||||||||||||||||||||||||||||||||||||||||||||||||||||||||||||||||||||||||||||||||
| Hypertension | 75 (28.6) | 22 (20.2) | 0.093 | ||||||||||||||||||||||||||||||||||||||||||||||||||||||||||||||||||||||||||||||||||||||||||||||||
| Diabetes | 38 (14.5) | 11 (10.1) | 0.521 | ||||||||||||||||||||||||||||||||||||||||||||||||||||||||||||||||||||||||||||||||||||||||||||||||
| Knee osteoarthritis, n (%) | 68 (26.0) | 14 (12.8) | 0.010* | ||||||||||||||||||||||||||||||||||||||||||||||||||||||||||||||||||||||||||||||||||||||||||||||||
| Healthy individuals (control group): T-score ≥ −1; osteoporosis: T-score ≤ −2.5; | |||||||||||||||||||||||||||||||||||||||||||||||||||||||||||||||||||||||||||||||||||||||||||||||||||
| *:p-value < 0.05; BMI, body mass index. | |||||||||||||||||||||||||||||||||||||||||||||||||||||||||||||||||||||||||||||||||||||||||||||||||||
Association between binding site gene polymorphisms and osteoporosis susceptibility
In total, 14 SNPs were included in this study. All loci conformed to Hardy–Weinberg equilibrium (p > 0.05), with the exception of rs3813600 (p = 0.002). Genotyping results were obtained for 14 SNPs. Our results based on the genotype model showed that rs130347 SNP had a significant association with osteoporosis (p = 0.022; Table 3).
Table 3. Genotype distribution of TFBS SNPs in patients with osteoporosis and healthy individuals.
| SNPs | Controls (N=262), n (%) | Osteoporosis (N=109), n (%) | Crude-OR (95% CI) | p-value | Adj-OR (95% CI)a | p-value | |||||||||||||||||||||||||||||||||||||||||||||||||||||||||||||||||||||||||||||||||||||||||||||
| rs55785541 | 0.569 | 0.328 | |||||||||||||||||||||||||||||||||||||||||||||||||||||||||||||||||||||||||||||||||||||||||||||||||
| GG | 154 (59.5) | 58 (54.2) | 1.00 | 1.00 | |||||||||||||||||||||||||||||||||||||||||||||||||||||||||||||||||||||||||||||||||||||||||||||||
| GA | 95 (36.7) | 43 (40.2) | 1.20 (0.75–1.92) | 0.443 | 1.29 (0.76–2.19) | 0.339 | |||||||||||||||||||||||||||||||||||||||||||||||||||||||||||||||||||||||||||||||||||||||||||||
| AA | 10 (3.9) | 6 (5.6) | 1.59 (0.55–4.58) | 0.388 | 2.32 (0.66–8.21) | 0.191 | |||||||||||||||||||||||||||||||||||||||||||||||||||||||||||||||||||||||||||||||||||||||||||||
| rs117405516 | 0.554 | 0.812 | |||||||||||||||||||||||||||||||||||||||||||||||||||||||||||||||||||||||||||||||||||||||||||||||||
| GG | 220 (84.6) | 94 (86.2) | 1.00 | 1.00 | |||||||||||||||||||||||||||||||||||||||||||||||||||||||||||||||||||||||||||||||||||||||||||||||
| GA | 38 (14.6) | 13 (11.9) | 0.80 (0.41–1.57) | 0.518 | 0.91 (0.43–1.89) | 0.791 | |||||||||||||||||||||||||||||||||||||||||||||||||||||||||||||||||||||||||||||||||||||||||||||
| AA | 2 (0.8) | 2 (1.8) | 2.34 (0.32–16.86) | 0.399 | 1.97 (0.20–19.88) | 0.564 | |||||||||||||||||||||||||||||||||||||||||||||||||||||||||||||||||||||||||||||||||||||||||||||
| rs28481460 | 0.075 | 0.077 | |||||||||||||||||||||||||||||||||||||||||||||||||||||||||||||||||||||||||||||||||||||||||||||||||
| AA | 180 (70.0) | 32 (31.7) | 1.00 | 1.00 | |||||||||||||||||||||||||||||||||||||||||||||||||||||||||||||||||||||||||||||||||||||||||||||||
| AC | 69 (26.8) | 57 (56.4) | 1.80 (1.08–2.98) | 0.023* | 1.93 (1.09–3.42) | 0.024* | |||||||||||||||||||||||||||||||||||||||||||||||||||||||||||||||||||||||||||||||||||||||||||||
| CC | 8 (3.1) | 12 (11.9) | 1.54 (0.70–3.38) | 0.280 | 1.64 (0.68–3.92) | 0.268 | |||||||||||||||||||||||||||||||||||||||||||||||||||||||||||||||||||||||||||||||||||||||||||||
| rs12463673 | 0.493 | 0.541 | |||||||||||||||||||||||||||||||||||||||||||||||||||||||||||||||||||||||||||||||||||||||||||||||||
| CC | 131 (51.4) | 61 (58.1) | 1.00 | 1.00 | |||||||||||||||||||||||||||||||||||||||||||||||||||||||||||||||||||||||||||||||||||||||||||||||
| CT | 105 (41.2) | 38 (36.2) | 0.78 (0.48–1.26) | 0.303 | 0.74 (0.43–1.27) | 0.27 | |||||||||||||||||||||||||||||||||||||||||||||||||||||||||||||||||||||||||||||||||||||||||||||
| TT | 19(7.5) | 6 (5.7) | 0.68 (0.26–1.78) | 0.431 | 0.93 (0.32–2.73) | 0.901 | |||||||||||||||||||||||||||||||||||||||||||||||||||||||||||||||||||||||||||||||||||||||||||||
| rs130347 | 0.047* | 0.022* | |||||||||||||||||||||||||||||||||||||||||||||||||||||||||||||||||||||||||||||||||||||||||||||||||
| CC | 108 (41.9) | 53 (49.5) | 1.00 | 1.00 | |||||||||||||||||||||||||||||||||||||||||||||||||||||||||||||||||||||||||||||||||||||||||||||||
| CT | 126 (48.8) | 38 (35.5) | 0.61 (0.38–1.00) | 0.051 | 0.48 (0.27–0.83) | 0.009* | |||||||||||||||||||||||||||||||||||||||||||||||||||||||||||||||||||||||||||||||||||||||||||||
| TT | 24 (9.3) | 16 (15.0) | 1.36 (0.67–2.77) | 0.400 | 1.05 (0.46–2.38) | 0.905 | |||||||||||||||||||||||||||||||||||||||||||||||||||||||||||||||||||||||||||||||||||||||||||||
| rs6108246 | 0.991 | 0.964 | |||||||||||||||||||||||||||||||||||||||||||||||||||||||||||||||||||||||||||||||||||||||||||||||||
| GG | 180 (71.7) | 74 (71.8) | 1.00 | 1.00 | |||||||||||||||||||||||||||||||||||||||||||||||||||||||||||||||||||||||||||||||||||||||||||||||
| GT | 63 (25.1) | 26 (25.2) | 1.00 (0.59–1.71) | 0.989 | 0.93(0.51–1.67) | 0.803 | |||||||||||||||||||||||||||||||||||||||||||||||||||||||||||||||||||||||||||||||||||||||||||||
| TT | 8 (3.2) | 3(2.9) | 0.91 (0.24–3.53) | 0.894 | 1.06 (0.23–4.85) | 0.939 | |||||||||||||||||||||||||||||||||||||||||||||||||||||||||||||||||||||||||||||||||||||||||||||
| rs6688233 | 0.420 | 0.397 | |||||||||||||||||||||||||||||||||||||||||||||||||||||||||||||||||||||||||||||||||||||||||||||||||
| CC | 155 (59.6) | 66(61.7) | 1.00 | 1.00 | |||||||||||||||||||||||||||||||||||||||||||||||||||||||||||||||||||||||||||||||||||||||||||||||
| CT | 97 (37.3) | 35(32.7) | 0.85 (0.52–1.37) | 0.501 | 0.83 (0.48–1.44) | 0.512 | |||||||||||||||||||||||||||||||||||||||||||||||||||||||||||||||||||||||||||||||||||||||||||||
| TT | 8 (3.1) | 6 (5.6) | 1.76 (0.59–5.28) | 0.312 | 1.92 (0.58–6.32) | 0.285 | |||||||||||||||||||||||||||||||||||||||||||||||||||||||||||||||||||||||||||||||||||||||||||||
| rs6509294 | 0.656 | 0.479 | |||||||||||||||||||||||||||||||||||||||||||||||||||||||||||||||||||||||||||||||||||||||||||||||||
| GG | 205 (80.7) | 81 (76.4) | 1.00 | 1.00 | |||||||||||||||||||||||||||||||||||||||||||||||||||||||||||||||||||||||||||||||||||||||||||||||
| GA | 47 (18.5) | 24 (22.6) | 1.29 (0.74–2.25) | 0.365 | 1.37 (0.73–2.58) | 0.326 | |||||||||||||||||||||||||||||||||||||||||||||||||||||||||||||||||||||||||||||||||||||||||||||
| AA | 2 (0.8) | 1 (0.9) | 1.27 (0.11–14.15) | 0.848 | 2.75 (0.21–36.63) | 0.443 | |||||||||||||||||||||||||||||||||||||||||||||||||||||||||||||||||||||||||||||||||||||||||||||
| rs3758354 | 0.338 | 0.495 | |||||||||||||||||||||||||||||||||||||||||||||||||||||||||||||||||||||||||||||||||||||||||||||||||
| AA | 176 (68.0) | 80 (74.8) | 1.00 | 1.00 | |||||||||||||||||||||||||||||||||||||||||||||||||||||||||||||||||||||||||||||||||||||||||||||||
| AC | 76 (29.3) | 26 (24.3) | 0.75 (0.45–1.26) | 0.282 | 0.80 (0.45–1.44) | 0.464 | |||||||||||||||||||||||||||||||||||||||||||||||||||||||||||||||||||||||||||||||||||||||||||||
| CC | 7 (2.7) | 1 (0.9) | 0.31 (0.04–2.60) | 0.283 | 0.34 (0.04–2.92) | 0.324 | |||||||||||||||||||||||||||||||||||||||||||||||||||||||||||||||||||||||||||||||||||||||||||||
| rs3813600 | 0.656 | 0.623 | |||||||||||||||||||||||||||||||||||||||||||||||||||||||||||||||||||||||||||||||||||||||||||||||||
| GG | 147 (56.8) | 63 (58.3) | 1.00 | 1.00 | |||||||||||||||||||||||||||||||||||||||||||||||||||||||||||||||||||||||||||||||||||||||||||||||
| GA | 96 (37.1) | 36 (33.3) | 0.88 (0.54–1.42) | 0.588 | 0.77 (0.45–1.32) | 0.333 | |||||||||||||||||||||||||||||||||||||||||||||||||||||||||||||||||||||||||||||||||||||||||||||
| AA | 16 (6.2) | 9 (8.3) | 1.31 (0.55–3.13) | 0.539 | 0.95 (0.36–2.48) | 0.920 | |||||||||||||||||||||||||||||||||||||||||||||||||||||||||||||||||||||||||||||||||||||||||||||
| rs22956524 | 0.631 | 0.582 | |||||||||||||||||||||||||||||||||||||||||||||||||||||||||||||||||||||||||||||||||||||||||||||||||
| GG | 180 (70.0) | 79 (74.5) | 1.00 | 1.00 | |||||||||||||||||||||||||||||||||||||||||||||||||||||||||||||||||||||||||||||||||||||||||||||||
| GT | 69 (26.8) | 25 (23.6) | 0.83 (0.49–1.40) | 0.477 | 0.75 (0.42–1.36) | 0.343 | |||||||||||||||||||||||||||||||||||||||||||||||||||||||||||||||||||||||||||||||||||||||||||||
| TT | 8 (3.1) | 2 (1.9) | 0.57 (0.12–2.74) | 0.483 | 0.65 (0.12–3.51) | 0.615 | |||||||||||||||||||||||||||||||||||||||||||||||||||||||||||||||||||||||||||||||||||||||||||||
| *:p-value < 0.05; a, after the adjustment for age and body mass index; OR, odds ratio; CI, confidence interval. | |||||||||||||||||||||||||||||||||||||||||||||||||||||||||||||||||||||||||||||||||||||||||||||||||||
In Table 4, we present the logistic regression analysis data comparing the genotype and allele frequencies of patients with osteoporosis and healthy individuals. For rs130347, a significant difference was found in the dominant model (CC vs. CT + TT) in all participants after adjustment for age and BMI (OR = 0.57, 95% CI = 0.34–0.95; p = 0.031). For rs28481460, a significant difference was found in the dominant model (AA + AC vs. CC) in all participants after adjustment for age and BMI (OR = 1.87, 95% CI = 1.08–3.24; p = 0.026).
Table 4. Association of rs130347 and rs28481460 with osteoporosis.
| Independent variable | Crude-OR (95% CI) | p-value | Adj-OR (95% CI)a | p-value | |||||||||||||||||||||||||||||||||||||||||||||||||||||||||||||||||||||||||||||||||||||||||||||||
| rs130347 | |||||||||||||||||||||||||||||||||||||||||||||||||||||||||||||||||||||||||||||||||||||||||||||||||||
| Allele model | 0.792 | 0.305 | |||||||||||||||||||||||||||||||||||||||||||||||||||||||||||||||||||||||||||||||||||||||||||||||||
| C | 1.00 | 1.00 | |||||||||||||||||||||||||||||||||||||||||||||||||||||||||||||||||||||||||||||||||||||||||||||||||
| T | 0.96 (0.68–1.34) | 0.82 (0.55–1.20) | |||||||||||||||||||||||||||||||||||||||||||||||||||||||||||||||||||||||||||||||||||||||||||||||||
| Dominant model | 0.180 | 0.031* | |||||||||||||||||||||||||||||||||||||||||||||||||||||||||||||||||||||||||||||||||||||||||||||||||
| CC | 1.00 | 1.00 | |||||||||||||||||||||||||||||||||||||||||||||||||||||||||||||||||||||||||||||||||||||||||||||||||
| CT + TT | 0.73 (0.47–1.15) | 0.57 (0.34–0.95) | |||||||||||||||||||||||||||||||||||||||||||||||||||||||||||||||||||||||||||||||||||||||||||||||||
| Recessive model | 0.119 | 0.325 | |||||||||||||||||||||||||||||||||||||||||||||||||||||||||||||||||||||||||||||||||||||||||||||||||
| CC + CT | 1.00 | 1.00 | |||||||||||||||||||||||||||||||||||||||||||||||||||||||||||||||||||||||||||||||||||||||||||||||||
| TT | 1.71 (0.87–3.37) | 1.48 (0.68–3.22) | |||||||||||||||||||||||||||||||||||||||||||||||||||||||||||||||||||||||||||||||||||||||||||||||||
| rs28481460 | |||||||||||||||||||||||||||||||||||||||||||||||||||||||||||||||||||||||||||||||||||||||||||||||||||
| Allele model | 0.078 | 0.03* | |||||||||||||||||||||||||||||||||||||||||||||||||||||||||||||||||||||||||||||||||||||||||||||||||
| A | 1.00 | 1.00 | |||||||||||||||||||||||||||||||||||||||||||||||||||||||||||||||||||||||||||||||||||||||||||||||||
| C | 1.36 (0.97–1.90) | 1.52 (1.04–2.23) | |||||||||||||||||||||||||||||||||||||||||||||||||||||||||||||||||||||||||||||||||||||||||||||||||
| Dominant model | 0.025* | 0.026* | |||||||||||||||||||||||||||||||||||||||||||||||||||||||||||||||||||||||||||||||||||||||||||||||||
| AA | 1.00 | 1.00 | |||||||||||||||||||||||||||||||||||||||||||||||||||||||||||||||||||||||||||||||||||||||||||||||||
| AC + CC | 1.75 (1.07–2.85) | 1.87 (1.08–3.24) | |||||||||||||||||||||||||||||||||||||||||||||||||||||||||||||||||||||||||||||||||||||||||||||||||
| Recessive model | 0.789 | 0.77 | |||||||||||||||||||||||||||||||||||||||||||||||||||||||||||||||||||||||||||||||||||||||||||||||||
| AA + AC | 1.00 | 1.00 | |||||||||||||||||||||||||||||||||||||||||||||||||||||||||||||||||||||||||||||||||||||||||||||||||
| CC | 1.10 (0.54–2.27) | 1.13 (0.51–2.51) | |||||||||||||||||||||||||||||||||||||||||||||||||||||||||||||||||||||||||||||||||||||||||||||||||
| *: p-value < 0.05; a, After the adjustment for age and body mass index; OR, odds ratio; CI, confidence interval. | |||||||||||||||||||||||||||||||||||||||||||||||||||||||||||||||||||||||||||||||||||||||||||||||||||
mRNA expression of SNP polymorphisms with downstream genes
This case–control study showed that rs28481460 and rs130347 are associated with the risk of osteoporosis. In this study, the GTEx database was used for expression quantitative trait loci analysis of the mRNA expression of SNP loci and downstream genes. The GTEx query steps used for gene expression analysis are shown in Supplementary File 2. We observed that the presence of the rs130347 C minor allele in whole blood decreases downstream A4GALT expression (p = 0.0041). In skeletal muscle tissue samples, the presence of the rs130347 C minor allele influences downstream A4GALT expression (p = 0.011; Figure 2). Furthermore, we noted that the presence of the rs28481460 C minor allele in whole blood does not influence downstream ABHD2 expression. In the skeletal muscle tissue samples, the presence of the rs130347 C minor allele does not influence downstream ABHD2 expression (p = 0.68; Figure 3).
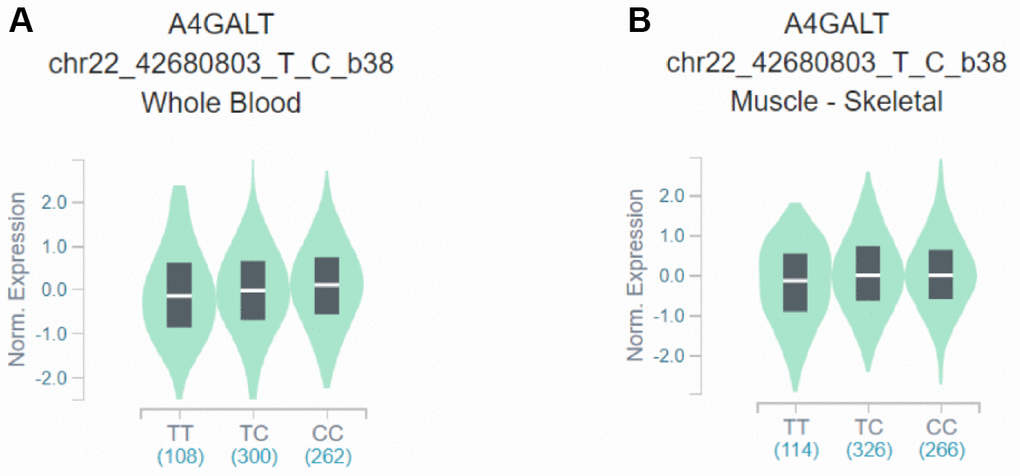
Figure 2. Effects of rs130347 polymorphism on A4GALT expression. (A) The presence of the rs130347 C minor allele in whole blood decreases downstream A4GALT expression (p = 0.0041) (B) In skeletal muscle tissue samples, the presence of the rs130347 C minor allele influences downstream A4GALT expression (p = 0.011).
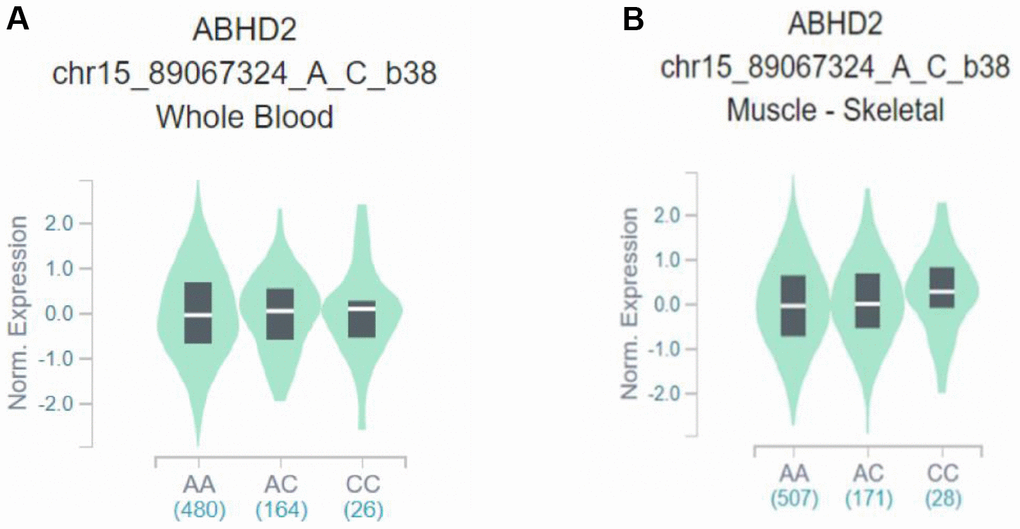
Figure 3. Effects of rs28481460 polymorphism on ABHD2 expression. (A) The presence of the rs28481460 C minor allele in whole blood does not influence downstream A4GALT expression (p = 0.90). (B) The presence of the rs130347 C minor allele in skeletal muscle tissue samples does not influence downstream ABHD2 expression (p = 0.68).
Discussion
In this study, we investigated the association of the binding sites of seven TFs (E2F4, EGR1, JUN, Sp1, TCF7L2, TP53, and CTNNB1) with osteoporosis. Our study results revealed that a binding site SNP of the TF, JUN, rs130347, was significantly associated with osteoporosis. In addition, we explored the mRNA expression of rs130347 in the GTEx database and noted that both the whole blood and the skeletal muscle samples showed that the presence of the C allele in rs130347 decreases A4GALT expression.
Osteoporosis is known to be caused by an imbalance between osteoblasts and osteoclasts [33]. Currently, it is known that the biological pathway that influences osteoblasts is the RANK-OPG-RANKL pathway [34]. The binding of RANK and RANKL stimulates NF-κB activation and increases MAPK, JNK, ERK, and p38 activities, and these signaling pathways influence osteoclast formation [35]. JUN and FOS are members of the activator protein 1 (AP-1) family. JNK protease influences osteoblast differentiation by enhancing its binding with Ap-1 family proteins [36]. To validate the effects of JUN on bone growth, a previous study transplanted long bones that induce JUN synthesis into mice with an impaired immune system [37]. The results revealed a significant increase in the bones of the transplanted mice. This showed that JUN is vital to the development of the skeletal system.
rs130347 is located upstream of A4GALT, has a length of 29 kb, and is located at 22q13.2. Its primary function is to catalyze the conversion of galactose to lactosylceramide to synthesize globotriaosylceramide (Gb3) [38]. A study demonstrated that Gb3 can bind to verotoxin produced by Escherichia coli to induce apoptosis [39]. Gb3 was also shown to be able to prevent human immunodeficiency virus infection [40]. Moreover, other studies showed that a genetic defect in α-galactosidase in patients with Fabry disease leads to the aberrant accumulation of Gb3 in endothelial cells, causing kidney, heart, and cerebrovascular lesions, and decreases BMD. This results in an increased risk of osteoporosis in patients with Fabry disease [41, 42]. However, the association between A4GALT and osteoporosis remains unknown and the biological mechanisms involved are yet to be elucidated. We found that rs130347 is a polymorphic locus located in the binding site of the TF, JUN, and causes a decrease in A4GALT expression.
In this study, we employed a candidate screening method different from previous studies and used the NGS data in the Taiwan BioBank to screen for TFBS polymorphisms that had the highest association with osteoporosis. SNP loci that were not previously investigated for their association with osteoporosis were identified in the case–control study. Compared with the results of GWAS, most SNPs found were not causally related and no association could be found with the disease [43, 44]. The bioinformatic analysis used in this study successfully identified one SNP that is correlated with osteoporosis. In future, multiple omics technologies, including genomics, transcriptomics, epigenomics, proteomics, and metabolomics, can be combined to identify the molecular factors contributing to disease pathogenesis and thus address genetic susceptibility to disease development.
Certain potential limitations of this study might have influenced the results. The differential gene data for candidate TFs were obtained from the mesenchymal stem cells of the Caucasian population, which may differ from the RNA sequencing results of the Asian population; this may have influenced the candidate TF results. Furthermore, this study used ChIP-Seq data from the JASPAR database for repeated validation of tissue-derived nonosteocytes, which may have influenced the results. Sample size limitations resulted in an inability to examine the effects of genes with an MAF of <5% and structural mutations (insertions/deletions) on osteoporosis. Therefore, we recommend increasing the sample size in the future to examine SNPs that were not covered in this study in order to obtain more osteoporosis-related SNP results.
Conclusions
In summary, our data demonstrated that rs130347 plays an important role in postmenopausal women with susceptibility to osteoporosis, modulating the epigenetic regulation of a critical osteoporosis-related gene, A4GALT. rs130347 impairs the binding of JUN, which may lead to decreased A4GALT expression. However, the effect of the JUN binding site SNP rs130347 and A4GALT on the development and function of osteoporosis remains incompletely understood, and further exploration of the regulatory mechanism, such as by RNA-Seq of the genomes of Taiwanese patients, is warranted.
Author Contributions
Data curation, Meng-Chang Lee, Pi-Shao Ko, and Sui-Lung Su; Funding acquisition, Chih-Chien Wang and Sui-Lung Su; Investigation, Jen-Jie Weng; Methodology, Jen-Jie Weng, Meng-Chang Lee, Pi-Shao Ko, and Sui-Lung Su; Project administration, Sui-Lung Su; Resources, Chih-Chien Wang; Writing – original draft, Chih-Chien Wang; Writing – review and editing, Hsiang-Cheng Chen and Sui-Lung Su.
Conflicts of Interest
The authors declare that they have no conflicts of interest.
Funding
This study was supported by the Ministry of Science and Technology (MOST107-2314-B016-052-MY3, MOST110-2314-B016-006), and National Defense Medical Center (MND-MAB-110-105, MND-MAB-D-111132), Tri-Service General Hospital (TSGH-E-110232, TSGH-D-111099).
References
- 1. Kanis JA, Melton LJ 3rd, Christiansen C, Johnston CC, Khaltaev N. The diagnosis of osteoporosis. J Bone Miner Res. 1994; 9:1137–41. https://doi.org/10.1002/jbmr.5650090802 [PubMed]
- 2. Sözen T, Özışık L, Başaran NÇ. An overview and management of osteoporosis. Eur J Rheumatol. 2017; 4:46–56. https://doi.org/10.5152/eurjrheum.2016.048 [PubMed]
- 3. Chen FP, Huang TS, Fu TS, Sun CC, Chao AS, Tsai TL. Secular trends in incidence of osteoporosis in Taiwan: A nationwide population-based study. Biomed J. 2018; 41:314–20. https://doi.org/10.1016/j.bj.2018.08.001 [PubMed]
- 4. Johnell O, Kanis J. Epidemiology of osteoporotic fractures. Osteoporos Int. 2005 (Suppl 2); 16:S3–7. https://doi.org/10.1007/s00198-004-1702-6 [PubMed]
- 5. Sommer I, Erkkilä AT, Järvinen R, Mursu J, Sirola J, Jurvelin JS, Kröger H, Tuppurainen M. Alcohol consumption and bone mineral density in elderly women. Public Health Nutr. 2013; 16:704–12. https://doi.org/10.1017/S136898001200331X [PubMed]
- 6. Callaway DA, Jiang JX. Reactive oxygen species and oxidative stress in osteoclastogenesis, skeletal aging and bone diseases. J Bone Miner Metab. 2015; 33:359–70. https://doi.org/10.1007/s00774-015-0656-4 [PubMed]
- 7. Hendrickx G, Boudin E, Van Hul W. A look behind the scenes: the risk and pathogenesis of primary osteoporosis. Nat Rev Rheumatol. 2015; 11:462–74. https://doi.org/10.1038/nrrheum.2015.48 [PubMed]
- 8. Kanis JA, Glüer CC. An update on the diagnosis and assessment of osteoporosis with densitometry. Committee of Scientific Advisors, International Osteoporosis Foundation. Osteoporos Int. 2000; 11:192–202. https://doi.org/10.1007/s001980050281 [PubMed]
- 9. Recker RR, Deng HW. Role of genetics in osteoporosis. Endocrine. 2002; 17:55–66. https://doi.org/10.1385/ENDO:17:1:55 [PubMed]
- 10. Ralston SH, Uitterlinden AG. Genetics of osteoporosis. Endocr Rev. 2010; 31:629–62. https://doi.org/10.1210/er.2009-0044 [PubMed]
- 11. Xu XH, Dong SS, Guo Y, Yang TL, Lei SF, Papasian CJ, Zhao M, Deng HW. Molecular genetic studies of gene identification for osteoporosis: the 2009 update. Endocr Rev. 2010; 31:447–505. https://doi.org/10.1210/er.2009-0032 [PubMed]
- 12. Sabik OL, Farber CR. Using GWAS to identify novel therapeutic targets for osteoporosis. Transl Res. 2017; 181:15–26. https://doi.org/10.1016/j.trsl.2016.10.009 [PubMed]
- 13. Manolio TA, Collins FS, Cox NJ, Goldstein DB, Hindorff LA, Hunter DJ, McCarthy MI, Ramos EM, Cardon LR, Chakravarti A, Cho JH, Guttmacher AE, Kong A, et al. Finding the missing heritability of complex diseases. Nature. 2009; 461:747–53. https://doi.org/10.1038/nature08494 [PubMed]
- 14. Yuan J, Tickner J, Mullin BH, Zhao J, Zeng Z, Morahan G, Xu J. Advanced Genetic Approaches in Discovery and Characterization of Genes Involved With Osteoporosis in Mouse and Human. Front Genet. 2019; 10:288. https://doi.org/10.3389/fgene.2019.00288 [PubMed]
- 15. Verstockt B, Smith KG, Lee JC. Genome-wide association studies in Crohn’s disease: Past, present and future. Clin Transl Immunology. 2018; 7:e1001. https://doi.org/10.1002/cti2.1001 [PubMed]
- 16. Hindorff LA, Sethupathy P, Junkins HA, Ramos EM, Mehta JP, Collins FS, Manolio TA. Potential etiologic and functional implications of genome-wide association loci for human diseases and traits. Proc Natl Acad Sci USA. 2009; 106:9362–7. https://doi.org/10.1073/pnas.0903103106 [PubMed]
- 17. Gu H, Huang Z, Chen G, Zhou K, Zhang Y, Chen J, Xu J, Yin X. Network and pathway-based analyses of genes associated with osteoporosis. Medicine (Baltimore). 2020; 99:e19120. https://doi.org/10.1097/MD.0000000000019120 [PubMed]
- 18. Ye W, Wang Y, Mei B, Hou S, Liu X, Wu G, Qin L, Zhao K, Huang Q. Computational and functional characterization of four SNPs in the SOST locus associated with osteoporosis. Bone. 2018; 108:132–44. https://doi.org/10.1016/j.bone.2018.01.001 [PubMed]
- 19. Xie W, Ji L, Zhao T, Gao P. Identification of transcriptional factors and key genes in primary osteoporosis by DNA microarray. Med Sci Monit. 2015; 21:1333–44. https://doi.org/10.12659/MSM.894111 [PubMed]
- 20. Fonseca C, Lindahl GE, Ponticos M, Sestini P, Renzoni EA, Holmes AM, Spagnolo P, Pantelidis P, Leoni P, McHugh N, Stock CJ, Shi-Wen X, Denton CP, et al. A polymorphism in the CTGF promoter region associated with systemic sclerosis. N Engl J Med. 2007; 357:1210–20. https://doi.org/10.1056/NEJMoa067655 [PubMed]
- 21. Nakamura T. [WHO diagnostic criteria for osteoporosis and trends in Europe and USA]. Nihon Rinsho. 2004; 62 (Suppl 2):235–9. [PubMed]
- 22. Chen YY, Fang WH, Wang CC, Kao TW, Chang YW, Yang HF, Wu CJ, Sun YS, Chen WL. Crosssectional Assessment of Bone Mass Density in Adults with Hepatitis B Virus and Hepatitis C Virus Infection. Sci Rep. 2019; 9:5069. https://doi.org/10.1038/s41598-019-41674-4 [PubMed]
- 23. Mithal A, Bansal B, Kyer CS, Ebeling P. The Asia-Pacific Regional Audit-Epidemiology, Costs, and Burden of Osteoporosis in India 2013: A report of International Osteoporosis Foundation. Indian J Endocrinol Metab. 2014; 18:449–54. https://doi.org/10.4103/2230-8210.137485 [PubMed]
- 24. Fornes O, Castro-Mondragon JA, Khan A, van der Lee R, Zhang X, Richmond PA, Modi BP, Correard S, Gheorghe M, Baranašić D, Santana-Garcia W, Tan G, Chèneby J, et al. JASPAR 2020: update of the open-access database of transcription factor binding profiles. Nucleic Acids Res. 2020; 48:D87–92. https://doi.org/10.1093/nar/gkz1001 [PubMed]
- 25. Xu X, Bieda M, Jin VX, Rabinovich A, Oberley MJ, Green R, Farnham PJ. A comprehensive ChIP-chip analysis of E2F1, E2F4, and E2F6 in normal and tumor cells reveals interchangeable roles of E2F family members. Genome Res. 2007; 17:1550–61. https://doi.org/10.1101/gr.6783507 [PubMed]
- 26. Meng X, Brodsky MH, Wolfe SA. A bacterial one-hybrid system for determining the DNA-binding specificity of transcription factors. Nat Biotechnol. 2005; 23:988–94. https://doi.org/10.1038/nbt1120 [PubMed]
- 27. Li M, Ge Q, Wang W, Wang J, Lu Z. c-Jun binding site identification in K562 cells. J Genet Genomics. 2011; 38:235–42. https://doi.org/10.1016/j.jgg.2011.05.004 [PubMed]
- 28. Portales-Casamar E, Kirov S, Lim J, Lithwick S, Swanson MI, Ticoll A, Snoddy J, Wasserman WW. PAZAR: a framework for collection and dissemination of cis-regulatory sequence annotation. Genome Biol. 2007; 8:R207. https://doi.org/10.1186/gb-2007-8-10-r207 [PubMed]
- 29. Hatzis P, van der Flier LG, van Driel MA, Guryev V, Nielsen F, Denissov S, Nijman IJ, Koster J, Santo EE, Welboren W, Versteeg R, Cuppen E, van de Wetering M, et al. Genome-wide pattern of TCF7L2/TCF4 chromatin occupancy in colorectal cancer cells. Mol Cell Biol. 2008; 28:2732–44. https://doi.org/10.1128/MCB.02175-07 [PubMed]
- 30. Funk WD, Pak DT, Karas RH, Wright WE, Shay JW. A transcriptionally active DNA-binding site for human p53 protein complexes. Mol Cell Biol. 1992; 12:2866–71. https://doi.org/10.1128/mcb.12.6.2866-2871.1992 [PubMed]
- 31. Tan SC, Yiap BC. DNA, RNA, and protein extraction: the past and the present. J Biomed Biotechnol. 2009; 2009:574398. https://doi.org/10.1155/2009/574398 [PubMed]
- 32. Perkel J. SNP genotyping: six technologies that keyed a revolution. Nature Methods. 2008; 5:447–53. https://doi.org/10.1038/nmeth0508-447
- 33. Salhotra A, Shah HN, Levi B, Longaker MT. Mechanisms of bone development and repair. Nat Rev Mol Cell Biol. 2020; 21:696–711. https://doi.org/10.1038/s41580-020-00279-w [PubMed]
- 34. Walsh MC, Choi Y. Biology of the RANKL-RANK-OPG System in Immunity, Bone, and Beyond. Front Immunol. 2014; 5:511. https://doi.org/10.3389/fimmu.2014.00511 [PubMed]
- 35. Boyle WJ, Simonet WS, Lacey DL. Osteoclast differentiation and activation. Nature. 2003; 423:337–42. https://doi.org/10.1038/nature01658 [PubMed]
- 36. David JP, Sabapathy K, Hoffmann O, Idarraga MH, Wagner EF. JNK1 modulates osteoclastogenesis through both c-Jun phosphorylation-dependent and -independent mechanisms. J Cell Sci. 2002; 115:4317–25. https://doi.org/10.1242/jcs.00082 [PubMed]
- 37. Lerbs T, Cui L, Muscat C, Saleem A, van Neste C, Domizi P, Chan C, Wernig G. Expansion of Bone Precursors through Jun as a Novel Treatment for Osteoporosis-Associated Fractures. Stem Cell Reports. 2020; 14:603–13. https://doi.org/10.1016/j.stemcr.2020.02.009 [PubMed]
- 38. Furukawa K, Kondo Y, Furukawa K. UDP-Gal: Lactosylceramide Alpha 1,4-Galactosyltransferase (A4GALT), in Handbook of Glycosyltransferases and Related Genes, N. Taniguchi Editors. 2014, Springer Japan: Tokyo. 141–7. https://doi.org/10.1007/978-4-431-54240-7_33
- 39. Furukawa K, Yokoyama K, Sato T, Wiels J, Hirayama Y, Ohta M, Furukawa K. Expression of the Gb3/CD77 synthase gene in megakaryoblastic leukemia cells: implication in the sensitivity to verotoxins. J Biol Chem. 2002; 277:11247–54. https://doi.org/10.1074/jbc.M109519200 [PubMed]
- 40. Harrison AL, Olsson ML, Jones RB, Ramkumar S, Sakac D, Binnington B, Henry S, Lingwood CA, Branch DR. A synthetic globotriaosylceramide analogue inhibits HIV-1 infection in vitro by two mechanisms. Glycoconj J. 2010; 27:515–24. https://doi.org/10.1007/s10719-010-9297-y [PubMed]
- 41. Mersebach H, Johansson JO, Rasmussen AK, Bengtsson BA, Rosenberg K, Hasholt L, Sørensen SA, Sørensen SS, Feldt-Rasmussen U. Osteopenia: a common aspect of Fabry disease. Predictors of bone mineral density. Genet Med. 2007; 9:812–8. https://doi.org/10.1097/gim.0b013e31815cb197 [PubMed]
- 42. Sacre K, Lidove O, Giroux Leprieur B, Ouali N, Laganier J, Caillaud C, Papo T. Bone and joint involvement in Fabry disease. Scand J Rheumatol. 2010; 39:171–4. https://doi.org/10.3109/03009740903270631 [PubMed]
- 43. Fugger L, McVean G, Bell JI. Genomewide association studies and common disease--realizing clinical utility. N Engl J Med. 2012; 367:2370–1. https://doi.org/10.1056/NEJMp1212285 [PubMed]
- 44. Schaid DJ, Chen W, Larson NB. From genome-wide associations to candidate causal variants by statistical fine-mapping. Nat Rev Genet. 2018; 19:491–504. https://doi.org/10.1038/s41576-018-0016-z [PubMed]