


Introduction
Prostate cancer (PRCA) is the most common cancer in men and is the secondary cause of cancer-related deaths in western countries according to the 2018 GLOBOCAN project [1]. Treatment options for localized PRCA include radical prostatectomy, radiation therapy, and androgen deprivation therapy (ADT). However, most patients undergoing ADT eventually progress to metastatic castration-resistant prostate cancer (mCRPC) [2]. In recent years, immunotherapy that stimulates the patient immune system to target cancer has emerged as a next-generation cancer treatment. Although immunotherapy has provided substantial benefits for many types of cancer, only a limited benefit was observed with mCRPC, owing to the dysfunctional immune system in PRCA, which promotes an immunosuppressive tumor microenvironment [3, 4].
Various therapeutic drugs have been used to enhance patient responses to immunotherapy. Targeting both CTLA-4 and PD-1 has been reported to result in a prostate-specific antigen response and objective response in some patients [5]. Moreover, to improve the efficacy of immunotherapy, researchers have focused on combination and sequential therapies [6]. For example, sipuleucel-T, an autologous cellular immunological agent, was the first immunotherapy approved by the FDA and has been shown to promote overall survival in patients with mCRPC [7]. Treatments using sipuleucel-T with anti-CTLA4 and anti-PD-L1 antibodies and an interleukin-15 (IL-15) superagonist are currently in clinical trials as new immunotherapy combination treatments [8]. In this study, we aimed to explore the genetic characteristics of the immunosuppressive tumor microenvironment and propose candidate drugs to improve patient responses to immunotherapy (Figure 1).
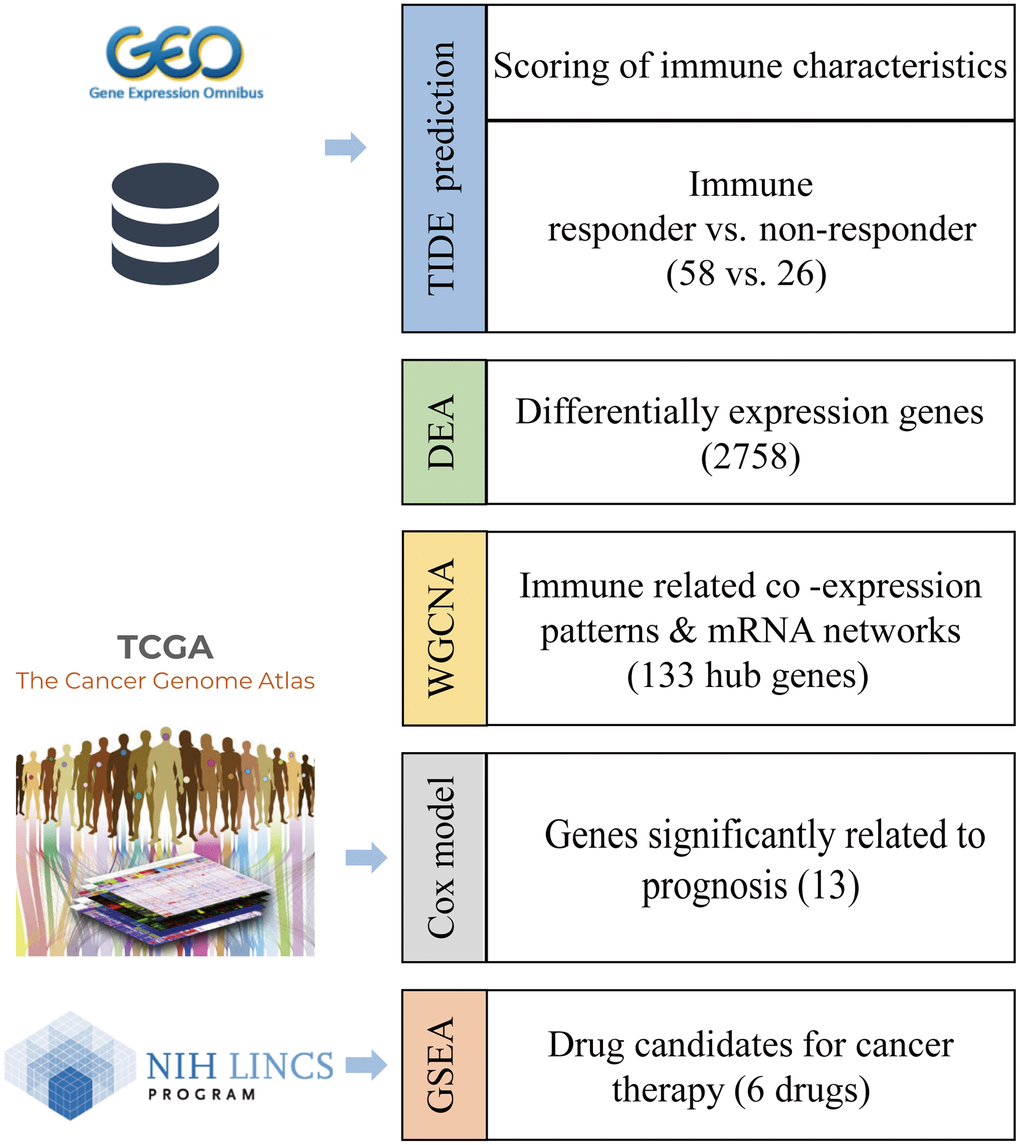
Figure 1. Workflow to identify the biomarkers of an immunotherapy response and candidate drugs.
Results
Prediction of immune response status by tumor immune dysfunction and exclusion (TIDE)
The mRNA expression profile of PRCA patients was obtained from the Gene Expression Omnibus (GEO) database (GSE183019). We predicted the responses of 84 patients to immunotherapy and estimated the scores of 10 immune features with TIDE. Overall, 58 patients were predicted to be responsive to immunotherapy as their TIDE score was <0, whereas the other 26 patients were considered non-responders (Figure 2A). All 58 responder patients were CTL true (positive for five cytotoxic T lymphocyte markers, including CD8A, CD8B, GZMA, GZMB, and PRF1), indicating that the immune response to tumor T cell infiltration is highly consistent; that is, patients with high T cell infiltration have a high probability of responding to immunotherapy. Moreover, interferon gamma (IFNG) was a positive biomarker for the immune checkpoint blockade therapy response, and the score of IFNG in responder samples was significantly higher than that in non-responders. Except for the cancer-associated fibroblast (CAF) score, all immune feature scores showed significant differences between the groups. In addition, Merck18 (T-cell-inflamed signature), IFNG, CD8, and dysfunction signatures showed the most significant differences between the immune response and non-response groups (Figure 2B, 2C).
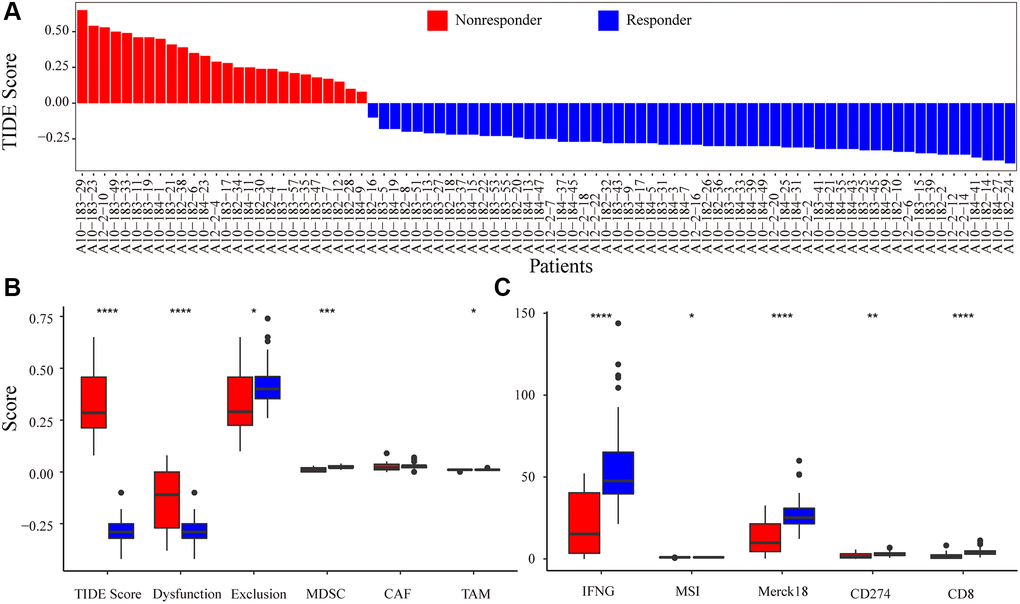
Figure 2. Immune-response prediction by Tumor Immune Dysfunction and Exclusion (TIDE). (A) Patients were predicted to be responders/non-responders to immunotherapy based on the TIDE score. (B) The score for immune features of TIDE score, Dysfunction, Exclusion, MDSC, CAF, and TAM predicted by TIDE. (C) The score for immune features of IFNG, MSI, Merck18, CD274, and CD8. Asterisks indicate the level of statistical significance: * < 0.05; ** < 0.01; *** < 0.001; and **** < 0.0001.
Identification of immune response-related genes through differential expression analysis (DEA)
By comparing the transcriptomes of 58 immune responder patients and 26 non-responder patients, 2758 immune response-related genes (IRRGs) were identified, and 99.42% (2742/2758) were expressed at low levels in immune-responsive samples (Figure 3A). The three most significant differentially expressed genes were HBA2, LOC100131257, and CCDC168. Notably, it has been reported that mutations in CCDC168 are associated with adenosquamous carcinoma of the prostate [9]. The top 30 differentially expressed genes included multiple non-coding RNAs, such as LINC00907, LINC01105, LINC00276, SNORA57, and SNORA76C (Figure 3B); these non-coding RNAs can regulate gene expression through post-transcriptional modifications, thereby affecting the immune microenvironment of the prostate.
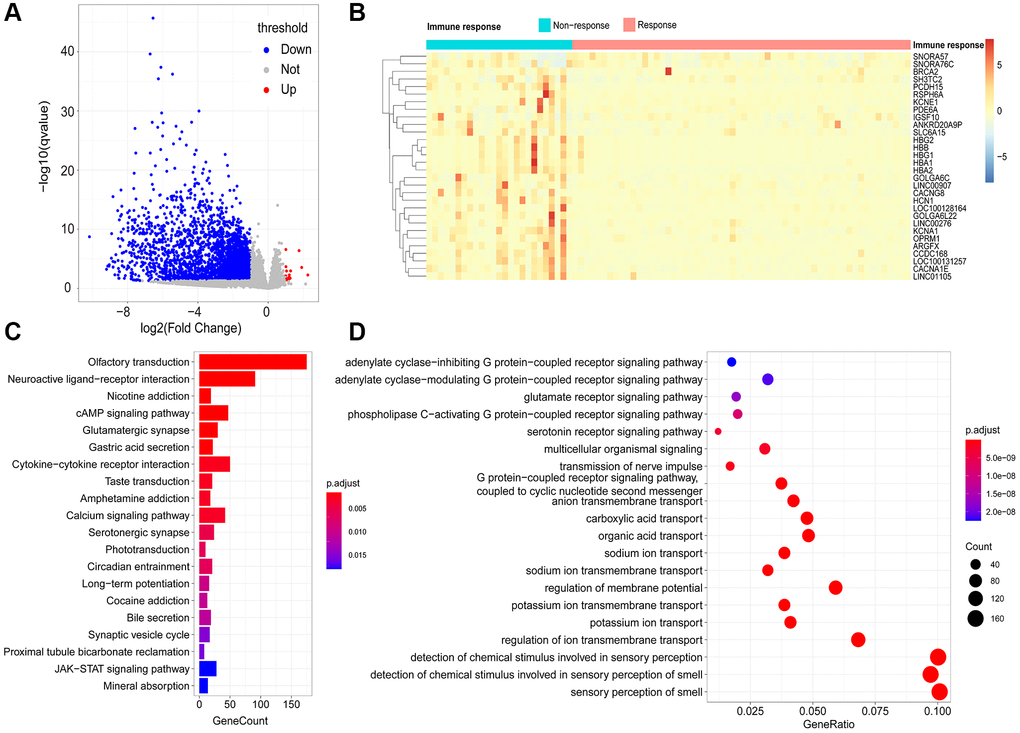
Figure 3. Identification of immune-response related genes (IRRGs). (A) Volcano plot of differentially expressed genes between responder and non-responder patient groups. In total, 2758 differentially expressed genes (DEGs) were considered as IRRGs. (B) Expression profiles of the top 30 significant IRRGs in responder and non-responder groups. The enriched KEGG pathways (C) and GO terms (D) of IRRGs were determined using ClusterProfiler.
Functional enrichment analysis of IRRGs
To explore the potential functional implications of IRRGs, we performed Gene Ontology (GO) and Kyoto Encyclopedia of Genes and Genomes (KEGG) enrichment analyses. As a result, the most significantly enriched pathways in KEGG were “olfactory transduction,” “cAMP signaling pathway,” and “calcium signaling pathway.” Moreover, “nicotine addiction” and “cytokine-cytokine receptor interaction” were also enriched in the KEGG pathways (Figure 3C). Similarly, GO enrichment analysis suggested that IRRGs were significantly enriched in material transport processes, such as “potassium ion transport,” “regulation of membrane transport,” and “anion transmembrane transport” (Figure 3D). Various signaling processes were also enriched, including “glutamate receptor signaling pathway” and “coupled receptor signaling pathway.” Functional annotation of IRRGs revealed that ion transport and signaling pathways are implicated in patient response to immunotherapy, thus contributing to anti-tumor immunosuppression.
IRRG co-expression module identification with weighted gene co-expression network analysis (WGCNA)
In total, 2758 differentially expressed IRRGs were involved in the co-expression modules. First, the soft threshold was determined through the scale independence and mean connectivity analysis of modules with different power values ranging from 1 to 20 (Supplementary Figure 1). In this study, the power value (β) was set to 6 to produce a hierarchical clustering tree with different colors representing different modules. As a result, 16 total modules with different IRRGs were identified and displayed with different colors.
The hierarchical clustering dendrogram of the patients based on the WGCNA distance matrix is shown in Figure 4A, and the immune responding patients were grouped together. IRRGs were grouped into 16 co-expression modules (Figure 4B), and the correlation between modules and immune features is displayed in Figure 4C, which suggested that turquoise module was significantly correlated with Merck18, IFNG, and myeloid-derived suppressor cells (MDSCs). Seven modules that were significantly associated with TIDE score, with p-value < 0.05, were retained for further analysis.
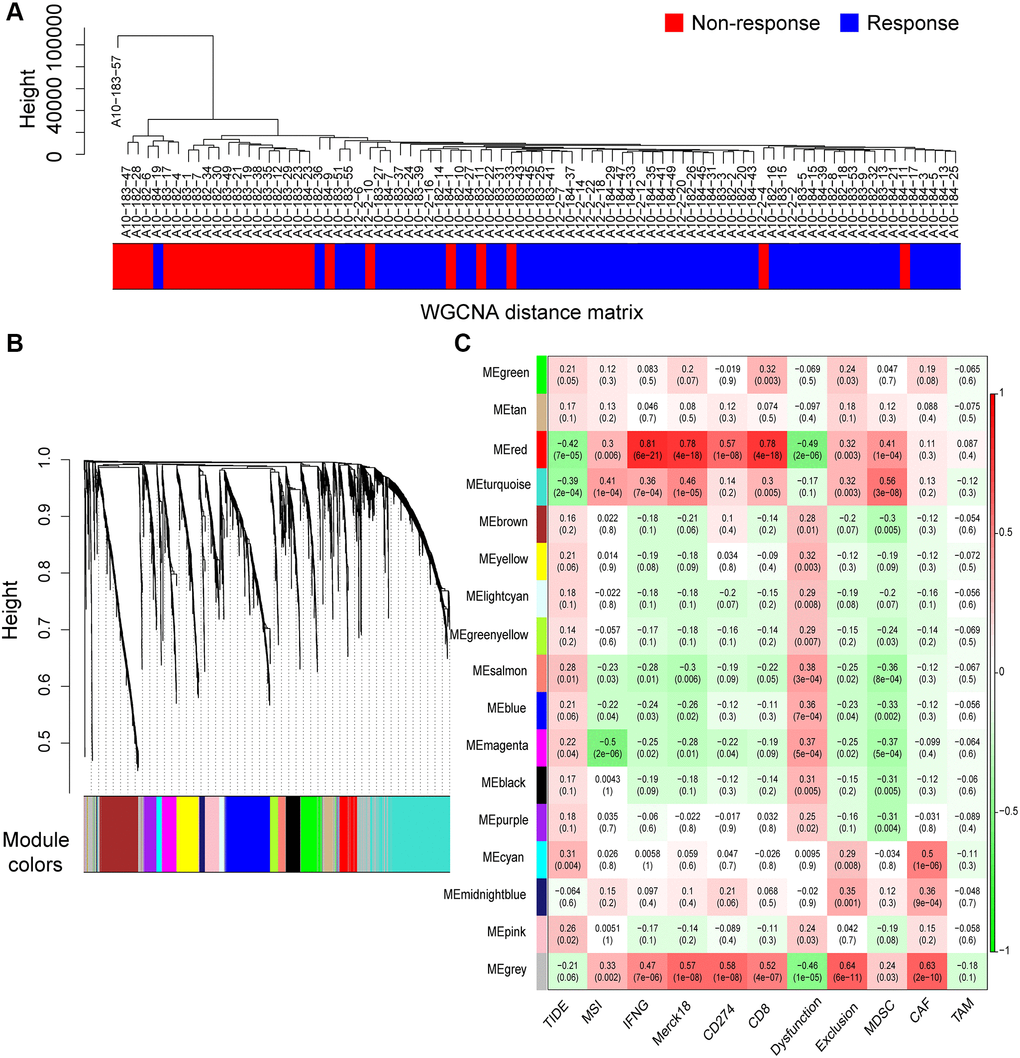
Figure 4. Co-expression modules of immune-response related genes (IRRGs) identified by weighted gene co-expression network analysis (WGCNA). (A) Sample dendrogram of patients based on transcriptome correlation. (B) Cluster dendrogram of IRRGs and 16 co-expression modules were identified by WGCNA. (C) Correlation coefficients between co-expression modules and immune features (above) with p-values (below).
To provide insight into the biological functions of the IRRGs in seven immune response-related modules, we performed GO (Supplementary Table 1) and KEGG (Supplementary Table 2) enrichment analysis. Most modules included enriched GO terms related to voltage-gated channels, such as “cation channel complex” (3/7), “ion transport” (5/7), and “sensory perception of smell” (4/7). Specifically, the IRRGs involved in the red module were significantly enriched in immune-related GO terms, such as “lymphocyte/T cell costimulation” “, immunological synapse ” “, positive regulation of adaptive immune response”, and “cytokine metabolic process” (Figure 5A). IRRGs of turquoise module were enriched in the “regulation of uterine smooth muscle contraction” (Figure 5B). Further, IRRGs of green (Figure 5C), magenta (Figure 5D), and cyan (Figure 5E) modules were mostly enriched in pathways related to “ion transport” and those of magenta module were especially enriched in “epidermal cell differentiation”. IRRGs of pink (Figure 5F) and salmon (Figure 5G) module were mostly enriched in “sensory perception of smell” and “olfactory receptor activity”, respectively.
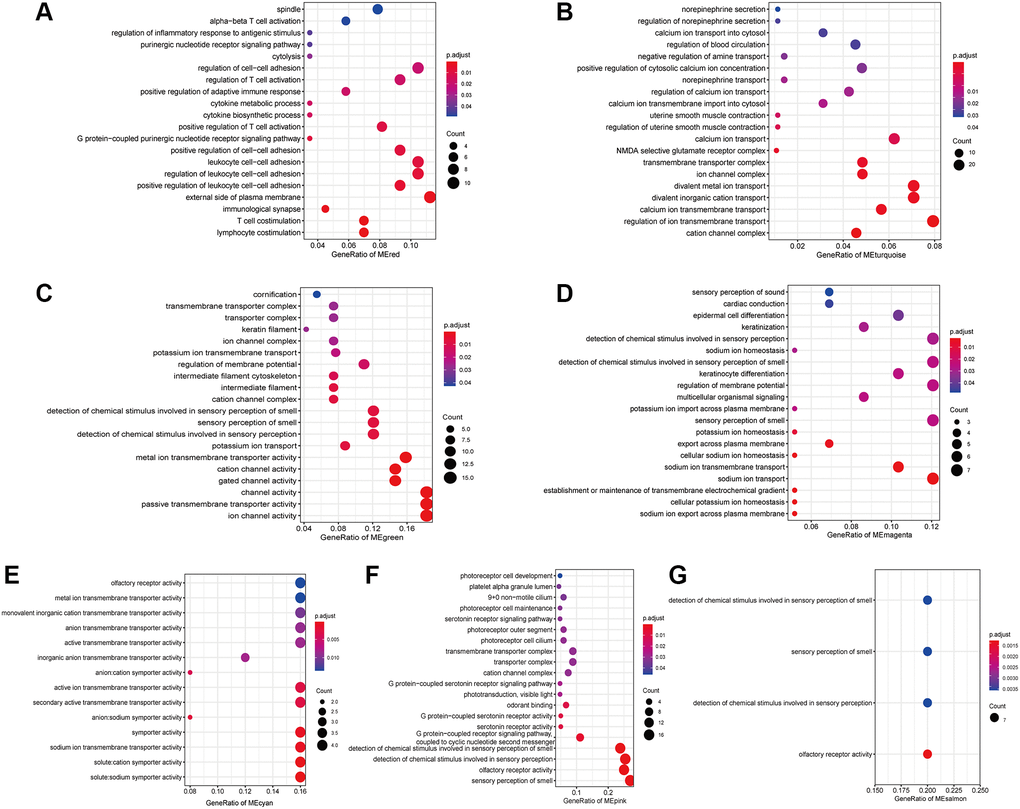
Figure 5. The enriched GO terms of IRRGs in the red module (A), turquoise module (B), green module (C), magenta module (D), cyan module (E), pink module (F), salmon module (G).
Identification of biomarkers of immunotherapy responses
To investigate the role of IRRGs as potential marker genes in immunotherapy response, we first identified hub genes in seven modules of interest (see Methods). Ultimately, 133 genes were identified as hub genes, which were selected for survival analysis (Table 1), and 13 of them were found to be significantly associated with PRCA prognosis. BICDL2, a protein-coding gene predicted to enable small GTPase binding activity, showed the most significant association with PRCA prognosis (p-value = 0.004). Moreover, the rest of the prognosis-related genes were as follows: ABHD17A (p-value = 0.0083), ARHGAP33 (p-value = 0.0093), AP5Z1 (p-value = 0.041), ARHGEF16 (p-value = 0.026), ASMTL-AS1 (p-value = 0.029), ATAD3B (p-value = 0,029), ATG16L2 (p-value = 0.014), AXIN1 (p-value = 0.042), LLCFC1 (p-value = 0.016), LENG8 (p-value = 0.018), KMT2B (p-value = 0.05), and CACNA1H (p-value = 0.041) (Figure 6). The IRRGs described previously herein were considered biomarkers of immunotherapy response in PRCA, which might affect the immune microenvironment, thus playing an important role in patient responses to immunotherapy and determining clinical outcomes.
Table 1. Number of immune-response related genes (IRRGs) included in seven modules that are significantly correlated with the tumor immune dysfunction and exclusion (TIDE) score and the hub genes in each module.
| Module color | Number of IRRGs | Most-related immune feature | Hub genes (number of hub genes) | ||||||||||||||||||||||||||||||||||||||||||||||||||||||||||||||||||||||||||||||||||||||||||||||||
| Red | 125 | IFNG | CDKN3 (1) | ||||||||||||||||||||||||||||||||||||||||||||||||||||||||||||||||||||||||||||||||||||||||||||||||
| Turquoise | 549 | MDSC | PAGR1, SIX5, PCED1A, BAHCC1, ARMC5, ATN1, SNRNP70, LOC100133091, KMT2B, CHPF, ABHD17A, CAPN15, SGSH, TMEM250, SAFB2, AMIGO3, ANO8, SDF4, H1FX, ARRDC1, SNAPC4, INPP5E, SLC12A9, ABHD15, SLC43A2, PCNX3, LLCFC1, PIM3, PPP1R3F, CASZ1, H1FX-AS1, PALM, SLC39A3, AGRN, GPR137, ARFGAP1, LENG8, ARHGAP33, BCAR1, CACNA1H, AGPAT2, CAPN10, SHC2, GUSBP11, GPANK1, SLC4A3, KIFC3, SCRIB, AP5Z1, ADCK2, AXIN1, ARHGEF1, GLTSCR1, INTS1, RNPEPL1, SH3TC1, ARFRP1, C19orf25, PARP10, CFAP410, ATG16L2, SNORD17, HDAC10, BICDL2, RRN3P3, C15orf39, ASMTL-AS1, ALDH16A1, ATAD3B, SCARF2, ATG4D, ARHGEF16, CLASRP, PPP1R16A, ANAPC2, CCDC9, BORCS6, PPP2R3B (78) | ||||||||||||||||||||||||||||||||||||||||||||||||||||||||||||||||||||||||||||||||||||||||||||||||
| Cyan | 45 | Dysfunction | LINC01360, SLC13A1, ALPG, LINC02881, OR7E5P, IGFBP1, CA9, OR1E2 (8) | ||||||||||||||||||||||||||||||||||||||||||||||||||||||||||||||||||||||||||||||||||||||||||||||||
| Salmon | 60 | Dysfunction | LINC01104, OR4F17, LINC01304, OR6C1, PLSCR5, PDYN, OR5AC2 (7) | ||||||||||||||||||||||||||||||||||||||||||||||||||||||||||||||||||||||||||||||||||||||||||||||||
| Pink | 114 | Dysfunction | KIF4B, CD1A, ANKRD18DP, PIH1D3, SATB2, AS1, ACOD1, GFY, GK2, LINC01180, C1orf185, HCRTR2, OR5AK2, OR1G1, C1orf141, LINC00297, LINC00433, OR2V1, ROPN1L-AS1 (18) | ||||||||||||||||||||||||||||||||||||||||||||||||||||||||||||||||||||||||||||||||||||||||||||||||
| Magenta | 108 | MSI | POU4F2, LINC01159, SLC5A12, KRTAP5-8, CADM2-AS2, ACTR3BP2, CD5L, LOC100132735, CETN1 (9) | ||||||||||||||||||||||||||||||||||||||||||||||||||||||||||||||||||||||||||||||||||||||||||||||||
| Green | 151 | CD8 | OR56B4, KRT38, KRT78, C14orf180, OR2B11, OR4D6, HMGA1P7, KRT39, KCNK18, OR5M9, C10orf120, PDHA2, KRT84 (13) | ||||||||||||||||||||||||||||||||||||||||||||||||||||||||||||||||||||||||||||||||||||||||||||||||
| Abbreviations: IFNG: interferon gamma; MDSC: myeloid-derived suppressor cell; MSI: microsatellite instability. | |||||||||||||||||||||||||||||||||||||||||||||||||||||||||||||||||||||||||||||||||||||||||||||||||||
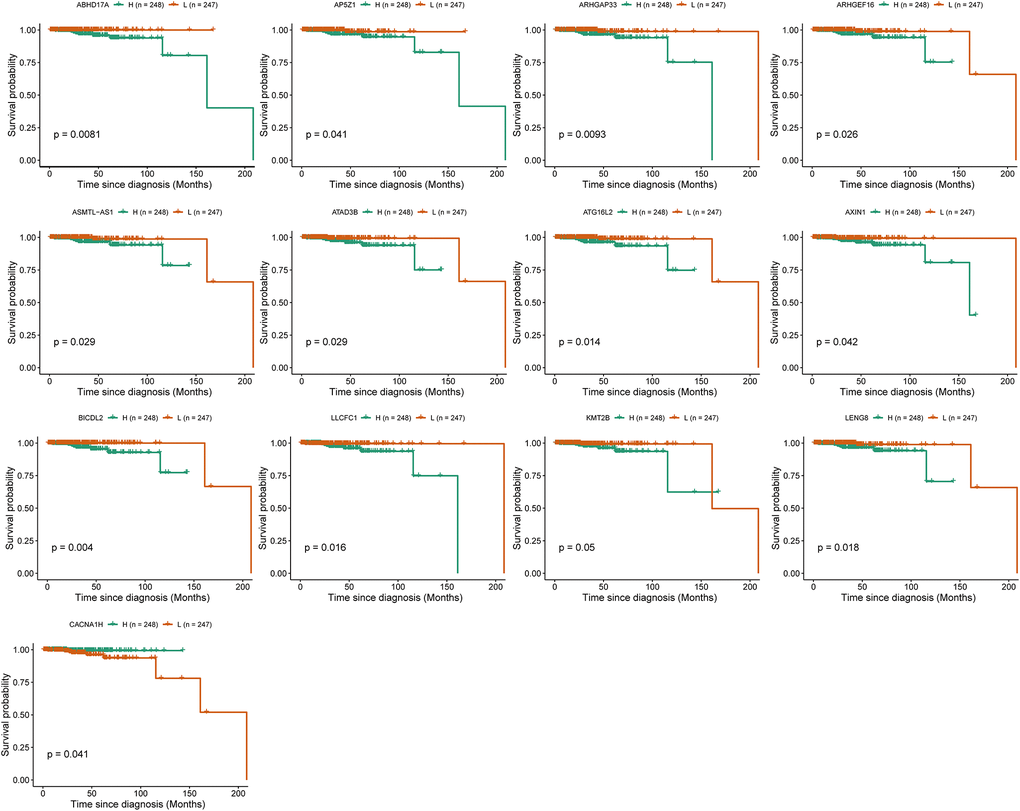
Figure 6. Survival analysis identified 13 immune-response related genes (IRRGs) significantly related to the prognosis of prostate cancer (PRCA). Patients were divided into a high expression group (H) and low expression group (L) according to the median expression of specific genes.
Construction of co-expression network
Using WGCNA, we constructed co-expression networks of the hub genes in the seven modules identified previously herein based on expression correlations to provide insights into the role of signature genes in PRCA pathogenesis. Excluding the red module, which had only one hub gene, we constructed networks for the other six modules. The results showed that in the turquoise module, INTS1 and KMT2B were at the center of the network. KMT2B was significantly related to survival and was related to multiple regulators of gene expression (Figure 7A), such as LOC100133091 and SNORD17, as well as the transcription factor (TF)-encoding genes CAPN15, SNAPC4, and CASZ1; these regulators themselves act as modular hub genes and might have regulatory functions. There were four lncRNAs and one snoRNA involved in the network of cyan module (Figure 7B). In green module, the co-expression relationship among 13 hub genes was presented (Figure 7C) and nine hub genes, including two lncRNAs and one TF-encoding gene were used in magenta module (Figure 7D). For hub genes in salmon and pink modules, the networks were constructed and presented in Figure 7E and 7F, respectively.
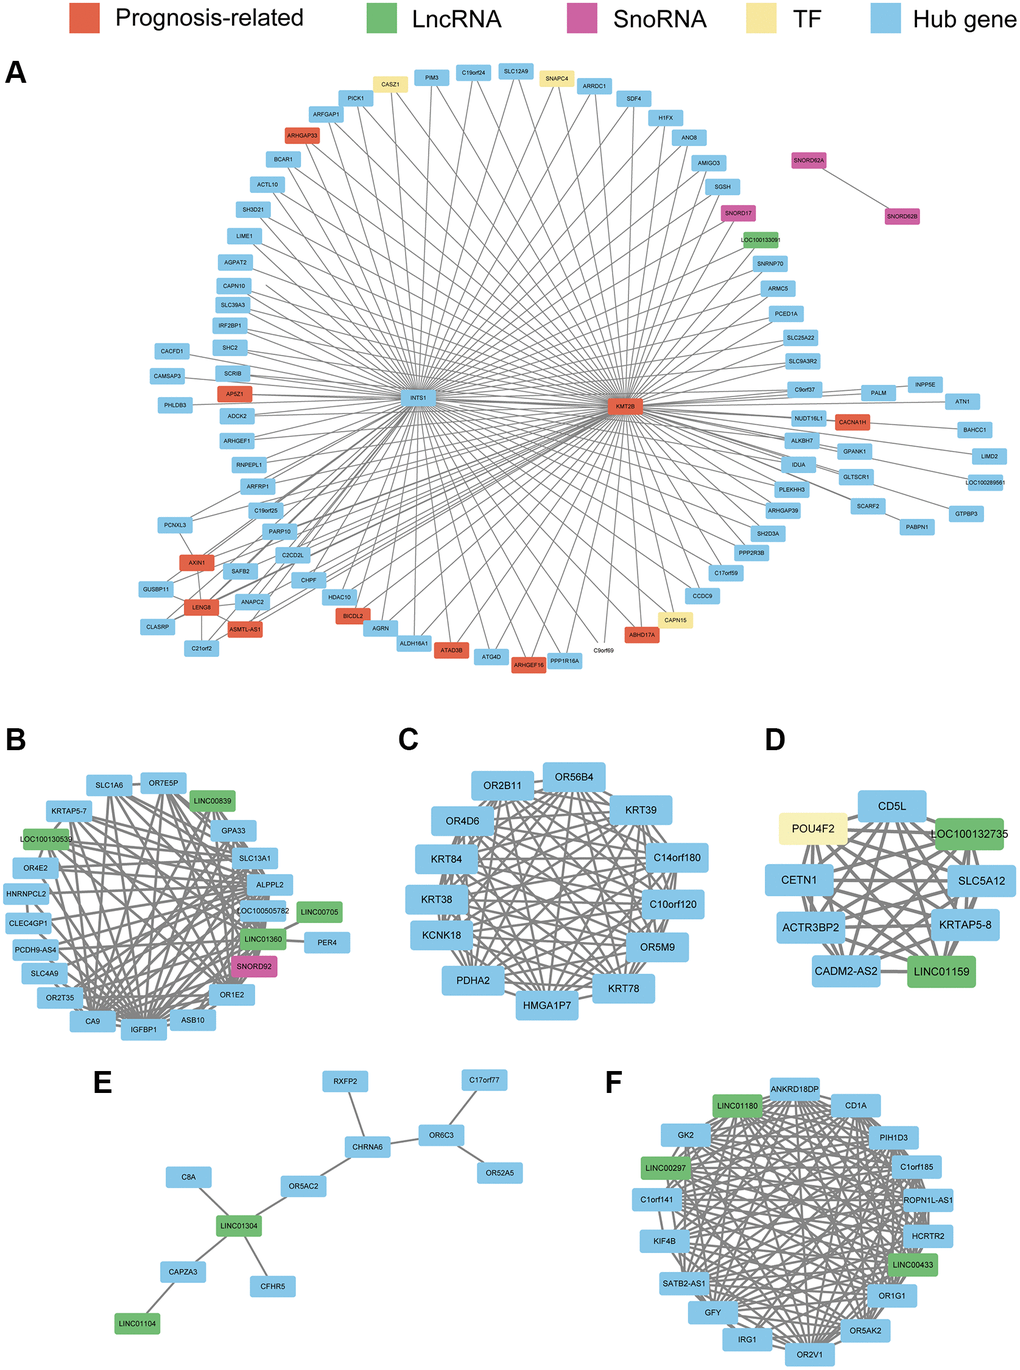
Figure 7. Co-expression network constructed with hub genes in the turquoise module (A), cyan module (B), green module (C), magenta module (D), salmon module (E), and pink module (F). Every node represents a hub gene or hub gene of co-expressed genes; genes significantly correlated with prognosis are colored red. LncRNAs, SnoRNAs, and transcription factors (TFs) are vital regulatory molecules and are colored with green, purple, and yellow, respectively. For the turquoise module, to obtain a clear picture, the edges weighted above 0.25 are displayed, whereas in the other six modules, edges weighted above 0.1 are displayed.
Identification of small molecules targeting core IRRGs
Having identified PRCA signature genes significantly associated with the immunotherapy response, most of which were downregulated in immune-responsive patients, we hypothesized that when signature genes are targeted with small molecules, the downregulated expression of these genes would sensitize cells to the drug. Such molecules could potentially reverse tolerance and facilitate therapy effectiveness when combined with traditional drugs. Data from the Library of Integrated Network-Based Cellular Signatures (LINCS) database were used to identify small molecules targeting PRCA signature genes, with their co-expressed genes were identified by WGCNA.
Based on the signature genes and the co-expression pairs identified by WGCNA, from hundreds of small molecules, we identified nine and two candidate drugs, respectively, from the expression profiles of the PC3 and LNCaP cell lines from the LINCS database (Figure 8A, Supplementary Table 3). These drugs regulated the expression of signature genes of PRCA significantly. Among them, four and two compounds, respectively, were considered for immunotherapy based on PC3 and LNCaP cells, and these significantly inhibited the expression of signature genes, making them potential candidates for combination therapies. For PC3 cells, resveratrol most significantly inhibited the expression of signature genes (Figure 8B), whereas in the LNCaP cell line, radicicol (Figure 8C) and PHA-793887 had the most significant effects. No compound was observed to have significant effectiveness in both cell lines.
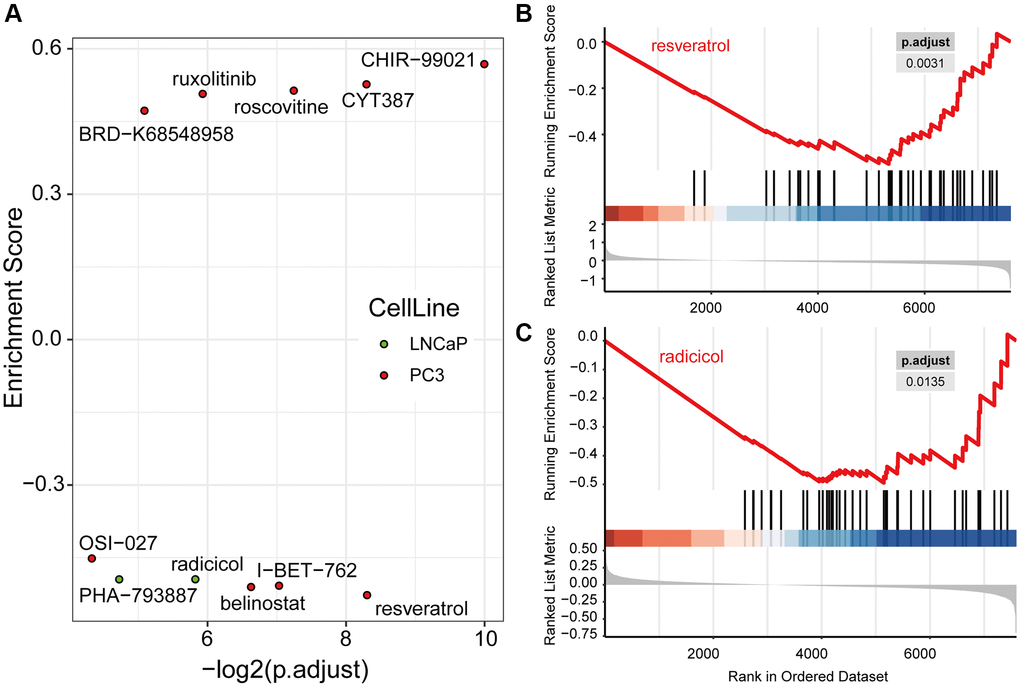
Figure 8. Drug candidates were filtered from the LINCS database, which were predicted to contribute to immunotherapy. (A) Nine drugs in PC3 and two drugs in LNCaP cells were significantly regulated hub genes computed by Gene Set Enrichment Analysis (GSEA). The GSEA plots of resveratrol (B) and radicicol (C), the most significantly effective drugs for the PC3 and LNCaP cell lines, respectively, show their regulation of hub genes.
Discussion
In this study, PRCA patients were divided into immune-responder and non-responder groups using a computational method. Between immune responders and non-responders, 2758 IRRGs were identified and clustered into 16 co-expression modules, seven of which were significantly correlated with the TIDE score. From seven modules of interest, 133 total hub genes were identified. The red module had only one hub gene that met the criteria, cyclin-dependent kinase inhibitor (CDKN3), which was upregulated in the immune responder sample group. As a tumor-promoting gene, CDKN3 encodes a protein that plays an important role in protein phosphorylation and cell cycle regulation [10]. Many studies have shown that alternative splicing and mutations in CDKN3 are related to the cellular immune microenvironment in liver cancer, and experiments conducted by Huang et al. showed that high expression of CDKN3 can be triggered by Tfh cell-derived signals, an epigenetic mechanism regulating activated B cells [11]. It is possible that CDKN3 promotes the proliferation of immune cells while promoting the proliferation of tumor cells, so that samples with high expression levels of CDKN3 are more likely to respond to immunotherapy.
Survival analysis of 133 hub genes identified 13 genes significantly associated with PRCA prognosis, specifically CACNA1H, BICDL2, ABHD17A, ARHGAP33, AP5Z1, ARHGEF16, ASMTL-AS1, ATAD3B, ATG16L2, AXIN1, LLCFC1, LENG8, and KMT2B, which were considered biomarkers for the immunosuppressive microenvironment. Low expression of these genes was associated with better prognosis, with the exception of CACNA1H, which encodes a protein involved in the voltage-dependent calcium channel complex; high expression of CACNA1H was found to be significantly associated with better prognosis, suggesting that ion transport plays an important role in PRCA. It has been reported that Cav3.2 T-type Ca2+ channels exist in 100% of PRCA patients, and Cav3.2 voltage-dependent calcium channels are involved in cell growth in PRCA [12]. Thus, CACNA1H might affect the response of patients to immunotherapy by affecting the function of ion channels. Further, researchers also found that somatic mutations in CACNA1H recur at the site of tumor metastasis, which could be related to immune escape in colorectal tumors [13]. ABHD17A (α/β-hydrolase domain-containing protein 17a) is another biomarker related to voltage channels. Previous research demonstrated that ABHD17A modulates ion channels at the post-transcriptional level by deacetylating the stress-regulated exon domains of large conductance voltage- and calcium-activated potassium channels [14]. Moreover, low expression of ABHD17A is associated with improved overall survival of PRCA according to survival analysis.
Previous studies have shown that some of the screened biomarkers affect the progression of various tumors through different molecular mechanisms. Regarding ARHGAP33, researchers have reported that it is a marker gene that can predict prognosis in prostate cancer [15], and ARHGAP family genes have been demonstrated to promote bladder cancer progression by establishing a tumor-promoting microenvironment [16]. ARHGEF16, encoding a nucleotide exchange factor that catalyzes the exchange of GDP nucleotides for GTP, is critical for cell proliferation, growth, and tumorigenesis in various cancers [17, 18]. Hiramoto-Yamaki et al. reported that ARHGEF16 could modulate the migration of breast cancer cells in a RhoG-dependent manner [19]. Further studies have shown that ARHGEF16 activates RhoG and PI3K, contributing to apoptosis resistance in tumor cells [20], and interacts with CKAP5 to promote the proliferation and migration of glioma cells [21]. Although the critical functions of ARHGEF16 have been reported in many cancer types, the underlying mechanism of its effect on PRCA prognosis remains to be elucidated. Moreover, ASMTL-AS1, a noncoding transcript, inhibits β-catenin expression and inactivates carcinogenic Wnt/β-catenin signaling in breast cancer [22]. ATG16L2 plays an important role in T cell autophagy [23]. AXIN1 contains a G-protein signaling regulation domain and a dishevelled and axin domain, and many studies have reported its modulation of immune-related signaling pathways in liver cancer [24, 25]. In addition to the genes previously mentioned, BICDL2, LLCFC1, LENG8, KMT2B, AP5Z1, and ATAD3B were also found to be IRRGs significantly associated with PRCA prognosis in this study, which were proposed to have vital roles in the response to immunotherapy in PRCA and require further study.
Based on the hub genes and co-expression pairs identified by WGCNA, we identified candidate drugs from hundreds of small molecules based on the mRNA expression profiles of the PC3 and LNCaP cell lines from the LINCS database. In PC3 cells, the most significantly effective drug, resveratrol, is a phytoestrogen with antioxidant, anti-inflammatory, cardioprotective, and anti-cancer properties [26]. Previous studies revealed that resveratrol can reverse multidrug resistance in cancer cells, and when used in combination with clinically used drugs, it can sensitize cancer cells to standard chemotherapeutic agents [27]. There have been many reports that resveratrol can inhibit tumor processes by regulating multiple pathways, and the pathways affected by resveratrol, such as the PI3K pathway, Wnt signaling, and inflammation-related pathways, affect the PRCA immunosuppressive microenvironment [28]; thus, resveratrol could become an adjuvant drug for immunotherapy to help improve its effectiveness. I-BET-762 is also well studied and was reported to reduce MYC expression in PRCA and subsequently inhibit cell growth and reduce the tumor burden [29]. Moreover, researchers have reported that bromodomain and extra-terminal (BET) bromodomain inhibition can mediate changes in expression at a genome-wide level in PRCA cells and increase the susceptibility of cancer cells to CD8 T cell targeting [30]. Thus, I-BET-762 acts as a BET inhibitor and could have clinical benefits for PRCXA patients in combination with immunotherapy. The other four proposed drugs—belinostat, OSI-027, radicicol, and PHA-793887—are less well-studied in relation to PRCA treatment. The FDA approved belinostat for the treatment of patients with relapsed or refractory peripheral T-cell lymphoma [31] and OSI-027 (also known as ASP7486) is a dual mTORC1/mTORC2 ATP-competitive kinase inhibitor [32]. Compared with the properties of PC3 cells, LNCaP cells might represent a striking feature of early androgen-dependent PRCA, as the significantly enriched drug radicicol potentiates radiation-induced cell killing in a hormone-sensitive PRCA cell line through degradation of the androgen receptor [33]. PHA-793887 is an inhibitor of multiple cyclin-dependent kinases (CDKs), with activity against CDK2, CDK1, and CDK4, and has been validated to enhance immunotherapy against melanoma [34]. However, few studies have investigated the effects of these four drugs on PRCA, and thus, further study is necessary.
Although the biomarker genes and candidate drugs that affect immunotherapy were mostly proven by existing studies, there are certain limitations to this study. The mRNA expression profile obtained from the LICNS database only includes the expression of 30.08% (40/133) hub genes, which possibly prevents the accurate prediction of candidate drugs (Supplementary Table 4). Moreover, the mechanisms underlying the effects of biomarkers require further investigation and experimental validation, as information on the ability of the proposed drugs to improve immunotherapy in PRCA is, apart from reported cases, lacking. Further research will focus on the mechanism underlying the effects of the proposed biomarkers, and more experiments are needed at the protein level and in vivo.
In conclusion, we integrated and analyzed datasets from multiple platforms to identify 133 hub genes in seven co-expression modules. Co-expression networks were constructed to reveal the regulatory relationships between them. Survival analysis identified 13 genes that were significantly associated with prognosis and considered biomarkers of the immunotherapy response for PRCA. Furthermore, we proposed six candidate drugs, two of which, resveratrol and I-BET-762, have been reported to be beneficial for PRCA treatment, whereas the other four, belinostat, OSI-027, radicicol, and PHA-793887, remain to be studied.
Methods
Data source
The mRNA expression profiles and dataset comprising clinical information of PRCA patients of GSE183019 were acquired from the GEO (https://www.ncbi.nlm.nih.gov/geo/) database [35, 36] and The Cancer Genome Atlas (TCGA, https://portal.gdc.cancer.gov) database [37]. Excluding normal tissue samples, 84 PRCA samples with count profiles of 25498 expressed genes were retained for further analysis. The transcriptome profiles of the PC3 and LNCaP cell lines with different drug perturbations were obtained from the LINCS (https://lincsproject.org/LINCS/) database [38], and data of a total of 1121 compounds with the expression of 7163 genes were collected.
Prediction of immune response status
TIDE [39] is an integrated web tool used to predict patient responses to immunotherapy. Based on tumor expression profiles, TIDE can score multiple transcriptomic biomarkers of several immune features, including immune system dysfunction, T cell exclusion, MDSCs, IFNG signature, CAFs, M2 subtype of tumor-associated macrophages (TAMs), microsatellite instability (MSI), Merck18, CD274, and CD8. These features were demonstrated to be related to patient responses to immunotherapy, and we calculated the estimated score of the immune features for each patient based on their mRNA expression profiles. Specifically, patients with a TIDE score < 0 were considered responders, whereas patients with a TIDE score > 0 were considered non-responders.
Identification of biomarkers of immunotherapy response
For co-expression modules constructed with WGCNA, hub genes of the modules of interest were identified first. For genes inside a given module, the within-module connectivity, called the module membership (MM), and the correlation with the TIDE score, called the gene significance trait (GS), were calculated as previously described [46]. Genes with high connectivity in the modules of significant immune features were identified as hub genes based on the cut-off criteria |MM| > 0.8 and |GS| > 0.2.
The expression profiles and related clinical information of PRCA samples were acquired from TCGA database. Survival analysis based on the Cox model was used to estimate the survival risk of patients under different conditions. For a specific hub gene, patients were divided into two groups according to median gene expression. Then, Kaplan–Meier curve analysis was performed with the R package “Survival” and the p-value between the two groups was also calculated. Hub genes (p-value < 0.05) that were significantly related to PRCA prognosis were considered biomarkers of the immunotherapy response.
Construction of mRNA interaction network
To better investigate the regulatory relationships between IRRGs, we constructed an IRRG co-expression network for hub genes identified in each module of interest. Significantly correlated pairs were used to construct the network based on Pearson’s correlation coefficients. Finally, the co-expression network graphs were visualized and analyzed using Cytoscape software [47].
Identification of candidate drugs from LINCS
To identify potential drugs to boost immunotherapy, we employed the method reported by Aissa et al. [48]. First, the mRNA expression profiles of hundreds of perturbations at various time points in PRCA cell lines were collected from LINCS. For each drug, different treatment groups, such as 6 h vs. 24 h, were compared to calculate the differentially expressed genes. According to the fold-change value associated with each gene, differentially expressed genes were ranked using Gene Set Enrichment Analysis (GSEA) [49]. Enrichment scores were calculated, and drugs with a p-value < 0.05 were considered significantly enriched. Specifically, a positive enrichment score shows that the drug has an upregulation effect on the target gene set, and a negative enrichment score indicates that the drug has a downregulation effect on the target gene set.
Supplementary Materials
Author Contributions
Conceptualization: Jinjian Yang and Zhangkui Jia; Investigation: Jinpeng Zhang and Xiaohui Ding; Writing and Editing: Jinpeng Zhang and Kun Peng.
Conflicts of Interest
All authors have completed the ICMJE uniform disclosure form. The authors have no conflicts of interest to declare.
Funding
This work was supported by the National Nature Science Foundation of China [grant number 81570685] and the National Science and Technology Major Project [grant number 2017ZX09304030].
References
- 1. Boettcher AN, Usman A, Morgans A, VanderWeele DJ, Sosman J, Wu JD. Past, Current, and Future of Immunotherapies for Prostate Cancer. Front Oncol. 2019; 9:884. https://doi.org/10.3389/fonc.2019.00884 [PubMed]
- 2. Fu J, Li K, Zhang W, Wan C, Zhang J, Jiang P, Liu XS. Large-scale public data reuse to model immunotherapy response and resistance. Genome Med. 2020; 12:21. https://doi.org/10.1186/s13073-020-0721-z [PubMed]
- 3. Strasner A, Karin M. Immune Infiltration and Prostate Cancer. Front Oncol. 2015; 5:128. https://doi.org/10.3389/fonc.2015.00128 [PubMed]
- 4. Bou-Dargham MJ, Sha L, Sang QA, Zhang J. Immune landscape of human prostate cancer: immune evasion mechanisms and biomarkers for personalized immunotherapy. BMC Cancer. 2020; 20:572. https://doi.org/10.1186/s12885-020-07058-y [PubMed]
- 5. Rescigno P, de Bono JS. Immunotherapy for lethal prostate cancer. Nat Rev Urol. 2019; 16:69–70. https://doi.org/10.1038/s41585-018-0121-y [PubMed]
- 6. Teo MY, Rathkopf DE, Kantoff P. Treatment of Advanced Prostate Cancer. Annu Rev Med. 2019; 70:479–99. https://doi.org/10.1146/annurev-med-051517-011947 [PubMed]
- 7. Handy CE, Antonarakis ES. Sipuleucel-T for the treatment of prostate cancer: novel insights and future directions. Future Oncol. 2018; 14:907–17. https://doi.org/10.2217/fon-2017-0531 [PubMed]
- 8. Boudadi K, Suzman DL, Anagnostou V, Fu W, Luber B, Wang H, Niknafs N, White JR, Silberstein JL, Sullivan R, Dowling D, Harb R, Nirschl TR, et al. Ipilimumab plus nivolumab and DNA-repair defects in AR-V7-expressing metastatic prostate cancer. Oncotarget. 2018; 9:28561–71. https://doi.org/10.18632/oncotarget.25564 [PubMed]
- 9. Lee JK, Phillips JW, Smith BA, Park JW, Stoyanova T, McCaffrey EF, Baertsch R, Sokolov A, Meyerowitz JG, Mathis C, Cheng D, Stuart JM, Shokat KM, et al. N-Myc Drives Neuroendocrine Prostate Cancer Initiated from Human Prostate Epithelial Cells. Cancer Cell. 2016; 29:536–47. https://doi.org/10.1016/j.ccell.2016.03.001 [PubMed]
- 10. Wang H, Chen H, Zhou H, Yu W, Lu Z. Cyclin-Dependent Kinase Inhibitor 3 Promotes Cancer Cell Proliferation and Tumorigenesis in Nasopharyngeal Carcinoma by Targeting p27. Oncol Res. 2017; 25:1431–40. https://doi.org/10.3727/096504017X14835311718295 [PubMed]
- 11. Kawai H, Kobayashi M, Hiramoto-Yamaki N, Harada K, Negishi M, Katoh H. Ephexin4-mediated promotion of cell migration and anoikis resistance is regulated by serine 897 phosphorylation of EphA2. FEBS Open Bio. 2013; 3:78–82. https://doi.org/10.1016/j.fob.2013.01.002 [PubMed]
- 12. Sekiguchi F, Kawabata A. [Role of Cav3.2 T-type Ca2+ channels in prostate cancer cells]. Nihon Yakurigaku Zasshi. 2019; 154:97–102. https://doi.org/10.1254/fpj.154.97 [PubMed]
- 13. Li C, Xu J, Wang X, Zhang C, Yu Z, Liu J, Tai Z, Luo Z, Yi X, Zhong Z. Whole exome and transcriptome sequencing reveal clonal evolution and exhibit immune-related features in metastatic colorectal tumors. Cell Death Discov. 2021; 7:222. https://doi.org/10.1038/s41420-021-00607-9 [PubMed]
- 14. McClafferty H, Runciman H, Shipston MJ. Site-specific deacylation by ABHD17a controls BK channel splice variant activity. J Biol Chem. 2020; 295:16487–96. https://doi.org/10.1074/jbc.RA120.015349 [PubMed]
- 15. Wang Y, Lin J, Yan K, Wang J. Identification of a Robust Five-Gene Risk Model in Prostate Cancer: A Robust Likelihood-Based Survival Analysis. Int J Genomics. 2020; 2020:1097602. https://doi.org/10.1155/2020/1097602 [PubMed]
- 16. Yang C, Wu S, Mou Z, Zhou Q, Zhang Z, Chen Y, Ou Y, Chen X, Dai X, Xu C, Liu N, Jiang H. Transcriptomic Analysis Identified ARHGAP Family as a Novel Biomarker Associated With Tumor-Promoting Immune Infiltration and Nanomechanical Characteristics in Bladder Cancer. Front Cell Dev Biol. 2021; 9:657219. https://doi.org/10.3389/fcell.2021.657219 [PubMed]
- 17. Yu B, Xu L, Chen L, Wang Y, Jiang H, Wang Y, Yan Y, Luo S, Zhai Z. FYN is required for ARHGEF16 to promote proliferation and migration in colon cancer cells. Cell Death Dis. 2020; 11:652. https://doi.org/10.1038/s41419-020-02830-1 [PubMed]
- 18. Lee J, Park B, Kim G, Kim K, Pak J, Kim K, Ye MB, Park SG, Park D. Arhgef16, a novel Elmo1 binding partner, promotes clearance of apoptotic cells via RhoG-dependent Rac1 activation. Biochim Biophys Acta. 2014; 1843:2438–47. https://doi.org/10.1016/j.bbamcr.2014.07.006 [PubMed]
- 19. Hiramoto-Yamaki N, Takeuchi S, Ueda S, Harada K, Fujimoto S, Negishi M, Katoh H. Ephexin4 and EphA2 mediate cell migration through a RhoG-dependent mechanism. J Cell Biol. 2010; 190:461–77. https://doi.org/10.1083/jcb.201005141 [PubMed]
- 20. Harada K, Hiramoto-Yamaki N, Negishi M, Katoh H. Ephexin4 and EphA2 mediate resistance to anoikis through RhoG and phosphatidylinositol 3-kinase. Exp Cell Res. 2011; 317:1701–13. https://doi.org/10.1016/j.yexcr.2011.05.014 [PubMed]
- 21. Huang D, Wang Y, Xu L, Chen L, Cheng M, Shi W, Xiong H, Zalli D, Luo S. GLI2 promotes cell proliferation and migration through transcriptional activation of ARHGEF16 in human glioma cells. J Exp Clin Cancer Res. 2018; 37:247. https://doi.org/10.1186/s13046-018-0917-x [PubMed]
- 22. Sun J, Li X, Yu E, Liu J, Sun L, He Q, Lu Q. A novel tumor suppressor ASMTL-AS1 regulates the miR-1228-3p/SOX17/β-catenin axis in triple-negative breast cancer. Diagn Pathol. 2021; 16:45. https://doi.org/10.1186/s13000-021-01105-3 [PubMed]
- 23. Yin L, Liu J, Dong H, Xu E, Qiao Y, Wang L, Zhang L, Jia J, Li L, Geng X. Autophagy-related gene16L2, a potential serum biomarker of multiple sclerosis evaluated by bead-based proteomic technology. Neurosci Lett. 2014; 562:34–8. https://doi.org/10.1016/j.neulet.2013.12.070 [PubMed]
- 24. Chan AW, Zhang Z, Chong CC, Tin EK, Chow C, Wong N. Genomic landscape of lymphoepithelioma-like hepatocellular carcinoma. J Pathol. 2019; 249:166–72. https://doi.org/10.1002/path.5313 [PubMed]
- 25. Ge PL, Li SF, Wang WW, Li CB, Fu YB, Feng ZK, Li L, Zhang G, Gao ZQ, Dang XW, Wu Y. Prognostic values of immune scores and immune microenvironment-related genes for hepatocellular carcinoma. Aging (Albany NY). 2020; 12:5479–99. https://doi.org/10.18632/aging.102971 [PubMed]
- 26. Rauf A, Imran M, Butt MS, Nadeem M, Peters DG, Mubarak MS. Resveratrol as an anti-cancer agent: A review. Crit Rev Food Sci Nutr. 2018; 58:1428–47. https://doi.org/10.1080/10408398.2016.1263597 [PubMed]
- 27. Ko JH, Sethi G, Um JY, Shanmugam MK, Arfuso F, Kumar AP, Bishayee A, Ahn KS. The Role of Resveratrol in Cancer Therapy. Int J Mol Sci. 2017; 18:2589. https://doi.org/10.3390/ijms18122589 [PubMed]
- 28. Silk N, Reich J, Sinha R, Chawla S, Geary K, Zhang D. The Effects of Resveratrol on Prostate Cancer through Targeting the Tumor Microenvironment. J Xenobiot. 2021; 11:16–32. https://doi.org/10.3390/jox11010002 [PubMed]
- 29. Wyce A, Degenhardt Y, Bai Y, Le B, Korenchuk S, Crouthame MC, McHugh CF, Vessella R, Creasy CL, Tummino PJ, Barbash O. Inhibition of BET bromodomain proteins as a therapeutic approach in prostate cancer. Oncotarget. 2013; 4:2419–29. https://doi.org/10.18632/oncotarget.1572 [PubMed]
- 30. Mao W, Ghasemzadeh A, Freeman ZT, Obradovic A, Chaimowitz MG, Nirschl TR, McKiernan E, Yegnasubramanian S, Drake CG. Immunogenicity of prostate cancer is augmented by BET bromodomain inhibition. J Immunother Cancer. 2019; 7:277. https://doi.org/10.1186/s40425-019-0758-y [PubMed]
- 31. Lee HZ, Kwitkowski VE, Del Valle PL, Ricci MS, Saber H, Habtemariam BA, Bullock J, Bloomquist E, Li Shen Y, Chen XH, Brown J, Mehrotra N, Dorff S, et al. FDA Approval: Belinostat for the Treatment of Patients with Relapsed or Refractory Peripheral T-cell Lymphoma. Clin Cancer Res. 2015; 21:2666–70. https://doi.org/10.1158/1078-0432.CCR-14-3119 [PubMed]
- 32. Mateo J, Olmos D, Dumez H, Poondru S, Samberg NL, Barr S, Van Tornout JM, Jie F, Sandhu S, Tan DS, Moreno V, LoRusso PM, Kaye SB, Schöffski P. A first in man, dose-finding study of the mTORC1/mTORC2 inhibitor OSI-027 in patients with advanced solid malignancies. Br J Cancer. 2016; 114:889–96. https://doi.org/10.1038/bjc.2016.59 [PubMed]
- 33. Harashima K, Akimoto T, Nonaka T, Tsuzuki K, Mitsuhashi N, Nakano T. Heat shock protein 90 (Hsp90) chaperone complex inhibitor, radicicol, potentiated radiation-induced cell killing in a hormone-sensitive prostate cancer cell line through degradation of the androgen receptor. Int J Radiat Biol. 2005; 81:63–76. https://doi.org/10.1080/09553000400029460 [PubMed]
- 34. Dextras C, Dashnyam M, Griner LAM, Sundaresan J, Chim B, Yu Z, Vodnala S, Lee CR, Hu X, Southall N, Marugan JJ, Jadhav A, Restifo NP, et al. Identification of Small Molecule Enhancers of Immunotherapy for Melanoma. Sci Rep. 2020; 10:5688. https://doi.org/10.1038/s41598-020-62369-1 [PubMed]
- 35. Edgar R, Domrachev M, Lash AE. Gene Expression Omnibus: NCBI gene expression and hybridization array data repository. Nucleic Acids Res. 2002; 30:207–10. https://doi.org/10.1093/nar/30.1.207 [PubMed]
- 36. Barrett T, Wilhite SE, Ledoux P, Evangelista C, Kim IF, Tomashevsky M, Marshall KA, Phillippy KH, Sherman PM, Holko M, Yefanov A, Lee H, Zhang N, et al. NCBI GEO: archive for functional genomics data sets--update. Nucleic Acids Res. 2013; 41:D991–5. https://doi.org/10.1093/nar/gks1193 [PubMed]
- 37. Weinstein JN, Collisson EA, Mills GB, Shaw KR, Ozenberger BA, Ellrott K, Shmulevich I, Sander C, Stuart JM, and Cancer Genome Atlas Research Network. The Cancer Genome Atlas Pan-Cancer analysis project. Nat Genet. 2013; 45:1113–20. https://doi.org/10.1038/ng.2764 [PubMed]
- 38. Subramanian A, Narayan R, Corsello SM, Peck DD, Natoli TE, Lu X, Gould J, Davis JF, Tubelli AA, Asiedu JK, Lahr DL, Hirschman JE, Liu Z, et al. A Next Generation Connectivity Map: L1000 Platform and the First 1,000,000 Profiles. Cell. 2017; 171:1437–52.e17. https://doi.org/10.1016/j.cell.2017.10.049 [PubMed]
- 39. Jiang P, Gu S, Pan D, Fu J, Sahu A, Hu X, Li Z, Traugh N, Bu X, Li B, Liu J, Freeman GJ, Brown MA, et al. Signatures of T cell dysfunction and exclusion predict cancer immunotherapy response. Nat Med. 2018; 24:1550–8. https://doi.org/10.1038/s41591-018-0136-1 [PubMed]
- 40. Love MI, Huber W, Anders S. Moderated estimation of fold change and dispersion for RNA-seq data with DESeq2. Genome Biol. 2014; 15:550. https://doi.org/10.1186/s13059-014-0550-8 [PubMed]
- 41. Gene Ontology Consortium. Gene Ontology Consortium: going forward. Nucleic Acids Res. 2015; 43:D1049–56. https://doi.org/10.1093/nar/gku1179 [PubMed]
- 42. Kanehisa M, Furumichi M, Tanabe M, Sato Y, Morishima K. KEGG: new perspectives on genomes, pathways, diseases and drugs. Nucleic Acids Res. 2017; 45:D353–61. https://doi.org/10.1093/nar/gkw1092 [PubMed]
- 43. Yu G, Wang LG, Han Y, He QY. clusterProfiler: an R package for comparing biological themes among gene clusters. OMICS. 2012; 16:284–7. https://doi.org/10.1089/omi.2011.0118 [PubMed]
- 44. Langfelder P, Horvath S. WGCNA: an R package for weighted correlation network analysis. BMC Bioinformatics. 2008; 9:559. https://doi.org/10.1186/1471-2105-9-559 [PubMed]
- 45. Lian W, Jin H, Cao J, Zhang X, Zhu T, Zhao S, Wu S, Zou K, Zhang X, Zhang M, Zheng X, Peng M. Identification of novel biomarkers affecting the metastasis of colorectal cancer through bioinformatics analysis and validation through qRT-PCR. Cancer Cell Int. 2020; 20:105. https://doi.org/10.1186/s12935-020-01180-4 [PubMed]
- 46. Zhang B, Horvath S. A general framework for weighted gene co-expression network analysis. Stat Appl Genet Mol Biol. 2005; 4:Article17. https://doi.org/10.2202/1544-6115.1128 [PubMed]
- 47. Shannon P, Markiel A, Ozier O, Baliga NS, Wang JT, Ramage D, Amin N, Schwikowski B, Ideker T. Cytoscape: a software environment for integrated models of biomolecular interaction networks. Genome Res. 2003; 13:2498–504. https://doi.org/10.1101/gr.1239303 [PubMed]
- 48. Aissa AF, Islam ABMMK, Ariss MM, Go CC, Rader AE, Conrardy RD, Gajda AM, Rubio-Perez C, Valyi-Nagy K, Pasquinelli M, Feldman LE, Green SJ, Lopez-Bigas N, et al. Single-cell transcriptional changes associated with drug tolerance and response to combination therapies in cancer. Nat Commun. 2021; 12:1628. https://doi.org/10.1038/s41467-021-21884-z [PubMed]
- 49. Subramanian A, Tamayo P, Mootha VK, Mukherjee S, Ebert BL, Gillette MA, Paulovich A, Pomeroy SL, Golub TR, Lander ES, Mesirov JP. Gene set enrichment analysis: a knowledge-based approach for interpreting genome-wide expression profiles. Proc Natl Acad Sci U S A. 2005; 102:15545–50. https://doi.org/10.1073/pnas.0506580102 [PubMed]