


Introduction
Research on tumor cell death has been the main goal of cancer treatment, and the mechanism of acquired or intrinsic resistance to apoptosis and necrosis of cancer cells has become a key research object in the field of tumor treatment. After more than 30 years of exploration of the mechanism of programmed death of cancer cells, necrotic apoptosis has been confirmed to be a typical form of cancer cell necrosis, which is mediated by receptor interacting protein kinase 3 (RIPK3) and mixed-lineage kinase domain-like synergism [1, 2]. Ferroptosis, iron-catalyzed necrosis, is a recently discovered form of programmed cell death [3], in which cell necrosis is regulated by over-peroxidation of polyunsaturated fatty acids (PUFAs). Increased iron dependence is responsible for cancer cells not being able to undergo typical necrotizing apoptosis [4, 5] and ultimately fail to initiate the death program in the normal human metabolic environment, which is an important reason for cancer cells proliferation and evasion of immune attack or drug treatment.
Ferroptosis-related genes (FRGs) in a variety of tumors (such as hepatocellular carcinoma [6], kidney renal clear cell carcinoma [7], lung adenocarcinoma and esophageal carcinoma, etc. [8]) significantly affect the survival time of tumor patients, and are related to a variety of immune cells and immune-related signaling pathways [9, 10]. However, the association of FRGs with local immune cytolytic activity (LICA) and tumor micro-environmental (TME) metabolism in basal cell carcinoma (BCC) and squamous cell carcinoma (SCC) has not been reported. In this study, we compared the expression differences of FRGs in the LICA and related immune pathways and metabolism function between BCC and SCC, and found some important immune signaling pathways in SCC tumors are significantly up-regulated along with high-level cytolytic activity of immune cells.
Materials and Methods
Sources of original data
The datasets used to explore the genes expression characteristics of BCC and SCC were retrieved from two gene expression matrices GSE7553 [11] and GSE125285 [12] in the Gene Expression Omnibus (GEO) database. Genes expression matrix data from 15 BCC, 11 SCC and 4 normal samples in the GSE7533 dataset and 25 BCC, 10 SCC and 35 adjacent normal tissue samples in the GSE125285 dataset were used in this study. To verify and accurately understand the difference in the role of LICA in BCC and SCC tissues, this study extracted the immune T cell communities from a single-cell RNA-seq (scRNA-seq) dataset GSE123813 [13] for further validation.
Functional enrichment analysis of DEGs gene set
To reduce the impact of sample batch effect between different studies, the normalized function of limma (version 3.46) program was used to normalize the data matrices in the two studies respectively. And the differentially expressed genes (DEGs with P.adj < 0.05, log2FoldChange > 1) in BCC and SCC samples were selected as the DEGs gene set. Genes function enrichment analysis was performed using gene set variation analysis (GSVA, version 1.42), including differences in correlation between LICA or TME metabolic function and FRGs. In addition, the DEGs gene set was used to compare between the two studies with the gene expression matrix of normal or adjacent normal tissues and the genes enrichment analysis results of BCC and SCC.
Sources of ferroptosis genes, LICA and TME gene set
The LICA related gene set used for single sample gene set enrichment analysis (ssGSEA) comes from the attached files of the cytolytic activity of 18 TCGA tumors by Rooney et al. [14], including 15 immune cells and 14 immune cell-related functions used to describe the correlation difference of FRGs. Differences in TME changes related to FRGs refers to Peng et al. [15] based on the 7 metabolic expression subtypes of 33 TCGA tumor classifications: including amino acid, TCA cycle, nucleotide, energy, carbohydrate, lipid, and vitamin and cofactor metabolism. The 63 FRGs were collected from the review of Hassannia et al. [4] and the results of related tumor studies [16]. Tumor associated epithelial–mesenchymal transition (EMT) activity and reactive oxygen species (ROS) function gene sets were retrieved from MSigDB database [17].
Methods and instruments for statistical analysis
The overall score share (OSS) of all samples is a score calculated based on sample size and gene expression levels in selected gene sets to assess the activity of biological processes in different sample types. OSS was calculated by formula
The ferroptosis potential index (FPI), proposed by Liu et al. [8] to explore the role of ferroptosis-related factors or biological processes, is a model based on the difference between positive and negative scores of ssGSEA enrichment results. In this study, the Student’s t-test or Wilcox-test was used for the comparison between the two groups of samples, and ANOVA was used for the comparison in the three groups of samples, and P <0.05 was considered statistically significant. Seurat 4.0 [18] and GSVA 1.42 [19] were used in multimodal single-cell and gene set enrichment analysis respectively. All analytical processes were performed in R-4.0.4 (R Foundation for Statistical Computing, Vienna, Austria) environment.
Results
Ten ferroptosis genes included in the DEGs gene set
As shown in Figure 1A, in GSE7553 and GSE125285, BCC vs. SCC obtains 1792 and 3572 DEGs, respectively. In the total gene set consisting of 917 DEGs (P.adj < 0.05, log2FoldChange > 1), there are 10 FRGs, including SLC1A5, AKR1C1, AKR1C2, AKR1C3, CD44, TP53, STEAP3, NQO1, HMOX1 and ACSF2. Notably, members C1, C2, and C3 of Aldo-Keto reductase family 1 (AKR1) appear in the DEGs gene set. The results of the protein-protein interaction (PPI) network related to these 10 genes are shown in Figure 1B. Proteins AKR1 and NAD(P)H quinone dehydrogenase 1 (NQO1) are directly connected with a enrichment P value is 2.38e-6. These probably indicate that the ferroptosis gene-related redox reactions is involved in tumor cell microenvironment metabolism and plays an important role in BCC and SCC. Further genes function enrichment analysis showed (Figure 1C) that ferroptosis, central carbon metabolism in cancer and steroid hormone synthesis have higher strength (this measure describes how large the enrichment effect is.), followed by tumor-related p53 and microRNA alteration. Based on the RNA expression pattern and the co-expression score of protein co-regulation, Figure 1D depicts the co-expression of these 10 FRGs in other species (such as B. taurus, M. musculus, etc.). Apart from the genes TP53 and ACSF2, the relative expression of other FRGs were significantly higher in the SCC group than in the BCC group (Figure 1E).
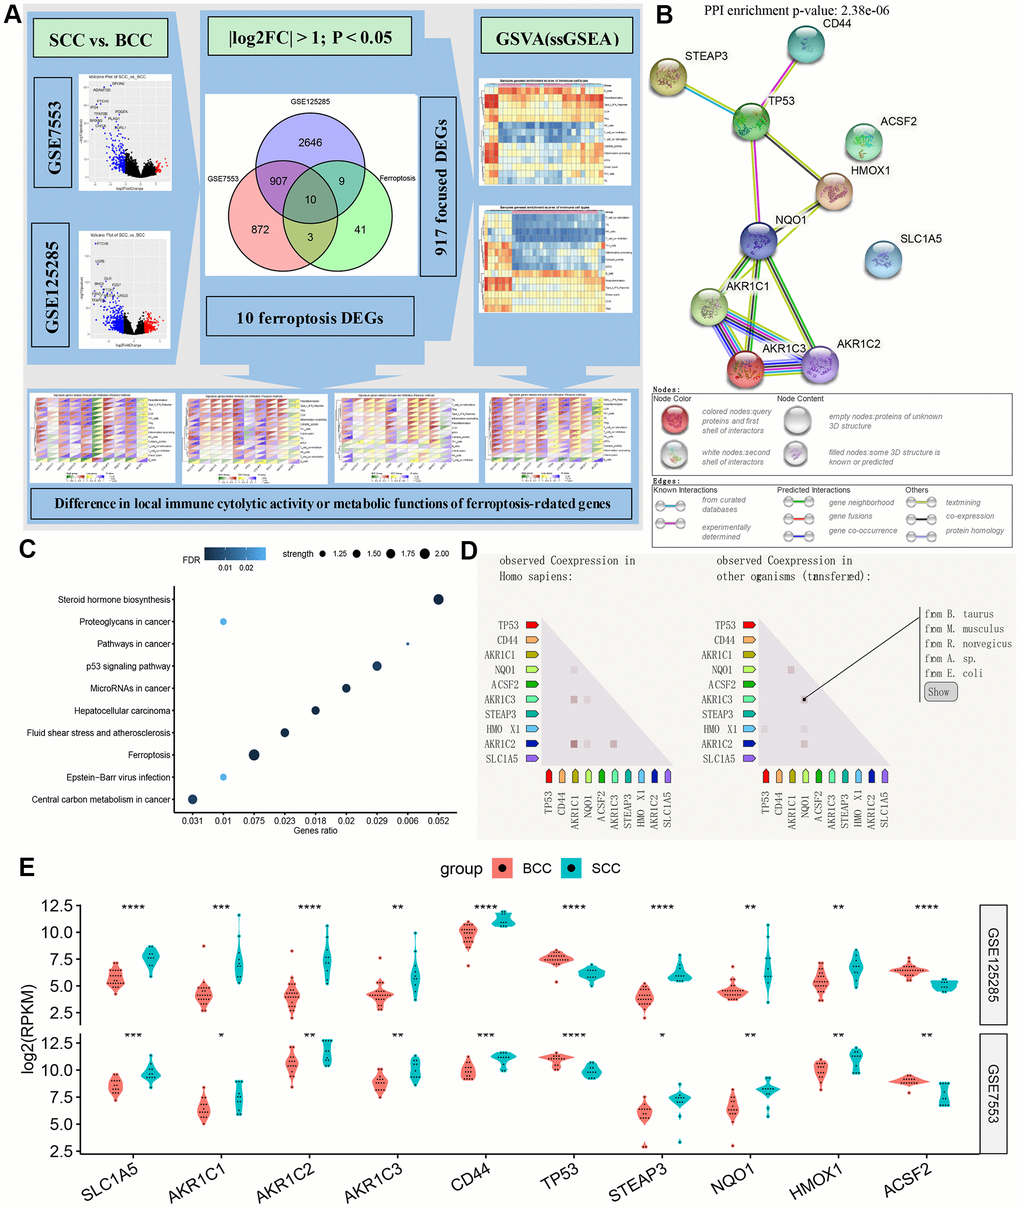
Figure 1. Overview of ferroptosis genes. (A) Flow chart of DEG gene set and iron death gene acquisition. (B–D) The protein-protein interaction network diagram, biological functions and (homologous) co-expression results of ferroptosis genes. (E) Differences in the expression of ferroptosis-related genes between BCC and SCC in the two data sets. (*P<0.05,**P<0.01, ***P<0.001, ****P<0.0001).
Functional enrichment differences of DEGs gene set
In the gene expression DEGs gene set of BCC and SCC, some typical biological signal pathways showed obvious differences (Supplementary Figure 1A). For example, the OSS of basal cell carcinoma, melanogenesis, endocytosis and WNT signaling pathway were higher in the BCC group than in the SCC group. On the contrary, the OSS of metabolic pathways and tightly junction were higher in the SCC group than in the BCC group. In addition, the GSEA results of DEGs gene set ranking score (fitted log2 (RPKM)) (Supplementary Figure 1B) also showed that the NES and P values of typical biological signaling pathways of BCC and SCC were significantly different. For example, in GSE7553 dataset, pathway “basal cell carcinoma” was significant only in the BCC group (P < 0.05), while “metabolic pathways” was significant only in the SCC group (P < 0.05). And in GSE125285 dataset, pathways “WNT signaling pathway”, “melanogenesis” and “basal cell carcinoma” were significant only in BCC group (P<0.05), while “endocytosis” was significant only in SCC group (P<0.05). To better describe the difference in the role of DEGs in the key biological signals of BCC and SCC, important KEGG pathway diagrams annotated by the gene expression level of the DEGs gene set were supplemented in attached file (Supplementary File 1).
Correlation of FRGs and LICA
As shown in Figure 2A, CD44, STEAP3, NQO1 and HMOX1 have significant positive correlation with immune cells (Treg) or function (CCR, Parainflammation and Type I IFN Response) in the BCC group. The gene SLC1A5 has a significant positive correlation with immune cells (NK cells) or function (Cytolytic activity) in the SCC group. However, the correlation results of other FRGs with immune cells or function are inconsistent in the two datasets. To further understand the relationship between FRGs expression level and LICA, based on the gene expression level in each FRG of the tumor tissue (BCC and SCC), the correlation results between each gene’s median expression level and the high versus low expression groups are shown in Figure 2B, which illustrated correlation results between these 10 FRGs and LICA from another perspective.
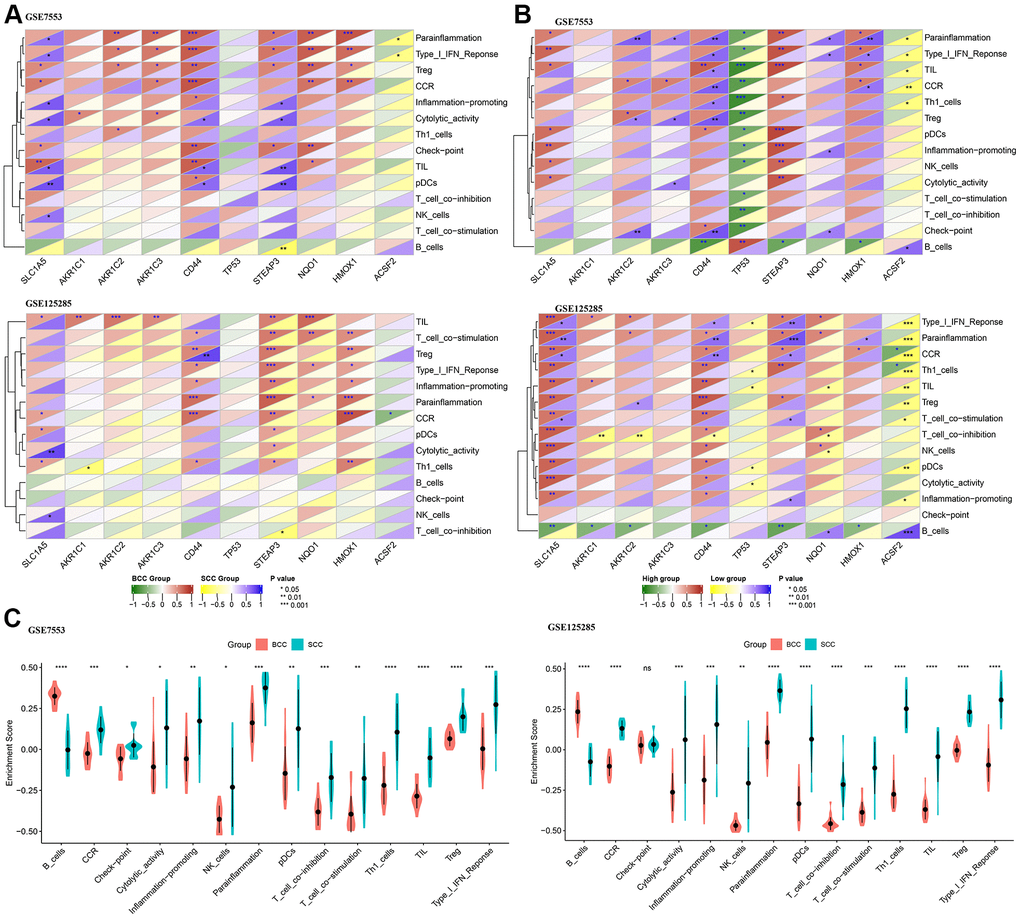
Figure 2. Correlation difference between ferroptosis genes and local immune cytolytic activity (LICA). (A) Difference in Pearson correlation of LICA and ferroptosis genes between BCC and SCC. (B) Difference in Pearson correlation of LICA and ferroptosis genes higher/lower expression level. (C) Comparison of LICA results between BCC and SCC. (*P<0.05,**P<0.01, ***P<0.001, ****P<0.0001).
Furthermore, by comparing the LICA enrichment results of BCC and SCC tissue samples (Figure 2C), only the local immune activity of B cells was significantly reduced in the SCC group, while other immune cells or function scores were significantly higher than those of the BCC group, such as cytolytic activity, tumor infiltrating lymphocytes (TIL), etc.
Correlation of FRGs and metabolic function of TME
Subsequently, the TME metabolic function differences between the BCC and SCC groups, and between the high versus low expression groups of FRGs were compared. As shown in Supplementary Figure 2A, lipid metabolism in the BCC group was significantly positively correlated with genes AKR1C2, AKR1C3, NQO1 and HMOX1 in both datasets. Such a relationship was also found in Supplementary Figure 2B, which was grouped by median of gene expression level. However, other ferroptosis gene-related metabolic functions presented inconsistent results between the two datasets. And the enrichment score of TME metabolic functions (except carbohydrate and TCA cycle) in the SCC group was significantly higher than that in the BCC group (Supplementary Figure 2C).
Difference in ccOSS
Finally, a ccOSS network model was constructed to compare the shared scores of each enrichment result, including the immune cells or function of LICA and the metabolic function of TME, in the overall sample set of BCC and SCC. As shown in Figure 3A, the network structure of most LICA results and the occupancy ratio of each node in the two datasets were almost the same, except for CCR, inflammation promoting, cytolytic activity and type I IFN response. Similar to the results obtained above, in the ccOSS network model diagram, we found that Treg and Parainflammation had higher occupancy rates in the SCC group, while NK cells, Th1 cell, T cell co- inhibition/stimulation, B cells and TIL had higher occupancy rates in BCC group.
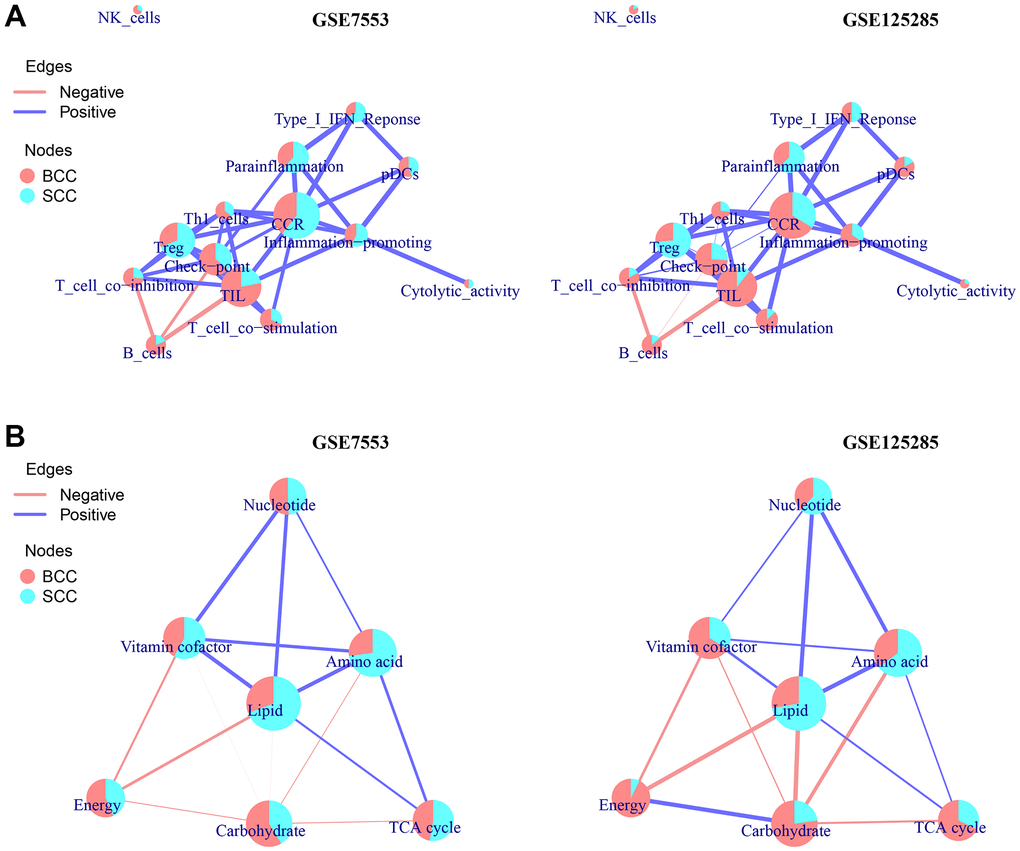
Figure 3. A network model of correlation-connected overall score share (ccOSS) of LICA and TME between BCC and SCC. (A, B) The ccOSS network interaction of BCC and SCC in LICA and TME enrichment results, respectively. (The connection of the node is determined by the shared genes in the node function, the size of the node is determined by the number of genes in the enriched gene set, and the overall score share (OSS) in node is calculated according to the formula
Similarly, in the TME functional network diagram (Figure 3B), in addition to vitamin cofactor and TCA cycle, nucleotide, amino acid and lipid metabolism had higher shared scores in the SCC group, while energy and carbohydrate metabolism had higher shared scores in the BCC group. Notably, we found that the enrichment results of KEGG, LICA and TME in adjacent normal tissues were significantly different from those in normal tissues (Supplementary Figure 3), and their shared scores in the ccOSS network diagram even exceeded that of BCC or SCC samples, which is why this study did not directly compare adjacent/normal tissues in the two datasets.
Difference of LICA in immune cell subsets
All of the above, LICA showed significant enrichment differences between BCC and SCC tissue samples. However, the disadvantage was that it is difficult to accurately described the important role of the cytolytic activity of immune cells on the TME due to the mixed cell types in tissue samples. Therefore, this study extracted the T cell populations (include 28554 cells) of BCC and SCC from a public scRNA-seq dataset (GSE123813). Then we classified T cell into 7 subsets according to the annotation results of the data provider (Figure 4A), including CD8 activation, CD8 exhaustion, CD8 memory, Naive, Tfh, Th17 and Treg. Subset-specific marker genes (Figure 4B) and a relative distance test of training progress at 100 iterations per cluster unit (Figure 4C) indicated that the T cell classificatory results were reliable and stable. Figure 4D lists the proportional distribution characteristics of T cell subsets in single cell samples of BCC and SCC.
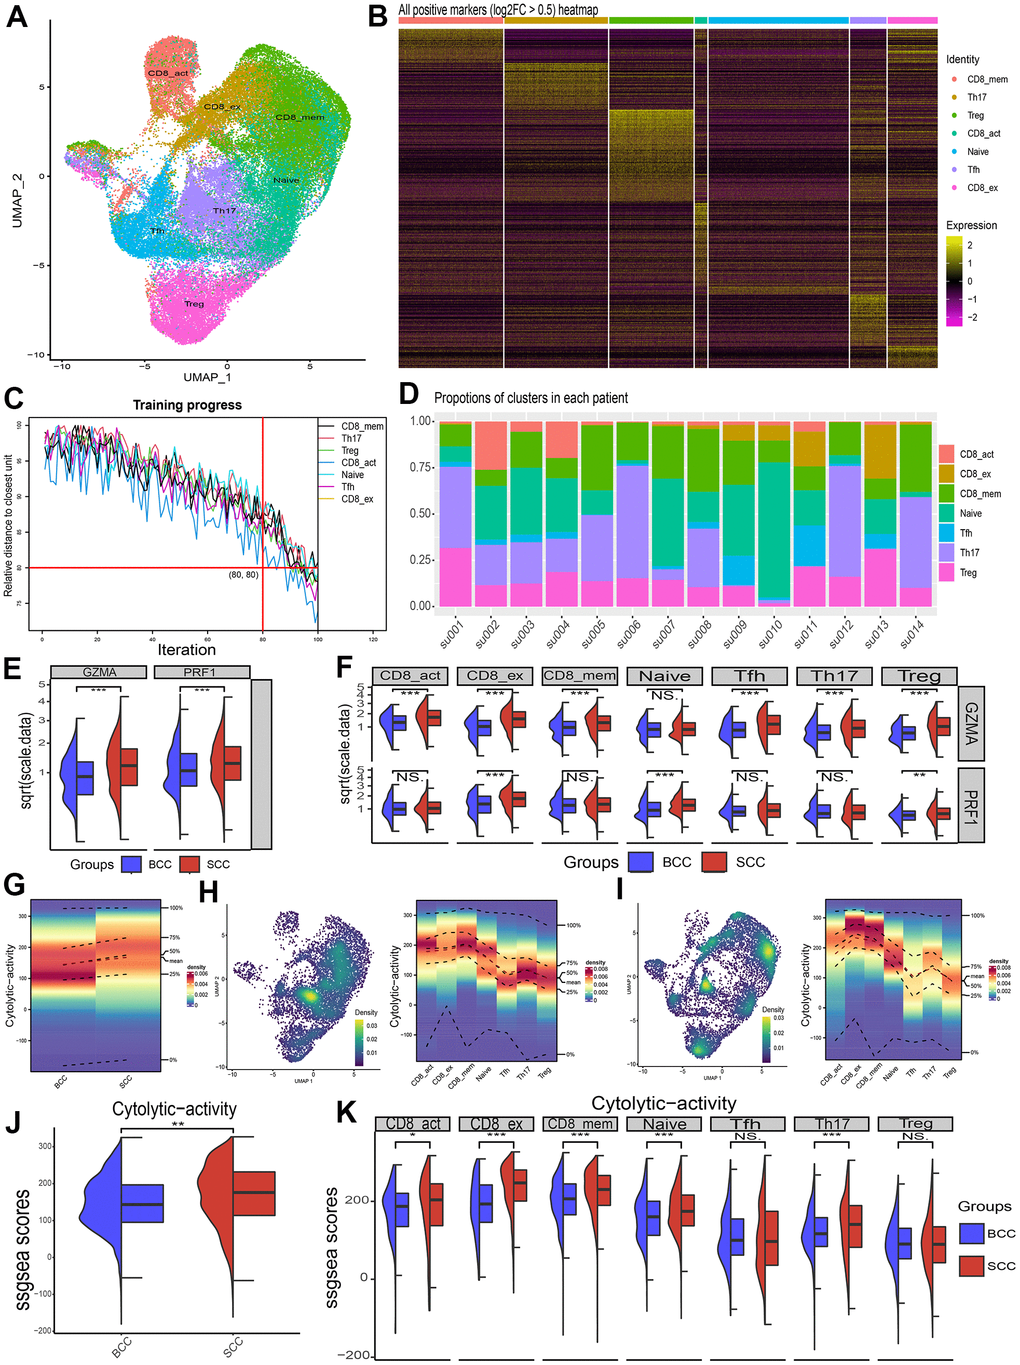
Figure 4. Differences in cytolytic activity of subpopulations of immune cells in single-cell samples from BCC and SCC patients. (A) Umap of T cell subpopulations’ distribution. (B) Heat map of relative expression of T cell subgroup-specific DEGs (p < 0.05, log2FC > 0.5). (C) Relative distance test of the training progress with 100 iterations of each cluster cells. (D) The proportion of T-cell subsets in each patient sample. (E, F) Differences in relative expression of the genes GZMA and PRF1 in BCC, SCC and T cell subpopulations. (G–I) Density profiles of cytolytic activity in BCC (H), SCC (I) and individual T cell subsets. (J, K) Wilcox test for differences in cytolytic activity of T cells and its subpopulations in BCC and SCC samples.
Afterwards, two key cytolytic effector genes, GZMA and RPF1, were found significantly higher in SCC than in BCC in T cell community (Figure 4E), and also in most T cell subsets (Figure 4F). Figures 4G–4I illustrated the density distribution (ssGSEA method) results of the cytolytic activity of BCC (H), SCC (I) and T cell subsets, respectively. Figures 4J, 4K illustrated the significant differences in T cell subsets between BCC and SCC through Wilcox test.
Discussion
To our knowledge, this study systematically investigated the differences in ferroptosis gene-related LICA and metabolic functions of TME in BCC and SCC for the first time. As listed above, this report not only obtained LICA (immune cell or function) and TME metabolic functions that were closely related to FRGs, and confirmed that the LICA of immune T cell in SCC was significantly higher than that in BCC.
The comparative results of ccOSS in this study showed that the metabolism of nucleotides, lipids and amino acids were more important in the SCC microenvironment. Among the 10 FRGs analyzed, the genes SLC1A5(alias ASCT2) and ACSF2 controlled amino acid transport [20] and fatty acid metabolism [21], respectively. Current studies on SLC1A5 in tumor cells have shown that increased SLC1A5 expression promotes glutamine dependence and antioxidant stress, affects the components of immune cell infiltration, and is associated with poor tumor prognosis [22–24]. Preclinical models have shown that pharmacological blockade of SLC1A5-dependent glutamine transport can exert anti-tumor effects [25]. Based on the existing evidence, SLC1A5 is an important target in the process of tumor cell progression, and new evidence shows that SLC1A5 inhibitors can provide considerable therapeutic effect for cancer treatment [26]. ACSF2 is a member of the Acyl-CoA synthetase family, mainly distributed in mitochondria and cytoplasm. It catalyzes the initial reaction in fatty acid metabolism by forming thioesters with CoA, and plays a role in adipocyte differentiation [21, 27, 28].
In addition, we noticed that energy metabolism was weakened in SCC. Therefore, we hypothesized a model of NQO1 homeostasis that regulates ROS function in the intracellular environment (Figure 5). NQO1 plays a key role in anti-oxidation (inhibiting ROS function) and stabilization of p53 [29, 30]. Loss of NQO1 regulation could induce p53 degradation and relax the restraint on ROS function. High levels of ROS may promote the adaptive survival of cancer cells and protect cancer cells from chemotherapeutic or cytotoxic treatments. These “super tumor cells” accelerate the progression of SCC and increase the malignancy of tumor. Currently, NQO1-mediated chemotherapy resistance has been confirmed in cholangiocarcinoma tumor cells [31], and the targeted metabolism drug KP372-1 mediated by NQO1 has effectively inhibited tumor growth in xenograft models [32].
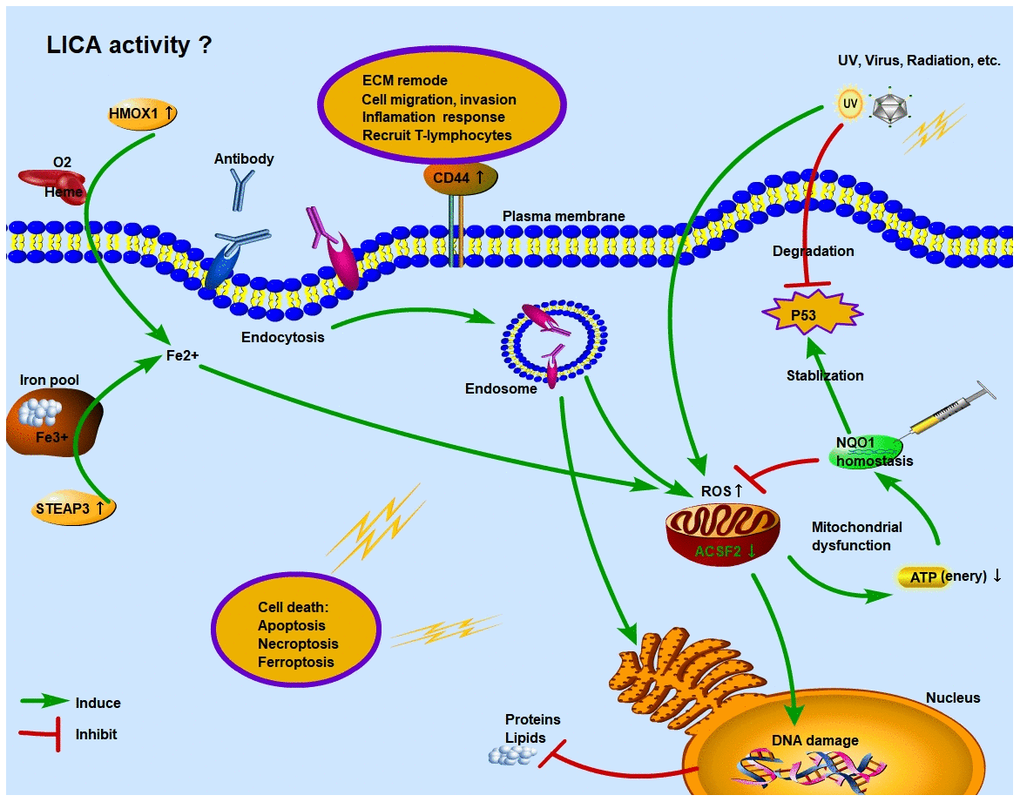
Figure 5. Schematic diagram of function regulation mode of ferroptosis genes in SCC. Under the stress of UV, virus or radioactive factors, normal cells lose the control of tumor suppressor gene TP53 and proliferate malignantly. At the same time, excessive activation of ROS function in the intracellular environment causes stress damage to mitochondria and endoplasmic reticulum. The imbalance of NQO1 homeostasis in SCC tumor cells cannot guarantee the stabilization of P53 and the inhibitory effect of ROS. Moreover, under immune surveillance, the cytolytic activity of local immune cells is enhanced, and endocytosis is formed through antigen-antibody binding, which further induces cancer cells undergo apoptosis or necrosis. However, in the early stage, under the regulation of NQO1 homeostasis, some cancer cells adapt to the higher ROS environment. These “super tumor cells” accelerate the progression of SCC and increase the degree of malignancy. Ferroptosis is a process of cell necrosis catalyzed by iron. When a large amount of Fe2+ accumulates in the intracellular environment, it will synergistically increase the function of ROS. The overactivation of HMOX1 and STEAP3 increase Fe2+ levels through Heme and iron pool, respectively.
As we found above, two FRGs, HMOX1 and STEAP3, were significantly upregulated in SCC tissues, both of which could promote Fe3+ to Fe2+ transformation [33, 34] (Figure 5). And FPI was significantly higher in SCC tissues than in BCC and adjacent/normal tissues, as a result, we compared the relationship between ferroptosis and BCC or SCC. Excessive expression of HMOX1 can catalyze the degradation of heme to Fe2+, biliverdin and carbon monoxide, and ferroptosis sensitivity also changes during the process of lipid peroxidation [35]. Excessive expression of STEAP3 is the culprit in releasing Fe3+ from the intracellular iron pool [36], and its metal reduction function further increases the concentration of Fe2+ in intracellular environment. Therefore, under the synergistic effect of HMOX1 and STEAP3, the increased concentration of Fe2+ in intracellular environment causes the imbalance of iron homeostasis, and its participation in free radicals and lipid peroxidation promotes the occurrence of cell ferroptosis.
Tumor cell metabolic dysfunction also alters the immune and inflammatory responses. CD44, an upregulated FRG in SCC, is highly correlated with immune function in this study, and plays an important role in biological processes such as inflammation response, extracellular matrix remodeling, and tumor cell invasion and metastasis, and EMT [37–40]. At present, tumor suppression therapy targeting CD44 can inhibit tumor angiogenesis and cell metastasis [41, 42], and protect cells from ROS damage by activating downstream MAPK signals [43]. Over-expressed CD44 has a positive regulatory relationship with LICA immune cells and functions (Treg, TIL, Th1 cells, etc.) in SCC tissues. Therefore, CD44 is of great significance as a targeted therapy for SCC metastasis and drug resistance.
Significantly different from SCC, the results of LICA, TME and ROS function enrichment in BCC tissues were very close to those in adjacent/normal tissues (Supplementary Figure 4A, 4B, 4D), and the expression levels of 8 genes out of the 10 FRGs were lower than those in adjacent/normal tissues (Supplementary Figure 4C). This outcome prompted us to further investigate the reasons behind it, but the results revealed some shortcomings in this study that should not be ignored. In both of the two GSE dataset and related literature, the time and status of the patient’s BCC and SCC tissue acquisition (e.g., whether chemotherapy or targeted therapy was received) are not provided, which was critical to our discussion of the hypothetical NQO1 homeostasis model. Moreover, in both datasets, the expression of NQO1 in SCC did not significantly increased or decreased compared with that in adjacent/normal tissues (Supplementary Figure 4C), but it was significantly decreased in BCC than in normal tissues (not adjacent normal tissues). Unfortunately, when we contacted the authors of these datasets, we got no response.
In conclusion, under the protective effects of cellular immune surveillance, NQO1 homeostasis and iron homeostasis, most damaged cells undergo natural apoptosis or necrosis, but those “super tumor cells” must be cleared in time through reasonable treatments to avoid deterioration and metastasis. Therefore, the potential target FRGs, SLC1A5, CD44 and NQO1, for tumor resistance treatment have important research value in the treatment of SCC drug resistance. In vitro and preclinical trials should be carried out in the future to further evaluate the therapeutic effect of these gene targets.
Date availability statement
The data that support the findings of this study are available from the Gene Expression Omnibus database. Bulk RNA-seq datasets (GSE7553 and GSE125285) and single-cell RNA dataset (GSE123813). Complete analysis code was deposited in the platform of gitee (https://gitee.com/plainTHS/bscc).
Author Contributions
Conceptualization and Writing: JQ W and D X. Data collection, analysis and visualization: JQ W, HG W and YC L. Review and editing: JQ W and CW. All authors approved the final manuscript.
Acknowledgments
We appreciate the authors (Riker AI, Wan J and Yost KE) for sharing their original datasets.
Conflicts of Interest
The authors declare that they have no conflicts of interest.
Funding
This work was supported by the National Natural Science Foundation of China (No. 81860484) and the Natural Science Foundation of Jiangxi Province of China (No. 20202BABL206107).
References
- 1. Pasparakis M, Vandenabeele P. Necroptosis and its role in inflammation. Nature. 2015; 517:311–20. https://doi.org/10.1038/nature14191 [PubMed]
- 2. Krysko O, Aaes TL, Kagan VE, D’Herde K, Bachert C, Leybaert L, Vandenabeele P, Krysko DV. Necroptotic cell death in anti-cancer therapy. Immunol Rev. 2017; 280:207–19. https://doi.org/10.1111/imr.12583 [PubMed]
- 3. Fujihara KM, Zhang BZ, Clemons NJ. Opportunities for Ferroptosis in Cancer Therapy. Antioxidants (Basel). 2021; 10:986. https://doi.org/10.3390/antiox10060986 [PubMed]
- 4. Hassannia B, Vandenabeele P, Vanden Berghe T. Targeting Ferroptosis to Iron Out Cancer. Cancer Cell. 2019; 35:830–49. https://doi.org/10.1016/j.ccell.2019.04.002 [PubMed]
- 5. Yang WS, Stockwell BR. Ferroptosis: Death by Lipid Peroxidation. Trends Cell Biol. 2016; 26:165–76. https://doi.org/10.1016/j.tcb.2015.10.014 [PubMed]
- 6. Liang JY, Wang DS, Lin HC, Chen XX, Yang H, Zheng Y, Li YH. A Novel Ferroptosis-related Gene Signature for Overall Survival Prediction in Patients with Hepatocellular Carcinoma. Int J Biol Sci. 2020; 16:2430–41. https://doi.org/10.7150/ijbs.45050 [PubMed]
- 7. Wu G, Wang Q, Xu Y, Li Q, Cheng L. A new survival model based on ferroptosis-related genes for prognostic prediction in clear cell renal cell carcinoma. Aging (Albany NY). 2020; 12:14933–48. https://doi.org/10.18632/aging.103553 [PubMed]
- 8. Liu Z, Zhao Q, Zuo ZX, Yuan SQ, Yu K, Zhang Q, Zhang X, Sheng H, Ju HQ, Cheng H, Wang F, Xu RH, Liu ZX. Systematic Analysis of the Aberrances and Functional Implications of Ferroptosis in Cancer. iScience. 2020; 23:101302. https://doi.org/10.1016/j.isci.2020.101302 [PubMed]
- 9. Friedmann Angeli JP, Krysko DV, Conrad M. Ferroptosis at the crossroads of cancer-acquired drug resistance and immune evasion. Nat Rev Cancer. 2019; 19:405–14. https://doi.org/10.1038/s41568-019-0149-1 [PubMed]
- 10. Wang W, Green M, Choi JE, Gijón M, Kennedy PD, Johnson JK, Liao P, Lang X, Kryczek I, Sell A, Xia H, Zhou J, Li G, et al. CD8+ T cells regulate tumour ferroptosis during cancer immunotherapy. Nature. 2019; 569:270–4. https://doi.org/10.1038/s41586-019-1170-y [PubMed]
- 11. Riker AI, Enkemann SA, Fodstad O, Liu S, Ren S, Morris C, Xi Y, Howell P, Metge B, Samant RS, Shevde LA, Li W, Eschrich S, et al. The gene expression profiles of primary and metastatic melanoma yields a transition point of tumor progression and metastasis. BMC Med Genomics. 2008; 1:13. https://doi.org/10.1186/1755-8794-1-13 [PubMed]
- 12. Wan J, Dai H, Zhang X, Liu S, Lin Y, Somani AK, Xie J, Han J. Distinct transcriptomic landscapes of cutaneous basal cell carcinomas and squamous cell carcinomas. Genes Dis. 2019; 8:181–92. https://doi.org/10.1016/j.gendis.2019.10.004 [PubMed]
- 13. Yost KE, Satpathy AT, Wells DK, Qi Y, Wang C, Kageyama R, McNamara KL, Granja JM, Sarin KY, Brown RA, Gupta RK, Curtis C, Bucktrout SL, et al. Clonal replacement of tumor-specific T cells following PD-1 blockade. Nat Med. 2019; 25:1251–9. https://doi.org/10.1038/s41591-019-0522-3 [PubMed]
- 14. Rooney MS, Shukla SA, Wu CJ, Getz G, Hacohen N. Molecular and genetic properties of tumors associated with local immune cytolytic activity. Cell. 2015; 160:48–61. https://doi.org/10.1016/j.cell.2014.12.033 [PubMed]
- 15. Peng X, Chen Z, Farshidfar F, Xu X, Lorenzi PL, Wang Y, Cheng F, Tan L, Mojumdar K, Du D, Ge Z, Li J, Thomas GV, et al, and Cancer Genome Atlas Research Network. Molecular Characterization and Clinical Relevance of Metabolic Expression Subtypes in Human Cancers. Cell Rep. 2018; 23:255–69.e4. https://doi.org/10.1016/j.celrep.2018.03.077 [PubMed]
- 16. Cao JY, Dixon SJ. Mechanisms of ferroptosis. Cell Mol Life Sci. 2016; 73:2195–209. https://doi.org/10.1007/s00018-016-2194-1 [PubMed]
- 17. Liberzon A, Birger C, Thorvaldsdóttir H, Ghandi M, Mesirov JP, Tamayo P. The Molecular Signatures Database (MSigDB) hallmark gene set collection. Cell Syst. 2015; 1:417–25. https://doi.org/10.1016/j.cels.2015.12.004 [PubMed]
- 18. Hao Y, Hao S, Andersen-Nissen E, Mauck WM 3rd, Zheng S, Butler A, Lee MJ, Wilk AJ, Darby C, Zager M, Hoffman P, Stoeckius M, Papalexi E, et al. Integrated analysis of multimodal single-cell data. Cell. 2021; 184:3573–87.e29. https://doi.org/10.1016/j.cell.2021.04.048 [PubMed]
- 19. Hänzelmann S, Castelo R, Guinney J. GSVA: gene set variation analysis for microarray and RNA-seq data. BMC Bioinformatics. 2013; 14:7. https://doi.org/10.1186/1471-2105-14-7 [PubMed]
- 20. Garaeva AA, Oostergetel GT, Gati C, Guskov A, Paulino C, Slotboom DJ. Cryo-EM structure of the human neutral amino acid transporter ASCT2. Nat Struct Mol Biol. 2018; 25:515–21. https://doi.org/10.1038/s41594-018-0076-y [PubMed]
- 21. Watkins PA, Maiguel D, Jia Z, Pevsner J. Evidence for 26 distinct acyl-coenzyme A synthetase genes in the human genome. J Lipid Res. 2007; 48:2736–50. https://doi.org/10.1194/jlr.M700378-JLR200 [PubMed]
- 22. van Geldermalsen M, Wang Q, Nagarajah R, Marshall AD, Thoeng A, Gao D, Ritchie W, Feng Y, Bailey CG, Deng N, Harvey K, Beith JM, Selinger CI, et al. ASCT2/SLC1A5 controls glutamine uptake and tumour growth in triple-negative basal-like breast cancer. Oncogene. 2016; 35:3201–8. https://doi.org/10.1038/onc.2015.381 [PubMed]
- 23. Ni F, Yu WM, Li Z, Graham DK, Jin L, Kang S, Rossi MR, Li S, Broxmeyer HE, Qu CK. Critical role of ASCT2-mediated amino acid metabolism in promoting leukaemia development and progression. Nat Metab. 2019; 1:390–403. https://doi.org/10.1038/s42255-019-0039-6 [PubMed]
- 24. Zhang Z, Liu R, Shuai Y, Huang Y, Jin R, Wang X, Luo J. ASCT2 (SLC1A5)-dependent glutamine uptake is involved in the progression of head and neck squamous cell carcinoma. Br J Cancer. 2020; 122:82–93. https://doi.org/10.1038/s41416-019-0637-9 [PubMed]
- 25. Schulte ML, Fu A, Zhao P, Li J, Geng L, Smith ST, Kondo J, Coffey RJ, Johnson MO, Rathmell JC, Sharick JT, Skala MC, Smith JA, et al. Pharmacological blockade of ASCT2-dependent glutamine transport leads to antitumor efficacy in preclinical models. Nat Med. 2018; 24:194–202. https://doi.org/10.1038/nm.4464 [PubMed]
- 26. Jiang H, Zhang N, Tang T, Feng F, Sun H, Qu W. Target the human Alanine/Serine/Cysteine Transporter 2(ASCT2): Achievement and Future for Novel Cancer Therapy. Pharmacol Res. 2020; 158:104844. https://doi.org/10.1016/j.phrs.2020.104844 [PubMed]
- 27. Chen L, Vasoya RP, Toke NH, Parthasarathy A, Luo S, Chiles E, Flores J, Gao N, Bonder EM, Su X, Verzi MP. HNF4 Regulates Fatty Acid Oxidation and Is Required for Renewal of Intestinal Stem Cells in Mice. Gastroenterology. 2020; 158:985–99.e9. https://doi.org/10.1053/j.gastro.2019.11.031 [PubMed]
- 28. Perera RJ, Marcusson EG, Koo S, Kang X, Kim Y, White N, Dean NM. Identification of novel PPARgamma target genes in primary human adipocytes. Gene. 2006; 369:90–9. https://doi.org/10.1016/j.gene.2005.10.021 [PubMed]
- 29. Patiño-Morales CC, Soto-Reyes E, Arechaga-Ocampo E, Ortiz-Sánchez E, Antonio-Véjar V, Pedraza-Chaverri J, García-Carrancá A. Curcumin stabilizes p53 by interaction with NAD(P)H:quinone oxidoreductase 1 in tumor-derived cell lines. Redox Biol. 2020; 28:101320. https://doi.org/10.1016/j.redox.2019.101320 [PubMed]
- 30. Li X, Liu Z, Zhang A, Han C, Shen A, Jiang L, Boothman DA, Qiao J, Wang Y, Huang X, Fu YX. NQO1 targeting prodrug triggers innate sensing to overcome checkpoint blockade resistance. Nat Commun. 2019; 10:3251. https://doi.org/10.1038/s41467-019-11238-1 [PubMed]
- 31. Zeekpudsa P, Kukongviriyapan V, Senggunprai L, Sripa B, Prawan A. Suppression of NAD(P)H-quinone oxidoreductase 1 enhanced the susceptibility of cholangiocarcinoma cells to chemotherapeutic agents. J Exp Clin Cancer Res. 2014; 33:11. https://doi.org/10.1186/1756-9966-33-11 [PubMed]
- 32. Zhao Y, Hu Q, Cheng F, Su N, Wang A, Zou Y, Hu H, Chen X, Zhou HM, Huang X, Yang K, Zhu Q, Wang X, et al. SoNar, a Highly Responsive NAD+/NADH Sensor, Allows High-Throughput Metabolic Screening of Anti-tumor Agents. Cell Metab. 2015; 21:777–89. https://doi.org/10.1016/j.cmet.2015.04.009 [PubMed]
- 33. Travassos LH, Vasconcellos LR, Bozza MT, Carneiro LA. Heme and iron induce protein aggregation. Autophagy. 2017; 13:625–6. https://doi.org/10.1080/15548627.2016.1271515 [PubMed]
- 34. Sendamarai AK, Ohgami RS, Fleming MD, Lawrence CM. Structure of the membrane proximal oxidoreductase domain of human Steap3, the dominant ferrireductase of the erythroid transferrin cycle. Proc Natl Acad Sci USA. 2008; 105:7410–5. https://doi.org/10.1073/pnas.0801318105 [PubMed]
- 35. Hassannia B, Wiernicki B, Ingold I, Qu F, Van Herck S, Tyurina YY, Bayır H, Abhari BA, Angeli JP, Choi SM, Meul E, Heyninck K, Declerck K, et al. Nano-targeted induction of dual ferroptotic mechanisms eradicates high-risk neuroblastoma. J Clin Invest. 2018; 128:3341–55. https://doi.org/10.1172/JCI99032 [PubMed]
- 36. Zhang F, Tao Y, Zhang Z, Guo X, An P, Shen Y, Wu Q, Yu Y, Wang F. Metalloreductase Steap3 coordinates the regulation of iron homeostasis and inflammatory responses. Haematologica. 2012; 97:1826–35. https://doi.org/10.3324/haematol.2012.063974 [PubMed]
- 37. Chen C, Zhao S, Karnad A, Freeman JW. The biology and role of CD44 in cancer progression: therapeutic implications. J Hematol Oncol. 2018; 11:64. https://doi.org/10.1186/s13045-018-0605-5 [PubMed]
- 38. Naor D, Nedvetzki S, Golan I, Melnik L, Faitelson Y. CD44 in cancer. Crit Rev Clin Lab Sci. 2002; 39:527–79. https://doi.org/10.1080/10408360290795574 [PubMed]
- 39. Jothy S. CD44 and its partners in metastasis. Clin Exp Metastasis. 2003; 20:195–201. https://doi.org/10.1023/a:1022931016285 [PubMed]
- 40. Milosevic M, Lazarevic M, Toljic B, Simonovic J, Trisic D, Nikolic N, Petrovic M, Milasin J. Characterization of stem-like cancer cells in basal cell carcinoma and its surgical margins. Exp Dermatol. 2018; 27:1160–5. https://doi.org/10.1111/exd.13755 [PubMed]
- 41. Orian-Rousseau V. CD44, a therapeutic target for metastasising tumours. Eur J Cancer. 2010; 46:1271–7. https://doi.org/10.1016/j.ejca.2010.02.024 [PubMed]
- 42. Orian-Rousseau V, Ponta H. Perspectives of CD44 targeting therapies. Arch Toxicol. 2015; 89:3–14. https://doi.org/10.1007/s00204-014-1424-2 [PubMed]
- 43. Ishimoto T, Nagano O, Yae T, Tamada M, Motohara T, Oshima H, Oshima M, Ikeda T, Asaba R, Yagi H, Masuko T, Shimizu T, Ishikawa T, et al. CD44 variant regulates redox status in cancer cells by stabilizing the xCT subunit of system xc(-) and thereby promotes tumor growth. Cancer Cell. 2011; 19:387–400. https://doi.org/10.1016/j.ccr.2011.01.038 [PubMed]