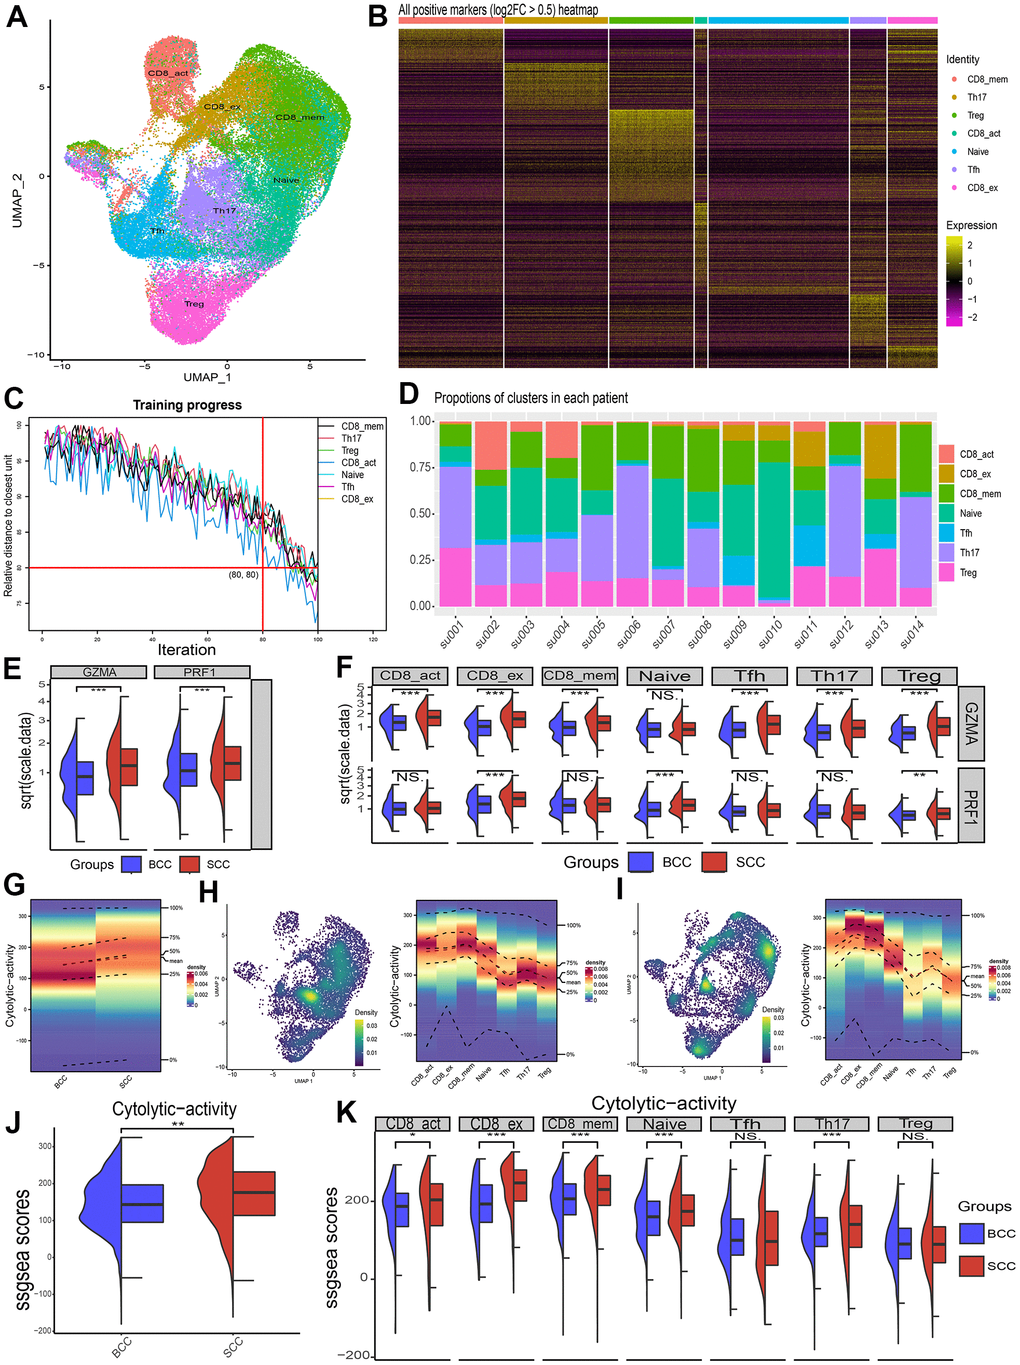
Figure 4.Differences in cytolytic activity of subpopulations of immune cells in single-cell samples from BCC and SCC patients. (A) Umap of T cell subpopulations’ distribution. (B) Heat map of relative expression of T cell subgroup-specific DEGs (p < 0.05, log2FC > 0.5). (C) Relative distance test of the training progress with 100 iterations of each cluster cells. (D) The proportion of T-cell subsets in each patient sample. (E, F) Differences in relative expression of the genes GZMA and PRF1 in BCC, SCC and T cell subpopulations. (G–I) Density profiles of cytolytic activity in BCC (H), SCC (I) and individual T cell subsets. (J, K) Wilcox test for differences in cytolytic activity of T cells and its subpopulations in BCC and SCC samples.