


Introduction
The tear film is an optical refractive interface covering the outermost ocular surface and is composed of lipids, mucins and electrolytes [1]. Dry eye (DE) is a multi-factorial disease in which the tear film loses stability. Tear film instability leads to increased aberrations and scattering in higher-order aberrations, thus reducing visual quality [2]. In addition, patients with DE may experience pain, burning, itching, dryness [3], persistent tear deficiency and a combination of long-term chronic inflammation, peripheral nerve injury and ocular inflammation, presenting as chronic neuropathic pain [4]. However, symptoms of DE may be severe and unaccompanied by equivalent signs.
The mechanism of DE disease has not been fully explained. Chronic inflammation has been viewed as its central mechanism but a more recent definition [5, 6] suggests that it is caused by inflammation induced by the hypertonic tear film, neurogenic stress response, and neurosensory abnormalities. These reactions further promote inflammatory damage to the ocular surface and glands, affect the generation of blood vessels and lymphatics, and aggravate inflammatory reactions, leading to a vicious cycle of inflammation. As 2017 International Dry Eye Workshop II (DEWS II) defined, neurosensory abnormalities” was included in the definition of DE for the first time [7]. A growing number of studies suggest that neuropathic symptoms are associated emotional disorders in dry eye. Nervous anxiety is a normal reaction to stimuli such as inflammation, and neurological symptoms can result from somatic neuropathy or somatosensory irritation of the cornea or conjunctiva. Sympathetic and parasympathetic nerve endings secrete neurotransmitters which participate in the maintenance of ocular surface homeostasis and regulate tear secretion. Corneal nerve fibers originate from the trigeminal nerve, the sensory nucleus of which receives afferent nerve signals from the cornea or conjunctiva. These signals are transmitted to the salivary nucleus on the brain stem, exciting the parasympathetic nerve that innervates the lacrimal gland, and stimulating it to secrete the aqueous component of the tears [8]. So abnormal neuroregulation can lead to abnormal tear secretion.
Diffusion tensor imaging (DTI) is a new functional magnetic resonance imaging (fMRI)-based technology which has the advantage of capturing images of white matter, and is the most commonly used non-invasive method to study brain tissue. DTI has been widely used to investigate a range of mental or neural illness, such as schizophrenia [9], Alzheimer’s disease [10], multiple sclerosis [11] and depression [12]. Many studies have shown that neuropsychiatric diseases are accompanied by white matter abnormality, providing insights into the pathogenesis and pathological mechanism of the disease. NODDI is an imaging method which allows evaluation of nerve axon and dendrite structure. Compared with DTI, NODDI may more accurately reflect water molecule diffusion within the tissue microenvironment and may therefore better reflect brain development and a variety of neurological diseases.
Our previous studies [13–15] found that some ophthalmic diseases can cause brain regional changes. Using fMRI, researchers found that DE may lead to dysfunction of specific brain regions [16]. Similarly, studies have suggested that abnormal regional homogeneity of the limb-cortical circuit in patients with DE, and this dysfunction may be related to the pathological mechanism of DE [17]. Abnormality of this kind may explain cognitive impairment, psychiatric symptoms and depressive mood in patients with DE. White matter nerve fiber bundles are fundamental to signal transmission in many chronic diseases and are damaged in brain disorders. No research has investigated whether white matter nerve fiber bundles are damaged in DE, so this study aims to determine whether white matter is abnormal in DE patients, using DTI and NODDI, and to increase understanding of the pathophysiology of DE.
Methods
Participants
Subjects
The subjects from the First Affiliated Hospital of Nanchang University will be divided into two groups. Diagnosis of DE based on the expert consensus on clinical diagnosis and treatment of dry eye [18], Participants were selected as a patient group (PAT) if they had DE symptoms (OSDI ≥ 13) and at least one eye meeting the following criteria: Non-Invasive Keratograph Break-Up Time (NIKBUT) <10 s; tear osmolarity ≥308 mOsm/L; corneal fluorescein staining >5 spots; conjunctival lissamine green staining >9 spots; lid margin staining ≥2 mm length and/or ≥25% sagittal width, and healthy subjects were included in a control group (HC). Age (years), sex, weight (kg), handedness, duration of DE (months), and monocular best-corrected visual acuity were recorded. This study was conducted with the approval of the Hospital ethics committee, and declarations of informed consent were signed by all participants.
Inclusion criteria
(1) Presence of at least two of the following symptoms: burning, itching, foreign body sensation, blurred vision, photophobia; (2) Age between 20 and 65; (3) No local or systemic use of any drugs in the preceding 2 weeks.
Exclusion criteria
(1) Diagnosis of rheumatoid arthritis, Sjogren’s syndrome or other systemic immune diseases; (2) Local or systemic glucocorticoids, immunosuppressants and other drugs used within 1 week preceding treatment; (3) History of ophthalmic surgery; (4) History of neurological diseases and other serious systemic diseases; (5) History of conjunctival, corneal or iris disease.
MRI data acquisition
Image processing
Data preprocessing
FMRIB (FSL) (http://www.fmrib.ox.ac.uk/fsl) was used to preprocess MRI data. After the original DICOM data were transferred into NIfTI format using MRIcron software, the DTI data were vortex-corrected by FMRIB to align the data to the B = 0 image. Magnetic field heterogeneity, head movement artifacts and scalp and skull images were removed. The Matlab NODDI toolbox (UCL, UK) (http://nitrc.org/projects/noddi_tolbox) was used for computation and fitting of the NODDI microstructure model. The NODDI index obtained by fitting includes isotropic volume fraction (FISO), intra-cellular volume fraction (FICVF), and orientation dispersion index (ODI).The FSL toolkit FDT3.0 (http://fsl.fmrib.ox.ac.uk/fsl/fslwiki/FTD) was applied to generate various diffusion tensor parameters and obtain values of fractional anisotropy (FA), axial diffusivity (AD) and radial diffusivity (RD).
Data analysis
The difference between the DE group and HC group was calculated using the tract-based spatial statistics (TBSS) method, and the FA data were preprocessed. The FA graphs of data from subjects in the two groups were registered to the standard FMRIB template and converted to the standard Montreal Neurological Institute 152(MNI152) space (1 × 1 × 1 mm3). The FA skeleton was generated in the standard space, reflecting the distribution of the main white matter fiber bundles in each group. The average FA images of all participants were projected onto FMRIB58_FA to obtain the average FA skeleton. The specific fiber bundles were determined using The Johns Hopkins University (JHU) standard.
Based on the threshold-free clustering enhancement (TFCE) statistical image, the voxel random arrangement comparison test of HC and PAT (5000 permutations) was carried out in FSL. The statistical threshold value p < 0.05 was set in all statistical graphs, and the family error was corrected ( FWE).Subsequently, the other DTI and NODDI values of this study, namely AD, RD, FISO, FICVF and ODI values, were analyzed in the same way as FA between groups.
The questionnaire
The hospital anxiety and depression scale (HADS) measures symptoms of anxiety and depression by asking patients about their symptoms in the previous week. HADS consists of the anxiety subscale measuring anxiety and the depression subscale measuring depressive symptoms. Each subscale has 7 items with a score range of 0 to 21, and each item has 4 options with a score of 0 to 3. Criteria: 0–7 normal, 8–11 possible presence of anxiety and depression, ≥11 mood disorders may exist [19].
Statistical analysis
This study used SPSS 25.0 statistical analysis software. The independent samples T-test was used to compare the demographic and clinical parameters of two groups and p-values < 0.05 were considered statistically significant. Receiver operating characteristic curve (ROC) curve analysis was used to distinguish the DTI and NODDI values of different white matter areas of the brain in PAT, and the area under the curve (AUC), sensitivity and specificity were obtained. Pearson’s correlation was used to assess the relationship between DTI and NODDI values and AS and DS values.
Ethical approval and consent to participate
The study methods and protocols were approved by the Medical Ethics Committee of the First Affiliated Hospital of Nanchang University (Nanchang, China) and followed the principles of the Declaration of Helsinki. All subjects were notified of the objectives and content of the study and latent risks, and then provided written informed consent to participate.
Availability of data and materials
The datasets used and/or analyzed during the present study are available from the corresponding author on reasonable request.
Results
Demographic information
No significant differences were found between the groups in body weight (p = 0.853) or age (p = 0.873), while differences were found in monocular BCVA (right p = 0.122; left p = 0.163). Both groups were right-handed. Details are presented in Table 1.
Table 1. Basic information of participants in the study.
| Condition | DE | HCs | t | P-value* | |||||||||||||||||||||||||||||||||||||||||||||||||||||||||||||||||||||||||||||||||||||||||||||||
| Male/Female | 7/18 | 7/18 | N/A | >0.99 | |||||||||||||||||||||||||||||||||||||||||||||||||||||||||||||||||||||||||||||||||||||||||||||||
| Age (years) | 55.68 ± 8.73 | 56.29 ± 6.82 | 0.272 | 0.873 | |||||||||||||||||||||||||||||||||||||||||||||||||||||||||||||||||||||||||||||||||||||||||||||||
| Weight (kg) | 56.92 ± 8.59 | 57.19 ± 9.16 | 0.216 | 0.853 | |||||||||||||||||||||||||||||||||||||||||||||||||||||||||||||||||||||||||||||||||||||||||||||||
| Handedness | 25R | 25R | N/A | >0.99 | |||||||||||||||||||||||||||||||||||||||||||||||||||||||||||||||||||||||||||||||||||||||||||||||
| Duration of DE (mons) | 10.72 ± 3.86 | N/A | N/A | N/A | |||||||||||||||||||||||||||||||||||||||||||||||||||||||||||||||||||||||||||||||||||||||||||||||
| Best-corrected VA-left eye | 0.94 ± 0.36 | 1.12 ± 0.19 | −0.915 | 0.163 | |||||||||||||||||||||||||||||||||||||||||||||||||||||||||||||||||||||||||||||||||||||||||||||||
| Best-corrected VA-right eye | 0.91 ± 0.43 | 1.09 ± 0.22 | −0.987 | 0.122 | |||||||||||||||||||||||||||||||||||||||||||||||||||||||||||||||||||||||||||||||||||||||||||||||
| Independent t-tests comparing two groups (p < 0.05). Abbreviations: HCs: healthy controls; N/A: not applicable; DE: dry eye; VA: visual acuity. | |||||||||||||||||||||||||||||||||||||||||||||||||||||||||||||||||||||||||||||||||||||||||||||||||||
DTI differences
Compared with the HC, the FA value of PAT was significantly lower in the left superior longitudinal fasciculus (LSLF) and corpus callosum (CC) (Figure 1A (blue) and Table 2). Higher DTI values in the brain areas were the LSLF (MD), right posterior limb of the internal capsule (MD), the right posterior thalamic radiation (MD), the genu of CC (AD), right posterior limb of internal capsule (AD) and right splenium of the CC (AD) (Figure 1A (red) and Table 2). The ROI signal values of the two groups were shown in Figure 1B–1D.
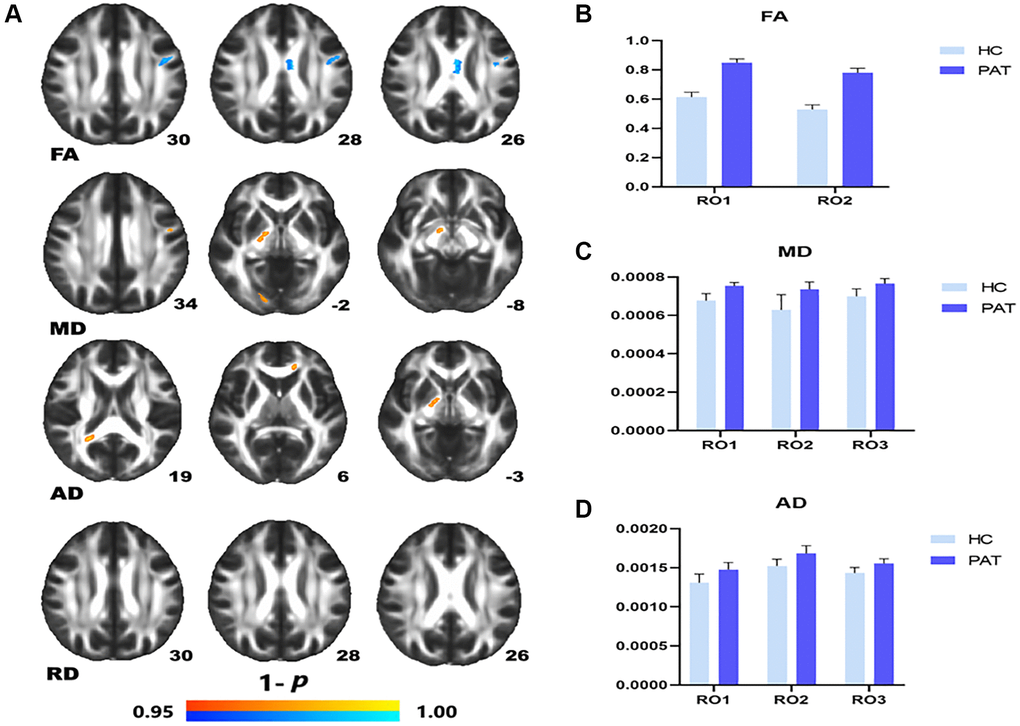
Figure 1. Comparison of DTI value of HC and PAT group. Mean DTI values between PAT and HC groups (A–C). (A) ROI1-left superior longitudinal fasciculus; ROI2-body of corpus callosum. (B) ROI1-left superior longitudinal fasciculus; ROI2-right posterior limb of internal capsule. ROI3-right posterior thalamic radiation. (C) ROI1-genu of corpus callosum; ROI2-right posterior limb of internal capsule; ROI3-right splenium of corpus callosum. Significant difference in mean DTI value between HC and PAT group. (D) The red area indicates that the value of PAT is higher than HC and blue areas indicate lower values. Abbreviations: FA: fractional anisotropy; MD: mean diffusivity; AD: axial diffusivity; HC: healthy controls; PAT: patient; ROI: region of interest.
Table 2. Significant differences of DTI values between different brain WM regions of PAT and HC group.
| A PAT>HC | |||||||||||||||||||||||||||||||||||||||||||||||||||||||||||||||||||||||||||||||||||||||||||||||||||
| Parameter | WM regions (PAT vs. HC) | MNI coordinates | Voxels number | T value | P value | Cluster | |||||||||||||||||||||||||||||||||||||||||||||||||||||||||||||||||||||||||||||||||||||||||||||
| X | Y | Z | |||||||||||||||||||||||||||||||||||||||||||||||||||||||||||||||||||||||||||||||||||||||||||||||||
| MD | Left Superior longitudinal fasciculus | 125 | 121 | 100 | 117 | 7.61 | 0.00008 | ROI1 | |||||||||||||||||||||||||||||||||||||||||||||||||||||||||||||||||||||||||||||||||||||||||||
| Right Posterior limb of internal capsule | 80 | 121 | 68 | 125 | 5.31 | 0.003 | ROI2 | ||||||||||||||||||||||||||||||||||||||||||||||||||||||||||||||||||||||||||||||||||||||||||||
| Right Posterior thalamic radiation | 59 | 57 | 79 | 94 | 4.94 | 0.006 | ROI3 | ||||||||||||||||||||||||||||||||||||||||||||||||||||||||||||||||||||||||||||||||||||||||||||
| AD | Genu of corpus callosum | 103 | 160 | 79 | 109 | 6.37 | 0.0002 | ROI1 | |||||||||||||||||||||||||||||||||||||||||||||||||||||||||||||||||||||||||||||||||||||||||||
| Right Posterior limb of internal capsule | 74 | 120 | 74 | 192 | 5.36 | 0.002 | ROI2 | ||||||||||||||||||||||||||||||||||||||||||||||||||||||||||||||||||||||||||||||||||||||||||||
| Right Splenium of corpus callosum | 67 | 76 | 90 | 106 | 5.47 | 0.001 | ROI3 | ||||||||||||||||||||||||||||||||||||||||||||||||||||||||||||||||||||||||||||||||||||||||||||
| B PAT<HC | |||||||||||||||||||||||||||||||||||||||||||||||||||||||||||||||||||||||||||||||||||||||||||||||||||
| Parameter | WM regions (PAT vs. HC) | MNI coordinates | Voxels number | T value | P value | Cluster | |||||||||||||||||||||||||||||||||||||||||||||||||||||||||||||||||||||||||||||||||||||||||||||
| X | Y | Z | |||||||||||||||||||||||||||||||||||||||||||||||||||||||||||||||||||||||||||||||||||||||||||||||||
| FA | Left Superior longitudinal fasciculus | 129 | 116 | 101 | 185 | −6.78 | 0.0001 | ROI1 | |||||||||||||||||||||||||||||||||||||||||||||||||||||||||||||||||||||||||||||||||||||||||||
| Body of corpus callosum | 97 | 116 | 101 | 132 | −6.25 | 0.0003 | ROI2 | ||||||||||||||||||||||||||||||||||||||||||||||||||||||||||||||||||||||||||||||||||||||||||||
| Between-group differences in DTI parameters. Abbreviations: FA: fractional anisotropy; MD: mean diffusivity; AD: axial diffusivity; HC: Healthy controls; PAT: patient; N/A: not applicable. | |||||||||||||||||||||||||||||||||||||||||||||||||||||||||||||||||||||||||||||||||||||||||||||||||||
NODDI differences
Compared with the HCs, DE patients had significantly higher NODDI values in the left anterior corona radiata (ODI), the CC (ODI), LSLF (ODI), the right splenium of CC (FISO), the left posterior corona radiata (FICVF) (Figure 2A (red) and Table 3). Lower NODDI values in the brain areas were LSLF (FICVF) (Figure 2A (blue) and Table 3). The ROI signal values of the two groups were shown in Figure 2B–2D.
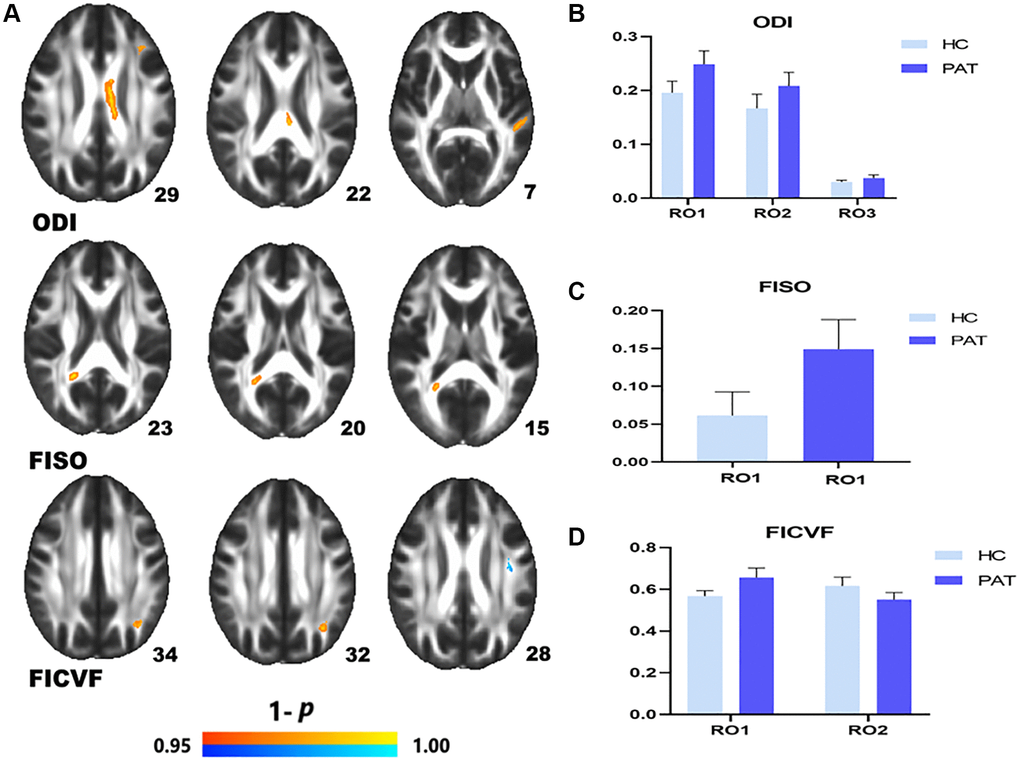
Figure 2. Comparison of NODDI value of HC and PAT group. Mean NODDI values between PAT and HC groups (A–C). (A) ROI1-left anterior corona radiata; ROI2-body of corpus callosum; ROI3-left superior longitudinal fasciculus. (B) Right splenium of corpus callosum. (C) ROI1-left posterior corona radiata; ROI2-left superior longitudinal fasciculus. Significant difference in mean NODDI value between HC and PAT group (D) The red area indicates that the value of PAT is higher than HC and blue areas indicate lower values. Abbreviations: ODI: orientation dispersion index; FISO: isotropic volume fraction; FICVF: intra-cellular volume fraction; HC: healthy controls; PAT: patient; ROI: region of interest.
Table 3. Significant differences of NODDI values between different brain WM regions of PAT and HC group.
| A PAT>HC | |||||||||||||||||||||||||||||||||||||||||||||||||||||||||||||||||||||||||||||||||||||||||||||||||||
| Parameter | WM regions (PAT vs. HC) | MNI coordinates | Voxels number | T value | P value | Cluster | |||||||||||||||||||||||||||||||||||||||||||||||||||||||||||||||||||||||||||||||||||||||||||||
| X | Y | Z | |||||||||||||||||||||||||||||||||||||||||||||||||||||||||||||||||||||||||||||||||||||||||||||||||
| ODI | Left Anterior corona radiata | 115 | 149 | 91 | 93 | 5.17 | 0.002 | ROI1 | |||||||||||||||||||||||||||||||||||||||||||||||||||||||||||||||||||||||||||||||||||||||||||
| Body of corpus callosum | 99 | 107 | 99 | 216 | 4.18 | 0.011 | ROI2 | ||||||||||||||||||||||||||||||||||||||||||||||||||||||||||||||||||||||||||||||||||||||||||||
| Left Superior longitudinal fasciculus | 132 | 87 | 75 | 87 | 4.54 | 0.007 | ROI3 | ||||||||||||||||||||||||||||||||||||||||||||||||||||||||||||||||||||||||||||||||||||||||||||
| FISO | Right Splenium of corpus callosum | 67 | 76 | 90 | 132 | 6.86 | 0.0005 | ROI1 | |||||||||||||||||||||||||||||||||||||||||||||||||||||||||||||||||||||||||||||||||||||||||||
| FICVF | Left Posterior corona radiata | 118 | 67 | 92 | 83 | 5.03 | 0.003 | ROI1 | |||||||||||||||||||||||||||||||||||||||||||||||||||||||||||||||||||||||||||||||||||||||||||
| B PAT < HC | |||||||||||||||||||||||||||||||||||||||||||||||||||||||||||||||||||||||||||||||||||||||||||||||||||
| Parameter | WM regions (PAT vs. HC) | MNI coordinates | Voxels number | T value | P value | Cluster | |||||||||||||||||||||||||||||||||||||||||||||||||||||||||||||||||||||||||||||||||||||||||||||
| X | Y | Z | |||||||||||||||||||||||||||||||||||||||||||||||||||||||||||||||||||||||||||||||||||||||||||||||||
| FICVF | Left Superior longitudinal fasciculus | 118 | 67 | 92 | 79 | −4.56 | 0.007 | ROI2 | |||||||||||||||||||||||||||||||||||||||||||||||||||||||||||||||||||||||||||||||||||||||||||
| Between-group differences in NODDI parameters. Abbreviations: ODI: orientation dispersion index; FISO: isotropic volume fraction; FICVF: intra-cellular volume fraction; HC: Healthy controls; PAT: patient; N/A: not applicable. | |||||||||||||||||||||||||||||||||||||||||||||||||||||||||||||||||||||||||||||||||||||||||||||||||||
Receiver operating characteristic curve
The ROC curve was used to evaluate the value of DTI and NODDI parameters in the two groups for diagnostic. AUC was positively correlated with diagnostic significance. The results showed that the value of DTI and NODDI in different regions of brain were significantly different in the two groups. Hence, as markers, DTI and NODDI values are useful for distinguishing DE from HC. Results of AUC were as follows: DTI: The AUC were 0.976 for LSLF (FA); 0.960 for CC (FA) (Figure 3A, PAT < HC); 0.994 for LSLF (MD); 0.891 for right posterior limb of internal capsule (MD); 0.918 for right posterior thalamic radiation (MD); 0.888 for genu of CC (AD); 0.880 for right posterior limb of internal capsule (AD); and 0.900 for right splenium of CC (AD) (Figure 3B, PAT > HC). NODDI: The AUC was 0.941 for the left anterior corona radiata; 0.867 for CC; 0.874 for the LSLF (ODI); 0.968 for the right splenium of CC; 0.971 for the left posterior corona radiata (Figure 3C, PAT > HC); and 0.880 for the LSLF (FICVF) (Figure 3D, PAT < HC). All p values were < 0.0001 and AUC were over 0.867.
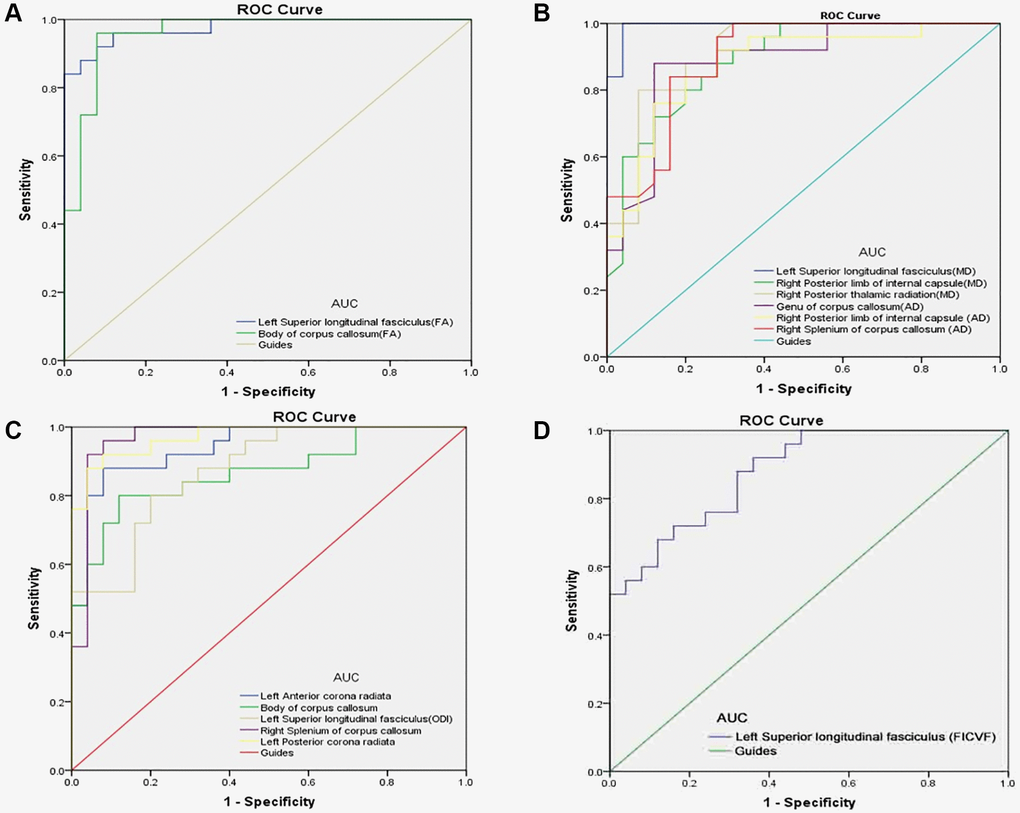
Figure 3. ROC curve analysis of the mean DTI and NODDI values for altered brain regions. (A) The area under the ROC curve were 0.976, (p < 0.0001; 95% CI: 0.941–1.000) for left superior longitudinal fasciculus (FA); body of corpus callosum (FA) 0.960, (p < 0.0001; 95% CI: 0.908–1.000). (B) The area under the ROC curve were 0.994 (p < 0.0001; 95% CI: 0.979–1.000) for left superior longitudinal fasciculus (MD); right posterior limb of internal capsule (MD) 0.891, (p < 0.0001; 95% CI: 0.804–0.979); right posterior thalamic radiation (MD) 0.918, (p < 0.0001; 95% CI: 0.841–0.994); genu of corpus callosum (AD) 0.888, (p < 0.0001; 95% CI: 0.794–0.982); right posterior limb of internal capsule (AD) 0.880, (p < 0.0001; 95% CI: 0.784–0.976); right splenium of corpus callosum (AD) 0.900, (p < 0.0001; 95% CI: 0.816–0.984). (C) The area under the ROC curve were 0.941, (p < 0.0001; 95% CI: 0.879–1.000) for left anterior corona radiata; body of corpus callosum 0.867, (p < 0.0001; 95% CI: 0.765–0.969); left superior longitudinal fasciculus (ODI) 0.874, (p < 0.0001; 95% CI: 0.780–0.967); right splenium of corpus callosum 0.968, (p < 0.0001; 95% CI: 0.916–1.000); left posterior corona radiata 0.971, (p < 0.0001; 95% CI: 0.934–1.000). (D) The area under the ROC curve were 0.880 (p < 0.0001; 95% CI: 0.790–0.970) for left superior longitudinal fasciculus (FICVF). Abbreviations: FA: fractional anisotropy; MD: mean diffusivity; AD: axial diffusivity; RD: radial diffusivity; ODI: orientation dispersion index; FISO: isotropic volume fraction; FICVF: intra-cellular volume fraction; AUC: area under the curve; ROC: receiver operating characteristic.
Correlation analysis
AS and DS values of HC group and PAT group were shown in Figure 4A. In the HC group, AS and DS were not significantly correlated with DTI and NODDI values. In the DE group, the value of FICVF was negatively correlated with DS (r = −0.909, p < 0.01) (Figure 4G) and AS (r = −0.929, p < 0.01) (Figure 4D) While the MD (ROI2) value was positively correlated with DS (r = 0.473, p = 0.017) (Figure 4E) and AS (r = 0.526, p = 0.007) (Figure 4B). The mean value of MD (ROI3) was positively correlated with the DS (r = 0.419, p = 0.037) (Figure 4F) and AS (r = 0.403, p = 0.046) (Figure 4C).
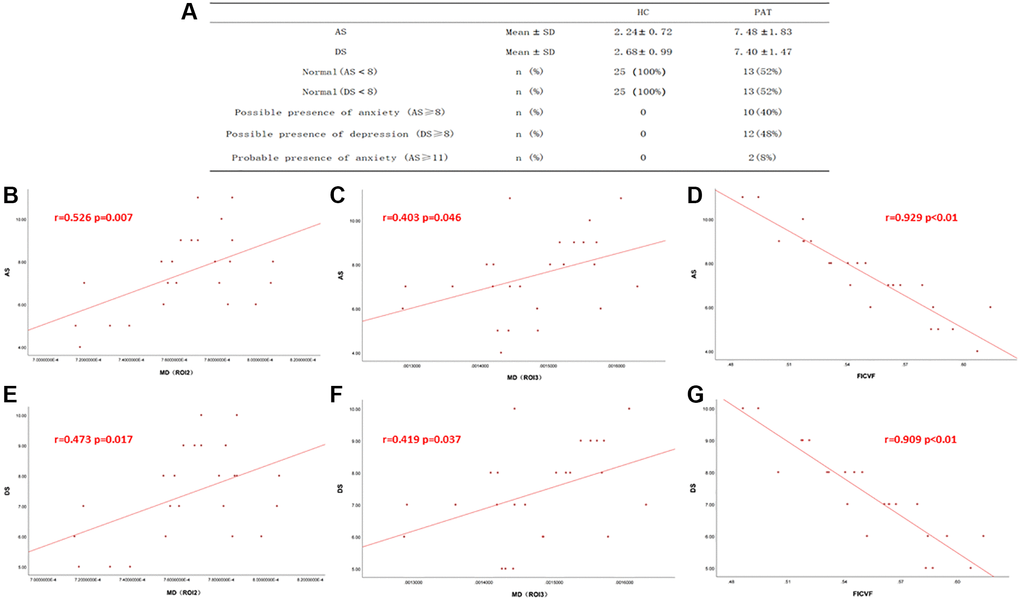
Figure 4. Correlations between the DTI values, NODDI values and AS, DS. (A) The value of AS and DS in two groups. (B–G) In There was a positive correlation with the values of MD and DS, AS. And the mean value of FICVF was negatively correlated with DS and AS. Abbreviations: DS: depression score; AS: anxiety score; MD: mean diffusivity; FICVF: intra-cellular volume fraction; HC: Healthy controls; PAT: patient.
Discussion
Dry eye is one of the most common eye diseases, accounting for 5% to 50% of dry eye cases worldwide [20], seriously affecting patients’ work and life and even causing social-psychological problems such as depression [21], stress [22], anxiety and sleep disorders [23]. However, the multifactorial cycle and pathological mechanism of dry eye has not been fully clarified. The results of this study suggest that there are microstructural changes in WM in DE patients, which may be the basis of mood abnormalities in DE patients.
DTI and NODDI characteristics
DTI is a very useful imaging technique in the clinical diagnosis and study of the microstructure of neural tissues, helping us to better understand the neurophysiological mechanisms of many diseases. DTI can quantitatively analyze the diffusion of water molecules in three-dimensional space within a brain region of interest, thus revealing the structure of WM fiber bundles. The MD in DTI reflects the range of diffusion motion of water molecules per unit time. The increase of MD and AD values may be partly caused by demyelination [24], although other factors such as axon loss, fiber density, axon diameter, and cell membrane integrity may also be responsible. Animal experiments have shown that demyelination after axonal injury often leads to an increase in transverse (short-axis) diffusivity and a decrease in axial (long-axis) diffusivity [25].
FA is very sensitive to white matter changes, reflecting the integrity of myelin sheath, axon density and any changes in diameter [26]. Significant FA decreases in the LSLF and the CC may reflect reduced neural integrity within these regions in DE, due to demyelination or axonal injury [27]. NODDI is an emerging method based on magnetic resonance diffusion imaging [28], which compared with DTI offers more complete and accurate indication of water diffusion behavior in complex brain tissues. ODI is a measure of changes in the direction of nerve processes. In our study, significantly raised ODI values perhaps suggesting a loss of fiber coherence and relatively maintained neuronal fiber density [29, 30].
Application of DTI and NODDI
Previous studies have applied DTI and NODDI in ophthalmology (Table 4), but to our knowledge, the present study is the first to assess WM changes in patients with dry eye using DTI combined with NODDI. Our study found that compared with the HCs, DTI and NODDI values were reduced in some brain regions (Figure 5). ROC results were used to verify DTI and NODDI analysis, and showed areas under the ROC curves greater than 0.7, indicating reliable accuracy. Therefore, it can be concluded that regional brain WM is altered in DE patients compared with HC. In addition, DTI and NODDI values reflect regional changes in white matter, and abnormalities in WM may be the basis for pain and mood disorders in DE patients (Table 5).
Table 4. DTI and NODDI applied in ophthalmologic disease.
| Author | Year | Disease | |||||||||||||||||||||||||||||||||||||||||||||||||||||||||||||||||||||||||||||||||||||||||||||||||
| DTI | Liu et al. [31] | 2020 | Monocular blindness | ||||||||||||||||||||||||||||||||||||||||||||||||||||||||||||||||||||||||||||||||||||||||||||||||
| Tian et al. [32] | 2019 | Neuromyelitis Optic Neuritis | |||||||||||||||||||||||||||||||||||||||||||||||||||||||||||||||||||||||||||||||||||||||||||||||||
| Wang et al. [33] | 2018 | Primary Open-Angle Glaucoma | |||||||||||||||||||||||||||||||||||||||||||||||||||||||||||||||||||||||||||||||||||||||||||||||||
| Lee et al. [34] | 2018 | Dysthyroid Optic Neuropathy | |||||||||||||||||||||||||||||||||||||||||||||||||||||||||||||||||||||||||||||||||||||||||||||||||
| Zhong et al. [35] | 2017 | Monocular blindness | |||||||||||||||||||||||||||||||||||||||||||||||||||||||||||||||||||||||||||||||||||||||||||||||||
| Gupta et al. [36] | 2016 | Strabismic amblyopes | |||||||||||||||||||||||||||||||||||||||||||||||||||||||||||||||||||||||||||||||||||||||||||||||||
| Huang Xin et al. [37] | 2016 | Comitant strabismus | |||||||||||||||||||||||||||||||||||||||||||||||||||||||||||||||||||||||||||||||||||||||||||||||||
| Schoemann et al. [38] | 2014 | Primary open-angle glaucoma | |||||||||||||||||||||||||||||||||||||||||||||||||||||||||||||||||||||||||||||||||||||||||||||||||
| Schmidt et al. [39] | 2014 | Primary open-angle glaucoma | |||||||||||||||||||||||||||||||||||||||||||||||||||||||||||||||||||||||||||||||||||||||||||||||||
| Michelson et al. [40] | 2013 | Glaucoma | |||||||||||||||||||||||||||||||||||||||||||||||||||||||||||||||||||||||||||||||||||||||||||||||||
| NODDI | Kang et al. [41] | 2021 | Anterior Visual Pathway Compression | ||||||||||||||||||||||||||||||||||||||||||||||||||||||||||||||||||||||||||||||||||||||||||||||||
| Abbreviations: DTI: diffusion tensor imaging; NODDI: neurite orientation dispersion and density imaging. | |||||||||||||||||||||||||||||||||||||||||||||||||||||||||||||||||||||||||||||||||||||||||||||||||||
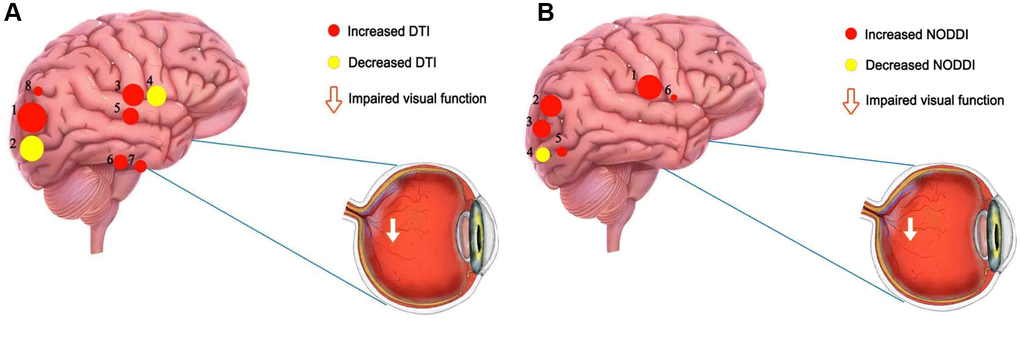
Figure 5. The mean DTI and NODOI values of altered brain regions. (A) Compared with the HCs, the DTI values of the following regions were decreased to various extents: 2- left superior longitudinal fasciculus (FA) (t = −6.78), 4- body of corpus callosum (FA) (t = −6.25). Compared with the HCs, the DTI values of the following regions were increased to various extents: 1- left superior longitudinal fasciculus (MD) (t =7.61), 7- right posterior limb of internal capsule (MD) (t = 5.31), 8- right posterior thalamic radiation (MD) (t = 4.94), 3- genu of corpus callosum (AD) (t = 6.37), 6- right posterior limb of internal capsule (AD) (t = 5.36), 5- right splenium of corpus callosum (AD) (t = 5.47). (B) Compared with the HCs, the NODOI values of the following regions were increased to various extents: 2- left anterior corona radiata (t = 5.17), 6- body of corpus callosum (t = 4.18), 5- left superior longitudinal fasciculus (ODI) (t = 4.54), 1- right splenium of corpus callosum (t = 6.86), 3- left posterior corona radiata (t = 5.03). Compared with the HCs, the NODOI values of the following regions were decreased to various extents: 4- left superior longitudinal fasciculus (FICVF) (t = −4.56). Abbreviations: HCs: healthy controls; DTI: diffusion tensor imaging; FA: fractional anisotropy; MD: mean diffusivity; AD: axial diffusivity; ODI: orientation dispersion index; FISO: isotropic volume fraction; FICVF: intracellular volume fraction.
Table 5. Alternation of brain white matter regions and its potential impact.
| Brain regions | Experimental results | Brain function | Anticipated results | ||||||||||||||||||||||||||||||||||||||||||||||||||||||||||||||||||||||||||||||||||||||||||||||||
| Thalamic | PAT>HC (MD) | transmit, process and respond visual information and pain information | Visual impairment and persistent pain symptoms | ||||||||||||||||||||||||||||||||||||||||||||||||||||||||||||||||||||||||||||||||||||||||||||||||
| Left Superior longitudinal fasciculus | PAT < HC (FA, FICVF) PAT>HC (MD, ODI) | associated with affective disorders | Depression and anxiety | ||||||||||||||||||||||||||||||||||||||||||||||||||||||||||||||||||||||||||||||||||||||||||||||||
| Right Posterior limb of internal capsule | PAT>HC (MD, AD) | associated with different aspects of emotion, motivation, cognition processing, and decision-making | Social and emotional problems | ||||||||||||||||||||||||||||||||||||||||||||||||||||||||||||||||||||||||||||||||||||||||||||||||
| Corpus callosum (Body, Splenium, Genu) | PAT < HC (FA) PAT>HC (AD, ODI, FISO) | integrate motor, emotional, and cognitive functions; part of the default model network | Social and emotional problems | ||||||||||||||||||||||||||||||||||||||||||||||||||||||||||||||||||||||||||||||||||||||||||||||||
| Corona radiata | PAT>HC (ODI, FICVF) | attentional control | Cognitive impairment | ||||||||||||||||||||||||||||||||||||||||||||||||||||||||||||||||||||||||||||||||||||||||||||||||
| Abbreviations: HC: healthy controls; PAT: patient controls. | |||||||||||||||||||||||||||||||||||||||||||||||||||||||||||||||||||||||||||||||||||||||||||||||||||
Relationship between brain regions, DE and HADS
The thalamus is located around the bilateral third ventricle and is the largest oval mixed nucleus of gray matter in the diencephalon. The thalamus has specific connections with the corresponding cerebral cortex. As a completely functional network, the cerebellum-thalamus can transmit, process and respond to visual and pain information within and beyond the visual brain [42, 43]. In this study, MD values of the right posterior thalamus were significantly different between DE and HC. Pan et al. [44] used the global brain functional connectivity (GFC) method at voxel level to study the differences in functional tissue between DE patients and healthy controls. The GFC changes in the cerebellum-thalamic-cortex network in DE patients may be related to visual impairment and persistent pain symptoms, and reduced GFC may lead to a continuous stress response and reduced pain threshold. The superior longitudinal fasciculus (which contains bidirectional fibers running from the frontal to the parietal, temporal and occipital lobes) is a communication link, connecting the “control network” region of the frontal parietal lobe with other regions. Studies have shown that the FA value of LSLF is decreased in patients with major depression [45, 46], and in affective disorders [47, 48].
The CC is the largest WM fiber bundle, connecting the bilateral cerebral hemispheres. The fibers in the knee of the corpus callosum are mainly connected with the temporal and parietal lobes. Abnormality of WM in schizophrenia or psychosis most commonly occurs in the CC [49]. In the present study, the FA values of the LSLF and CC were decreased in DE patients, while ODI and FISO values were increased, and these findings may be related to the affective disorders caused by DE. The inner capsule is a bundle of fibers that perform primary motor functions. Poulakis [50] found that the knee of the CC, the forelimb of the inner capsule, and the integrity of the coronary fiber bundle after radiation may be used to assess individuals’ risk of future cognitive decline. In addition, the increase in MD and AD values of the right posterior limb of the internal capsule may be related to the social and emotional problems of DE.
HADS is an effective method to evaluate depression and anxiety in patients with DE. Patients with severe symptoms requiring psychological treatment were not included in our study, and HADS in patients with DE was higher than that in the normal group, reflecting the correlation between dry eye and HADS. Persistent eye discomfort and visual impairment caused by DE can lead to anxiety, depression and other mood disorders. Research showed in rats that depression can lead to increased secretion of IL-1B and TNFα and reduced tear secretion [51]. Depressive symptoms are associated with subjective dry eye symptoms, but not with more objective measures (tear break-up time, Schirmer test and corneal staining) [52]. Correlations between mean values MD and FICVF and both AS and DS suggest that the regional changes of WM in DE patients may be related to the patient’s anxiety and depression (Figure 6).
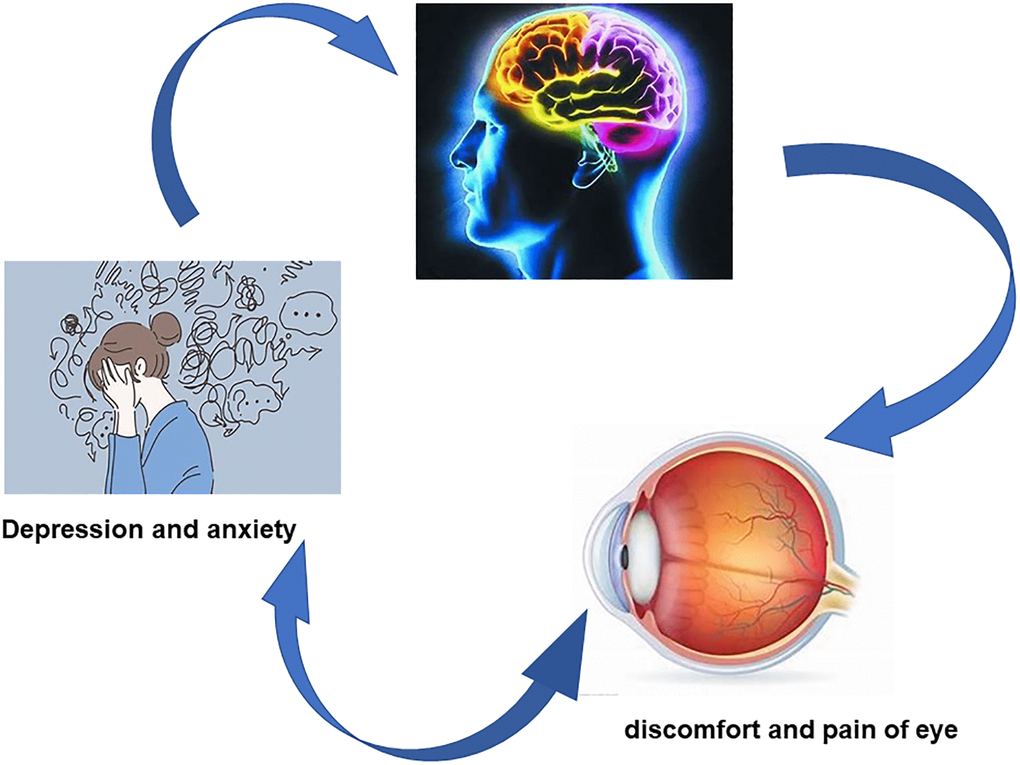
Figure 6. Correlation between DTI and NODDI values and emotional disorder. Compared with HC group, the values of DTI and NODDI in some brain white matter regions were significantly different in PAT group, and patients with dry eye were more prone to depression and anxiety. Abbreviations: HC: healthy controls; PAT: patient controls.
Limitations
This study has some limitations: 1) DTI adopts rapid prototyping technology, is very sensitive to the movement of small molecules, and artifacts caused by physiological movement may affect its results; 2) The small samples limits the credibility of the conclusions, and future studies with larger samples are needed to verify the method and results.
Conclusions
In conclusion, regional changes in brain WM in DE patients may help reveal the pathological mechanism of dry eye and provide a new evaluation index for clinical diagnosis. It is hoped that the current research findings will draw attention to the psychological state of patients with dry eye and lead to further research and treatment for DE patients.
Author Contributions
Yun-Qing Luo and Rong-Bin Liang analyzed the data and draft the manuscript; San-Hua Xu, Yi-Cong Pan and Qiu-Yu Li collected the data; Hui-Ye Shu, Min Kang and Pin Yin assisted in data collation and chart drawing, Li-Juan Zhang final revised the manuscript; Yi Shao conceived, designed and approved the manuscript.
Conflicts of Interest
The authors declare no conflicts of interest related to this study.
Funding
National Natural Science Foundation (No: 82160195); Central Government Guides Local Science and Technology Development Foundation (No: 20211ZDG02003); Key Research Foundation of Jiangxi Province (No: 20181BBG70004, 20203BBG73059); Excellent Talents Development Project of Jiangxi Province (No: 20192BCBL23020; Natural Science Foundation of Jiangxi Province (No: 20181BAB205034; Grassroots Health Appropriate Technology “Spark Promotion Plan” Project of Jiangxi Province (No:20188003); Health Development Planning Commission Science Foundation of Jiangxi Province (No: 20201032,202130210); Health Development Planning Commission Science TCM Foundation of Jiangxi Province (No: 2018A060, 2020A0087); Science and Technology Project of Jiangxi Provincial Health Commission (No: 202210635).
References
- 1. Jones MB, McElwain DL, Fulford GR, Collins MJ, Roberts AP. The effect of the lipid layer on tear film behaviour. Bull Math Biol. 2006; 68:1355–81. https://doi.org/10.1007/s11538-006-9105-9 [PubMed]
- 2. Tan CH, Labbé A, Liang Q, Qiao L, Baudouin C, Wan X, Wang N. Dynamic change of optical quality in patients with dry eye disease. Invest Ophthalmol Vis Sci. 2015; 56:2848–54. https://doi.org/10.1167/iovs.14-15757 [PubMed]
- 3. Kalangara JP, Galor A, Levitt RC, Felix ER, Alegret R, Sarantopoulos CD. Burning Eye Syndrome: Do Neuropathic Pain Mechanisms Underlie Chronic Dry Eye? Pain Med. 2016; 17:746–55. https://doi.org/10.1093/pm/pnv070 [PubMed]
- 4. Levitt AE, Galor A, Chowdhury AR, Felix ER, Sarantopoulos CD, Zhuang GY, Patin D, Maixner W, Smith SB, Martin ER, Levitt RC. Evidence that Dry Eye Represents a Chronic Overlapping Pain Condition. Mol Pain. 2017; 13:1744806917729306. https://doi.org/10.1177/1744806917729306 [PubMed]
- 5. Semba CP, Gadek TR. Development of lifitegrast: a novel T-cell inhibitor for the treatment of dry eye disease. Clin Ophthalmol. 2016; 10:1083–94. https://doi.org/10.2147/OPTH.S110557 [PubMed]
- 6. Wu X, Chen X, Ma Y, Lin X, Yu X, He S, Luo C, Xu W. Analysis of tear inflammatory molecules and clinical correlations in evaporative dry eye disease caused by meibomian gland dysfunction. Int Ophthalmol. 2020; 40:3049–58. https://doi.org/10.1007/s10792-020-01489-z [PubMed]
- 7. Willcox MDP, Argüeso P, Georgiev GA, Holopainen JM, Laurie GW, Millar TJ, Papas EB, Rolland JP, Schmidt TA, Stahl U, Suarez T, Subbaraman LN, Uçakhan OÖ, Jones L. TFOS DEWS II Tear Film Report. Ocul Surf. 2017; 15:366–403. https://doi.org/10.1016/j.jtos.2017.03.006 [PubMed]
- 8. Rahman M, Okamoto K, Thompson R, Katagiri A, Bereiter DA. Sensitization of trigeminal brainstem pathways in a model for tear deficient dry eye. Pain. 2015; 156:942–50. https://doi.org/10.1097/j.pain.0000000000000135 [PubMed]
- 9. Wang Z, Wang H, Mwansisya TE, Sheng Y, Shan B, Liu Z, Xue Z, Chen X. The integrity of the white matter in first-episode schizophrenia patients with auditory verbal hallucinations: An atlas-based DTI analysis. Psychiatry Res Neuroimaging. 2021; 315:111328. https://doi.org/10.1016/j.pscychresns.2021.111328 [PubMed]
- 10. Torso M, Bozzali M, Zamboni G, Jenkinson M, Chance SA, and Alzheimers Disease Neuroimage Initiative. Detection of Alzheimer's Disease using cortical diffusion tensor imaging. Hum Brain Mapp. 2021; 42:967–77. https://doi.org/10.1002/hbm.25271 [PubMed]
- 11. Oladosu O, Liu WQ, Pike BG, Koch M, Metz LM, Zhang Y. Advanced Analysis of Diffusion Tensor Imaging Along With Machine Learning Provides New Sensitive Measures of Tissue Pathology and Intra-Lesion Activity in Multiple Sclerosis. Front Neurosci. 2021; 15:634063. https://doi.org/10.3389/fnins.2021.634063 [PubMed]
- 12. Sengul Y, Otcu H, Ustun I, Sengul HS, Cersonsky T, Alkan A, Louis ED. Neuroimaging depression and anxiety in essential tremor: A diffusion tensor imaging study. Clin Imaging. 2019; 58:96–104. https://doi.org/10.1016/j.clinimag.2019.06.016 [PubMed]
- 13. Hu JY, Shu HY, Li QY, Wu SN, Liang RB, Ge QM, Zhang LJ, Pan YC, Shao Y. Alternation of brain intrinsic activity in patients with hypertensive retinopathy: a resting-state fMRI study. Aging (Albany NY). 2021; 13:21659–70. https://doi.org/10.18632/aging.203510 [PubMed]
- 14. Yang YC, Cai GQ, Yang QC, Li B, Ge QM, Li QY, Shi WQ, Min YL, Liang RB, Shao Y. Brain Functional Connectivity Changes in Patients with Acute Eye Pain: A Resting-State Functional Magnetic Resonance Imaging (fMRI) Study. Med Sci Monit. 2021; 27:e930588. https://doi.org/10.12659/MSM.930588 [PubMed]
- 15. Chen SY, Cai GQ, Liang RB, Yang QC, Min YL, Ge QM, Li B, Shi WQ, Li QY, Zeng XJ, Shao Y. Regional brain changes in patients with diabetic optic neuropathy: a resting-state functional magnetic resonance imaging study. Quant Imaging Med Surg. 2021; 11:2125–37. https://doi.org/10.21037/qims-20-453 [PubMed]
- 16. Yu K, Guo Y, Ge QM, Su T, Shi WQ, Zhang LJ, Shu HY, Pan YC, Liang RB, Li QY, Shao Y. Altered spontaneous activity in the frontal gyrus in dry eye: a resting-state functional MRI study. Sci Rep. 2021; 11:12943. https://doi.org/10.1038/s41598-021-92199-8 [PubMed]
- 17. Yan H, Shan X, Wei S, Liu F, Li W, Lei Y, Guo W, Luo S. Abnormal Spontaneous Brain Activities of Limbic-Cortical Circuits in Patients With Dry Eye Disease. Front Hum Neurosci. 2020; 14:574758. https://doi.org/10.3389/fnhum.2020.574758 [PubMed]
- 18. Carroll BT, Kathol RG, Noyes R
Jr , Wald TG, Clamon GH. Screening for depression and anxiety in cancer patients using the Hospital Anxiety and Depression Scale. Gen Hosp Psychiatry. 1993; 15:69–74. https://doi.org/10.1016/0163-8343(93)90099-a [PubMed] - 19. Jones L, Downie LE, Korb D, Benitez-Del-Castillo JM, Dana R, Deng SX, Dong PN, Geerling G, Hida RY, Liu Y, Seo KY, Tauber J, Wakamatsu TH, et al. TFOS DEWS II Management and Therapy Report. Ocul Surf. 2017; 15:575–628. https://doi.org/10.1016/j.jtos.2017.05.006 [PubMed]
- 20. Belmonte C, Nichols JJ, Cox SM, Brock JA, Begley CG, Bereiter DA, Dartt DA, Galor A, Hamrah P, Ivanusic JJ, Jacobs DS, McNamara NA, Rosenblatt MI, et al. TFOS DEWS II pain and sensation report. Ocul Surf. 2017; 15:404–37. https://doi.org/10.1016/j.jtos.2017.05.002 [PubMed]
- 21. Ulusoy MO, Işık-Ulusoy S, Kıvanç SA. Evaluation of dry eye disease in newly diagnosed anxiety and depression patients using anterior segment optical coherence tomography. Eye Vis (Lond). 2019; 6:25. https://doi.org/10.1186/s40662-019-0149-y [PubMed]
- 22. van der Vaart R, Weaver MA, Lefebvre C, Davis RM. The association between dry eye disease and depression and anxiety in a large population-based study. Am J Ophthalmol. 2015; 159:470–4. https://doi.org/10.1016/j.ajo.2014.11.028 [PubMed]
- 23. Magno MS, Utheim TP, Snieder H, Hammond CJ, Vehof J. The relationship between dry eye and sleep quality. Ocul Surf. 2021; 20:13–19. https://doi.org/10.1016/j.jtos.2020.12.009 [PubMed]
- 24. Beaulieu C. The basis of anisotropic water diffusion in the nervous system - a technical review. NMR Biomed. 2002; 15:435–55. https://doi.org/10.1002/nbm.782 [PubMed]
- 25. Song SK, Sun SW, Ramsbottom MJ, Chang C, Russell J, Cross AH. Dysmyelination revealed through MRI as increased radial (but unchanged axial) diffusion of water. Neuroimage. 2002; 17:1429–36. https://doi.org/10.1006/nimg.2002.1267 [PubMed]
- 26. Jones DK, Knösche TR, Turner R. White matter integrity, fiber count, and other fallacies: the do's and don'ts of diffusion MRI. Neuroimage. 2013; 73:239–54. https://doi.org/10.1016/j.neuroimage.2012.06.081 [PubMed]
- 27. Liu JA, Yu J, Cheung CW. Immune Actions on the Peripheral Nervous System in Pain. Int J Mol Sci. 2021; 22:1448. https://doi.org/10.3390/ijms22031448 [PubMed]
- 28. Kamagata K, Hatano T, Aoki S. What is NODDI and what is its role in Parkinson's assessment? Expert Rev Neurother. 2016; 16:241–3. https://doi.org/10.1586/14737175.2016.1142876 [PubMed]
- 29. Hagiwara A, Kamagata K, Shimoji K, Yokoyama K, Andica C, Hori M, Fujita S, Maekawa T, Irie R, Akashi T, Wada A, Suzuki M, Abe O, et al. White Matter Abnormalities in Multiple Sclerosis Evaluated by Quantitative Synthetic MRI, Diffusion Tensor Imaging, and Neurite Orientation Dispersion and Density Imaging. AJNR Am J Neuroradiol. 2019; 40:1642–8. https://doi.org/10.3174/ajnr.A6209 [PubMed]
- 30. De Santis S, Bastiani M, Droby A, Kolber P, Zipp F, Pracht E, Stoecker T, Groppa S, Roebroeck A. Characterizing Microstructural Tissue Properties in Multiple Sclerosis with Diffusion MRI at 7 T and 3 T: The Impact of the Experimental Design. Neuroscience. 2019; 403:17–26. https://doi.org/10.1016/j.neuroscience.2018.03.048 [PubMed]
- 31. Liu YX, Li B, Wu KR, Tang LY, Lin Q, Li QH, Yuan Q, Shi WQ, Liang RB, Ge QM, Shao Y. Altered white matter integrity in patients with monocular blindness: A diffusion tensor imaging and tract-based spatial statistics study. Brain Behav. 2020; 10:e01720. https://doi.org/10.1002/brb3.1720 [PubMed]
- 32. Tian Y, Liu Z, Tang Z, Li M, Lou X, Dong E, Liu G, Wang Y, Wang Y, Bian X, Wei S, Tian J, Ma L. Radiomics Analysis of DTI Data to Assess Vision Outcome After Intravenous Methylprednisolone Therapy in Neuromyelitis Optic Neuritis. J Magn Reson Imaging. 2019; 49:1365–73. https://doi.org/10.1002/jmri.26326 [PubMed]
- 33. Wang Q, Chen W, Wang H, Zhang X, Qu X, Wang Y, Li T, Wang N, Xian J. Reduced Functional and Anatomic Interhemispheric Homotopic Connectivity in Primary Open-Angle Glaucoma: A Combined Resting State-fMRI and DTI Study. Invest Ophthalmol Vis Sci. 2018; 59:1861–8. https://doi.org/10.1167/iovs.17-23291 [PubMed]
- 34. Lee H, Lee YH, Suh SI, Jeong EK, Baek S, Seo HS. Characterizing Intraorbital Optic Nerve Changes on Diffusion Tensor Imaging in Thyroid Eye Disease Before Dysthyroid Optic Neuropathy. J Comput Assist Tomogr. 2018; 42:293–8. https://doi.org/10.1097/RCT.0000000000000680 [PubMed]
- 35. Zhong YF, Tang ZH, Qiang JW, Wu LJ, Wang R, Wang J, Jin LX, Xiao ZB. Changes in DTI parameters in the optic tracts of macaque monkeys with monocular blindness. Neurosci Lett. 2017; 636:248–53. https://doi.org/10.1016/j.neulet.2016.11.030 [PubMed]
- 36. Gupta S, Kumaran SS, Saxena R, Gudwani S, Menon V, Sharma P. BOLD fMRI and DTI in strabismic amblyopes following occlusion therapy. Int Ophthalmol. 2016; 36:557–68. https://doi.org/10.1007/s10792-015-0159-2 [PubMed]
- 37. Huang X, Li HJ, Zhang Y, Peng DC, Hu PH, Zhong YL, Zhou FQ, Shao Y. Microstructural changes of the whole brain in patients with comitant strabismus: evidence from a diffusion tensor imaging study. Neuropsychiatr Dis Treat. 2016; 12:2007–14. https://doi.org/10.2147/NDT.S108834 [PubMed]
- 38. Schoemann J, Engelhorn T, Waerntges S, Doerfler A, El-Rafei A, Michelson G. Cerebral microinfarcts in primary open-angle glaucoma correlated with DTI-derived integrity of optic radiation. Invest Ophthalmol Vis Sci. 2014; 55:7241–7. https://doi.org/10.1167/iovs.14-14919 [PubMed]
- 39. Schmidt MA, Mennecke A, Michelson G, Doerfler A, Engelhorn T. DTI analysis in patients with primary open-angle glaucoma: impact of registration on Voxel-Wise statistics. PLoS One. 2014; 9:e99344. https://doi.org/10.1371/journal.pone.0099344 [PubMed]
- 40. Michelson G, Engelhorn T, Wärntges S, El Rafei A, Hornegger J, Doerfler A. DTI parameters of axonal integrity and demyelination of the optic radiation correlate with glaucoma indices. Graefes Arch Clin Exp Ophthalmol. 2013; 251:243–53. https://doi.org/10.1007/s00417-011-1887-2 [PubMed]
- 41. Kang KM, Choi EJ, Jung W, Lee J, Choi SH, Kim YH. Diffusion Tensor Imaging and Neurite Orientation Dispersion and Density Imaging Assessment of Optic Pathway Function in Patients With Anterior Visual Pathway Compression. J Neuroophthalmol. 2022; 42:e192–202. https://doi.org/10.1097/WNO.0000000000001309 [PubMed]
- 42. Penner J, Ford KA, Taylor R, Schaefer B, Théberge J, Neufeld RW, Osuch EA, Menon RS, Rajakumar N, Allman JM, Williamson PC. Medial Prefrontal and Anterior Insular Connectivity in Early Schizophrenia and Major Depressive Disorder: A Resting Functional MRI Evaluation of Large-Scale Brain Network Models. Front Hum Neurosci. 2016; 10:132. https://doi.org/10.3389/fnhum.2016.00132 [PubMed]
- 43. Coghill RC. The Distributed Nociceptive System: A Framework for Understanding Pain. Trends Neurosci. 2020; 43:780–94. https://doi.org/10.1016/j.tins.2020.07.004 [PubMed]
- 44. Pan P, Wei S, Ou Y, Liu F, Li H, Jiang W, Li W, Lei Y, Guo W, Luo S. Reduced Global-Brain Functional Connectivity of the Cerebello-Thalamo-Cortical Network in Patients With Dry Eye Disease. Front Hum Neurosci. 2020; 14:572693. https://doi.org/10.3389/fnhum.2020.572693 [PubMed]
- 45. Liu Z, Kang L, Zhang A, Yang C, Liu M, Wang J, Liu P, Zhang K, Sun N. Injuries in Left Corticospinal Tracts, Forceps Major, and Left Superior Longitudinal Fasciculus (Temporal) as the Quality Indicators for Major Depressive Disorder. Neural Plast. 2021; 2021:2348072. https://doi.org/10.1155/2021/2348072 [PubMed]
- 46. Shen Q, Liu Y, Guo J, Zhang H, Xiang Y, Liao H, Cai S, Zhou B, Wang M, Liu S, Yi J, Zhang Z, Tan C. Impaired white matter microstructure associated with severe depressive symptoms in patients with PD. Brain Imaging Behav. 2022; 16:169–75. https://doi.org/10.1007/s11682-021-00488-7 [PubMed]
- 47. Lai CH, Wu YT. Alterations in white matter micro-integrity of the superior longitudinal fasciculus and anterior thalamic radiation of young adult patients with depression. Psychol Med. 2014; 44:2825–32. https://doi.org/10.1017/S0033291714000440 [PubMed]
- 48. Baur V, Hänggi J, Rufer M, Delsignore A, Jäncke L, Herwig U, Beatrix Brühl A. White matter alterations in social anxiety disorder. J Psychiatr Res. 2011; 45:1366–72. https://doi.org/10.1016/j.jpsychires.2011.05.007 [PubMed]
- 49. Price G, Cercignani M, Parker GJ, Altmann DR, Barnes TR, Barker GJ, Joyce EM, Ron MA. Abnormal brain connectivity in first-episode psychosis: a diffusion MRI tractography study of the corpus callosum. Neuroimage. 2007; 35:458–66. https://doi.org/10.1016/j.neuroimage.2006.12.019 [PubMed]
- 50. Poulakis K, Reid RI, Przybelski SA, Knopman DS, Graff-Radford J, Lowe VJ, Mielke MM, Machulda MM, Jack CR
Jr , Petersen RC, Westman E, Vemuri P. Longitudinal deterioration of white-matter integrity: heterogeneity in the ageing population. Brain Commun. 2021; 3:fcaa238. https://doi.org/10.1093/braincomms/fcaa238 [PubMed] - 51. Zhang X, Yin Y, Yue L, Gong L. Selective Serotonin Reuptake Inhibitors Aggravate Depression-Associated Dry Eye Via Activating the NF-κB Pathway. Invest Ophthalmol Vis Sci. 2019; 60:407–19. https://doi.org/10.1167/iovs.18-25572 [PubMed]
- 52. Kitazawa M, Sakamoto C, Yoshimura M, Kawashima M, Inoue S, Mimura M, Tsubota K, Negishi K, Kishimoto T. The Relationship of Dry Eye Disease with Depression and Anxiety: A Naturalistic Observational Study. Transl Vis Sci Technol. 2018; 7:35. https://doi.org/10.1167/tvst.7.6.35 [PubMed]