


Introduction
Hepatocellular carcinoma (HCC) is one of the most common malignant tumors, and has caused a substantial economic and health burden around the world for many years. According to data released by the American Cancer Society in 2021, HCC is the fifth leading cause of cancer-related mortality, with a five-year survival rate of less than 20% in all stages [1]. The poor prognosis of HCC has mainly been attributed to the low diagnostic rate in the early stage of the disease [2]; indeed, most HCC patients have already missed the opportunity for potentially curative therapeutic interventions by the time they are diagnosed. Currently, liver ultrasound examination and serum alpha-fetoprotein (AFP) analysis are recommended to screen patients with early-stage HCC [3]; however, both of these techniques lack sufficient sensitivity to detect early lesions. Therefore, it is critical to identify more sensitive molecular biomarkers to diagnose early-stage HCC and improve patients’ prognoses.
Chaperonin containing TCP-1 (CCT) is an intracellular chaperonin composed of eight subunits: α, β, γ, δ, ε, ζ, η and θ, which are encoded by CCT1, CCT2, CCT3, CCT4, CCT5, CCT6, CCT7 and CCT8, respectively [4, 5]. CCT promotes the folding of intracellular proteins (mainly cytoskeletal proteins such as tubulin and actin) in the cytoplasm [6]. Since cell division, directed migration and invasion are the main drivers of tumorigenesis and cancer progression, and all these processes depend on the microtubules and actin filaments of the cytoskeleton, CCT activity is fundamentally involved in cancer [5–7]. CCT3 was shown to promote HCC progression by functioning upstream of Yes-associated protein and transcription factor CP2, and thus was suggested as a potential therapeutic target and biomarker for HCC [8]. In addition, Xu and colleagues found that CCT3 could be a novel therapeutic target associated with breast cancer proliferation and metastasis [9]. High CCT2, CCT5, CCT6A and CCT7 levels have also been detected in various tumors and associated with patients’ prognoses [10–14]. In bioinformatic analyses, CCT7 was found to be overexpressed and associated with worse survival in HCC patients; however, the clinical prognostic/diagnostic value and function of this gene have not yet been illustrated [15, 16].
In the present study, we analyzed CCT7 expression in HCC and adjacent normal tissues from various public databases, and performed immunohistochemical staining of tissues from an HCC cohort. We also evaluated the association of CCT7 expression with the clinical characteristics and outcomes of HCC patients. We then searched for CpG sites and determined the correlation of CCT7 methylation with overall survival (OS) in HCC patients. Finally, we performed Gene Ontology (GO), Kyoto Encyclopedia of Genes and Genomes (KEGG) and Gene Set Enrichment Analyses (GSEA) to identify pathways through which CCT7 could contribute to HCC tumorigenesis and progression.
Results
CCT7 mRNA expression is significantly upregulated and associated with poorer tumor characteristics in HCC
We analyzed CCT7 mRNA levels in HCC tissues from The Cancer Genome Atlas (TCGA) database, and visualized the data in the UALCAN database. CCT7 was significantly upregulated in HCC tissues compared with normal liver samples (Figure 1A). In addition, CCT7 mRNA levels in HCC samples increased incrementally with increasing cancer stages (Figure 1B) and tumor grades (Figure 1C). In the TNMplot database, CCT7 mRNA expression was higher in metastatic samples than in non-metastatic tumor samples or normal samples (Figure 1D).
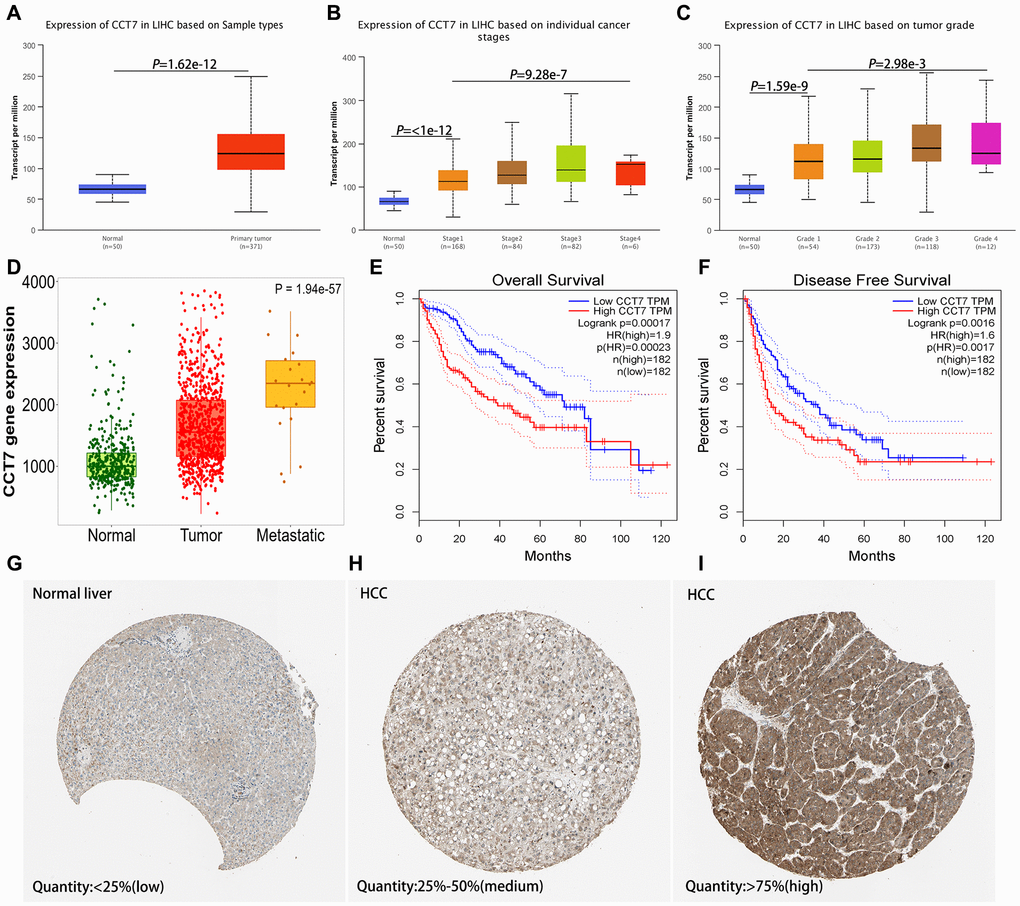
Figure 1. CCT7 levels in HCC and adjacent normal liver tissues. (A) CCT7 mRNA levels were significantly greater in HCC than in normal liver tissues. (B, C) CCT7 mRNA expression increased incrementally with increasing cancer stages (B) and tumor grades (C) in HCC tissues. (D) CCT7 mRNA levels were greater in metastatic than in non-metastatic tumor samples. (E, F) Higher CCT7 mRNA expression was associated with worse OS (E) and RFS (F). (G–I) Representative images from immunohistochemical staining of CCT7 protein expression in normal liver tissues (G, expression quantity <25%), low-expression HCC tissues (H, expression quantity 25–50%) and high-expression HCC tissues (I, expression quantity >75%) from the Human Protein Atlas database.
Higher CCT7 mRNA expression is associated with poorer survival and clinical outcomes in HCC
Next, we analyzed the association between CCT7 mRNA expression and clinical outcomes using HCC samples from TCGA. Survival curves demonstrated that higher CCT7 mRNA levels were associated with poorer OS (Figure 1E) and recurrence-free survival (RFS; Figure 1F) in HCC patients. Higher CCT7 expression was also associated with greater vascular invasion (P = 0.015), higher Tumor-Node-Metastasis (TNM) staging (P = 0.049), higher tumor grading (P = 0.007), greater serum AFP levels (P < 0.001), familial cancer history (P = 0.011), adjacent hepatic inflammation (P = 0.027), fibrosis (P = 0.002), recurrence (P = 0.037) and poorer survival (P = 0.038), but was not associated with age, gender, radiation or pharmaceutical treatment (Table 1).
Table 1. Correlation between CCT7 expression and clinical outcomes in HCC in the TCGA database (372 cases).
| Characteristics | CCT7 level | X2 | *P-Value | ||||||||||||||||||||||||||||||||||||||||||||||||||||||||||||||||||||||||||||||||||||||||||||||||
| N | High (n) | Low (n) | |||||||||||||||||||||||||||||||||||||||||||||||||||||||||||||||||||||||||||||||||||||||||||||||||
| Gender | Male | 251 | 132 | 119 | 2.07 | 0.15 | |||||||||||||||||||||||||||||||||||||||||||||||||||||||||||||||||||||||||||||||||||||||||||||
| Female | 121 | 54 | 67 | ||||||||||||||||||||||||||||||||||||||||||||||||||||||||||||||||||||||||||||||||||||||||||||||||
| Age(years) | >50 | 301 | 151 | 150 | 0.017 | 0.895 | |||||||||||||||||||||||||||||||||||||||||||||||||||||||||||||||||||||||||||||||||||||||||||||
| <=50 | 71 | 35 | 36 | ||||||||||||||||||||||||||||||||||||||||||||||||||||||||||||||||||||||||||||||||||||||||||||||||
| Vascular invasion | Yes | 105 | 61 | 44 | 5.897 | 0.015 | |||||||||||||||||||||||||||||||||||||||||||||||||||||||||||||||||||||||||||||||||||||||||||||
| No | 211 | 92 | 119 | ||||||||||||||||||||||||||||||||||||||||||||||||||||||||||||||||||||||||||||||||||||||||||||||||
| TNM staging | I/II | 269 | 126 | 143 | 3.88 | 0.049 | |||||||||||||||||||||||||||||||||||||||||||||||||||||||||||||||||||||||||||||||||||||||||||||
| III/IV | 103 | 60 | 43 | ||||||||||||||||||||||||||||||||||||||||||||||||||||||||||||||||||||||||||||||||||||||||||||||||
| Tumor grade | G1/G2 | 135 | 80 | 55 | 7.267 | 0.007 | |||||||||||||||||||||||||||||||||||||||||||||||||||||||||||||||||||||||||||||||||||||||||||||
| G3/G4 | 237 | 106 | 131 | ||||||||||||||||||||||||||||||||||||||||||||||||||||||||||||||||||||||||||||||||||||||||||||||||
| Serum AFP level(ng/ml) | >400 ng/ml | 82 | 54 | 28 | 13.62 | <0.001 | |||||||||||||||||||||||||||||||||||||||||||||||||||||||||||||||||||||||||||||||||||||||||||||
| <=400 ng/ml | 228 | 96 | 132 | ||||||||||||||||||||||||||||||||||||||||||||||||||||||||||||||||||||||||||||||||||||||||||||||||
| Family cancer history | Yes | 111 | 68 | 43 | 6.409 | 0.011 | |||||||||||||||||||||||||||||||||||||||||||||||||||||||||||||||||||||||||||||||||||||||||||||
| No | 207 | 96 | 111 | ||||||||||||||||||||||||||||||||||||||||||||||||||||||||||||||||||||||||||||||||||||||||||||||||
| Adjacent hepatic inflammation | Yes | 134 | 75 | 59 | 4.859 | 0.027 | |||||||||||||||||||||||||||||||||||||||||||||||||||||||||||||||||||||||||||||||||||||||||||||
| No | 121 | 51 | 70 | ||||||||||||||||||||||||||||||||||||||||||||||||||||||||||||||||||||||||||||||||||||||||||||||||
| Radiation | Yes | 10 | 7 | 3 | 1.644 | 0.200 | |||||||||||||||||||||||||||||||||||||||||||||||||||||||||||||||||||||||||||||||||||||||||||||
| No | 362 | 179 | 183 | ||||||||||||||||||||||||||||||||||||||||||||||||||||||||||||||||||||||||||||||||||||||||||||||||
| Pharmaceutical | Yes | 24 | 14 | 10 | 0.713 | 0.399 | |||||||||||||||||||||||||||||||||||||||||||||||||||||||||||||||||||||||||||||||||||||||||||||
| No | 348 | 172 | 176 | ||||||||||||||||||||||||||||||||||||||||||||||||||||||||||||||||||||||||||||||||||||||||||||||||
| Fibrosis | Yes | 186 | 106 | 80 | 9.558 | 0.002 | |||||||||||||||||||||||||||||||||||||||||||||||||||||||||||||||||||||||||||||||||||||||||||||
| No | 123 | 48 | 75 | ||||||||||||||||||||||||||||||||||||||||||||||||||||||||||||||||||||||||||||||||||||||||||||||||
| BMI (kg/m2) | >=24 | 111 | 46 | 65 | 4.359 | 0.037 | |||||||||||||||||||||||||||||||||||||||||||||||||||||||||||||||||||||||||||||||||||||||||||||
| <24 | 226 | 121 | 105 | ||||||||||||||||||||||||||||||||||||||||||||||||||||||||||||||||||||||||||||||||||||||||||||||||
| Recurrence | Yes | 180 | 100 | 80 | 4.306 | 0.038 | |||||||||||||||||||||||||||||||||||||||||||||||||||||||||||||||||||||||||||||||||||||||||||||
| No | 192 | 86 | 106 | ||||||||||||||||||||||||||||||||||||||||||||||||||||||||||||||||||||||||||||||||||||||||||||||||
| Survival | Alive | 245 | 105 | 140 | 14.646 | <0.001 | |||||||||||||||||||||||||||||||||||||||||||||||||||||||||||||||||||||||||||||||||||||||||||||
| Abbreviations: CCT7: Chaperonin containing TCP1 subunit 7; AFP: alpha fetoprotein; TNM: tumor node metastasis; BMI: body mass index. *P-Value <0.05 were considered statistically significant. | |||||||||||||||||||||||||||||||||||||||||||||||||||||||||||||||||||||||||||||||||||||||||||||||||||
A univariate Cox regression analysis indicated that greater vascular invasion (P = 0.003), TNM staging (P < 0.001), tumor grading (P < 0.001) and CCT7 mRNA expression (P < 0.001) were risk factors for poorer OS in HCC patients. A multivariate Cox regression analysis confirmed that higher TNM staging (hazard ratio [HR] (95% confidence interval [CI]): 2.047 (1.342–3.124); P = 0.001), tumor grading (HR (95% CI): 1.808 (1.191–2.744); P = 0.005) and CCT7 mRNA expression (HR (95% CI): 2.031 (1.327–3.110); P = 0.001) were independent risk factors for poorer OS in HCC patients (Table 2).
Table 2. Univariate and multivariate cox regression analysis of overall survival and recurrence-free survival in TCGA database (372 cases).
| Variables | Overall survival | *P-Value | Recurrence-free survival | *P-Value | |||||||||||||||||||||||||||||||||||||||||||||||||||||||||||||||||||||||||||||||||||||||||||||||
| HR (95% CI) | HR (95% CI) | ||||||||||||||||||||||||||||||||||||||||||||||||||||||||||||||||||||||||||||||||||||||||||||||||||
| Univariate analysis | |||||||||||||||||||||||||||||||||||||||||||||||||||||||||||||||||||||||||||||||||||||||||||||||||||
| Age(years) | >55 vs. <=55 | 1.248 (0.786–1.979) | 0.348 | 0.993 (0.689–1.431) | 0.969 | ||||||||||||||||||||||||||||||||||||||||||||||||||||||||||||||||||||||||||||||||||||||||||||||
| Gender | Male vs. female | 1.224 (0.855–1.754) | 0.270 | 1.019 (0.746–1.392) | 0.904 | ||||||||||||||||||||||||||||||||||||||||||||||||||||||||||||||||||||||||||||||||||||||||||||||
| Vascular invasion | Yes vs. no | 1.863 (1.242–2.793) | 0.003 | 2.134 (1.523–2.989) | <0.001 | ||||||||||||||||||||||||||||||||||||||||||||||||||||||||||||||||||||||||||||||||||||||||||||||
| TNM staging | I/II vs. III/IV | 2.515 (1.771–3.573) | <0.001 | 1.954 (1.439–2.653) | <0.001 | ||||||||||||||||||||||||||||||||||||||||||||||||||||||||||||||||||||||||||||||||||||||||||||||
| Serum AFP level(ng/ml) | >400 vs <=400 | 1.441 (0.940–2.210) | 0.093 | 1.337 (0.938–1.905) | 0.108 | ||||||||||||||||||||||||||||||||||||||||||||||||||||||||||||||||||||||||||||||||||||||||||||||
| Tumor grade | G1/G2 vs. G3/G4 | 2.032 (1.431–2.885) | <0.001 | 1.675 (1.249–2.247) | 0.001 | ||||||||||||||||||||||||||||||||||||||||||||||||||||||||||||||||||||||||||||||||||||||||||||||
| Family cancer history | Yes vs. no | 1.130 (0.779–1.639) | 0.519 | 0.893 (0.642–1.241) | 0.500 | ||||||||||||||||||||||||||||||||||||||||||||||||||||||||||||||||||||||||||||||||||||||||||||||
| Adjacent hepatic inflammation | Yes vs. no | 1.415 (0.892–2.244) | 0.141 | 1.213 (0.854–1.725) | 0.281 | ||||||||||||||||||||||||||||||||||||||||||||||||||||||||||||||||||||||||||||||||||||||||||||||
| Radiation | Yes vs. no | 1.063 (0.392–2.883) | 0.904 | 1.491 (0.699–3.180) | 0.302 | ||||||||||||||||||||||||||||||||||||||||||||||||||||||||||||||||||||||||||||||||||||||||||||||
| Pharmaceutical | Yes vs. no | 1.100 (0.558–2.168) | 0.784 | 2.098 (1.302–3.379) | 0.002 | ||||||||||||||||||||||||||||||||||||||||||||||||||||||||||||||||||||||||||||||||||||||||||||||
| TACE of postoperation | Yes vs. no | 0.763 (0.352–1.657) | 0.495 | 1.015 (1.006–1.024) | 0.002 | ||||||||||||||||||||||||||||||||||||||||||||||||||||||||||||||||||||||||||||||||||||||||||||||
| Fibrosis | Yes vs. no | 0.946 (0.634–1.412) | 0.786 | 1.463 (1.044–2.050) | 0.027 | ||||||||||||||||||||||||||||||||||||||||||||||||||||||||||||||||||||||||||||||||||||||||||||||
| BMI (kg/m2) | >=24 vs. <24 | 0.853 (0.570–1.275) | 0.438 | 0.982 (0.710–1.358) | 0.912 | ||||||||||||||||||||||||||||||||||||||||||||||||||||||||||||||||||||||||||||||||||||||||||||||
| CCT7 | High vs. low | 2.143 (1.490–3.081) | <0.001 | 1.719 (1.279–2.310) | <0.001 | ||||||||||||||||||||||||||||||||||||||||||||||||||||||||||||||||||||||||||||||||||||||||||||||
| Multivariate analysis | |||||||||||||||||||||||||||||||||||||||||||||||||||||||||||||||||||||||||||||||||||||||||||||||||||
| Vascular invasion | Yes vs. no | 1.386 (0.912–2.107) | 0.126 | 1.528 (0.998–2.338) | 0.049 | ||||||||||||||||||||||||||||||||||||||||||||||||||||||||||||||||||||||||||||||||||||||||||||||
| TNM staging | I/II vs. III/IV | 2.047 (1.342–3.124) | 0.001 | 1.790 (1.076–2.714) | 0.023 | ||||||||||||||||||||||||||||||||||||||||||||||||||||||||||||||||||||||||||||||||||||||||||||||
| Tumor grade | G1/G2 vs. G3/G4 | 1.808 (1.191–2.744) | 0.005 | 1.571 (1.045–2.363) | 0.030 | ||||||||||||||||||||||||||||||||||||||||||||||||||||||||||||||||||||||||||||||||||||||||||||||
| Pharmaceutical | Yes vs. no | 1.486 (0.640–3.449) | 0.357 | ||||||||||||||||||||||||||||||||||||||||||||||||||||||||||||||||||||||||||||||||||||||||||||||||
| TACE of postoperation | Yes vs. no | 2.314 (1.296–4.133) | 0.005 | ||||||||||||||||||||||||||||||||||||||||||||||||||||||||||||||||||||||||||||||||||||||||||||||||
| Fibrosis | Yes vs. no | 1.102 (0.722–1.679) | 0.653 | ||||||||||||||||||||||||||||||||||||||||||||||||||||||||||||||||||||||||||||||||||||||||||||||||
| CCT7 | High vs. low | 2.031 (1.327–3.110) | 0.001 | 1.460 (1.039–2.052) | 0.029 | ||||||||||||||||||||||||||||||||||||||||||||||||||||||||||||||||||||||||||||||||||||||||||||||
| Abbreviations: CCT7: Chaperonin containing TCP1 subunit 7; AFP: alpha fetoprotein; TNM: tumor node metastasis; BMI: body mass index; HR: hazard ratio; CI: confidential interval. *P-Value <0.05 were considered statistically significant. | |||||||||||||||||||||||||||||||||||||||||||||||||||||||||||||||||||||||||||||||||||||||||||||||||||
For RFS, a univariate Cox regression analysis demonstrated that greater vascular invasion (P < 0.001), higher TNM staging (P < 0.001), higher tumor grading (P = 0.001), pharmaceutical treatment (P = 0.002), postoperative transarterial chemoembolization (TACE; P = 0.002), fibrosis (P = 0.027) and higher CCT7 mRNA expression (P < 0.001) were risk factors for poorer RFS in HCC patients. A multivariate Cox regression analysis confirmed that greater vascular invasion (HR (95% CI): 1.528 (0.998–2.338); P = 0.049), higher TNM staging (HR (95% CI): 1.790 (1.076–2.714); P = 0.023), higher tumor grading (HR (95% CI): 1.571 (1.045–2.363); P = 0.030), postoperative TACE (HR (95% CI): 2.314 (1.296–4.133); P = 0.005) and higher CCT7 mRNA expression (HR (95% CI): 1.460 (1.039–2.052); P = 0.029) were independent risk factors for poorer RFS in HCC patients (Table 2).
Higher CCT7 protein expression correlated with poorer survival and clinical outcomes in a cohort of 118 HCC patients
We then evaluated samples from the Human Protein Atlas database, and found that CCT7 protein expression was significantly higher in HCC tissues (Figure 1H and 1I) than in normal liver tissues (Figure 1G). Immunohistochemical staining of tissues from a cohort of 118 HCC patients supported these findings (Figure 2A and 2B). We divided these 118 patients into high and low CCT7 protein expression groups (n = 57 and 61, respectively) based on their immunohistochemical scores. Higher CCT7 protein expression was associated with higher TNM staging (P = 0.043), serum AFP expression (P < 0.001), tumor differentiation (P = 0.010), vascular invasion (P = 0.029) and recurrence (P = 0.005) in HCC patients (Table 3).
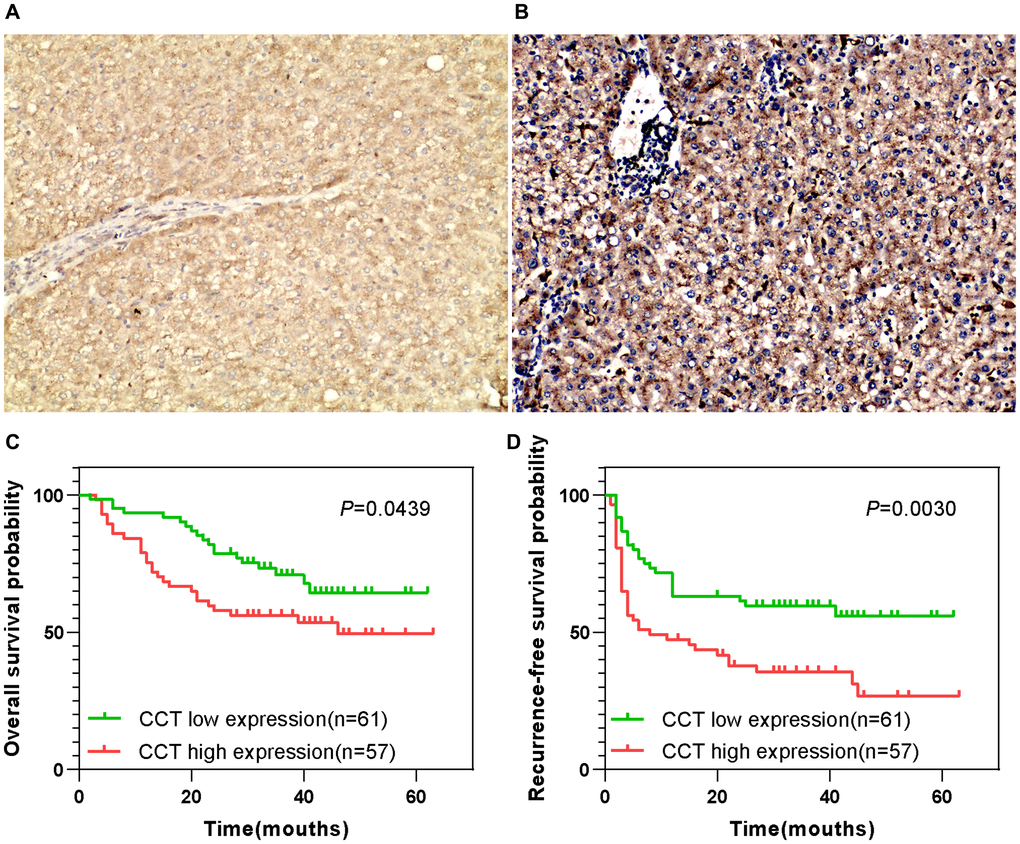
Figure 2. Prognostic value of CCT7 protein expression in a cohort of 118 HCC patients. (A, B) Representative images from immunohistochemical staining of HCC tissues with low (A) or high (B) CCT7 protein expression (×200 magnification). (C, D) Higher CCT7 protein expression was associated with worse OS (C) and RFS (D).
Table 3. Correlation between CCT7 protein expression and clinical outcomes in HCC patients (n = 118).
| Characteristics | CCT7 level | *P-Value | |||||||||||||||||||||||||||||||||||||||||||||||||||||||||||||||||||||||||||||||||||||||||||||||||
| N | High (n) | Low (n) | |||||||||||||||||||||||||||||||||||||||||||||||||||||||||||||||||||||||||||||||||||||||||||||||||
| Age (year) | >55 | 80 | 40 | 40 | 0.593 | ||||||||||||||||||||||||||||||||||||||||||||||||||||||||||||||||||||||||||||||||||||||||||||||
| <=55 | 38 | 17 | 21 | ||||||||||||||||||||||||||||||||||||||||||||||||||||||||||||||||||||||||||||||||||||||||||||||||
| Gender | Male | 103 | 48 | 55 | 0.332 | ||||||||||||||||||||||||||||||||||||||||||||||||||||||||||||||||||||||||||||||||||||||||||||||
| Female | 15 | 9 | 6 | ||||||||||||||||||||||||||||||||||||||||||||||||||||||||||||||||||||||||||||||||||||||||||||||||
| Tumor size (cm) | >5cm | 67 | 37 | 30 | 0.085 | ||||||||||||||||||||||||||||||||||||||||||||||||||||||||||||||||||||||||||||||||||||||||||||||
| <=5cm | 51 | 20 | 31 | ||||||||||||||||||||||||||||||||||||||||||||||||||||||||||||||||||||||||||||||||||||||||||||||||
| TNM staging | I/II | 79 | 33 | 46 | 0.043 | ||||||||||||||||||||||||||||||||||||||||||||||||||||||||||||||||||||||||||||||||||||||||||||||
| III | 39 | 24 | 15 | ||||||||||||||||||||||||||||||||||||||||||||||||||||||||||||||||||||||||||||||||||||||||||||||||
| Serum AFP level | >400ng/ml | 53 | 36 | 17 | <0.001 | ||||||||||||||||||||||||||||||||||||||||||||||||||||||||||||||||||||||||||||||||||||||||||||||
| <=400ng/ml | 65 | 21 | 44 | ||||||||||||||||||||||||||||||||||||||||||||||||||||||||||||||||||||||||||||||||||||||||||||||||
| Tumor location | Left | 39 | 23 | 16 | 0.103 | ||||||||||||||||||||||||||||||||||||||||||||||||||||||||||||||||||||||||||||||||||||||||||||||
| Right | 79 | 34 | 45 | ||||||||||||||||||||||||||||||||||||||||||||||||||||||||||||||||||||||||||||||||||||||||||||||||
| Tumor differentiation | Low | 12 | 8 | 4 | 0.01 | ||||||||||||||||||||||||||||||||||||||||||||||||||||||||||||||||||||||||||||||||||||||||||||||
| Median | 81 | 43 | 38 | ||||||||||||||||||||||||||||||||||||||||||||||||||||||||||||||||||||||||||||||||||||||||||||||||
| High | 15 | 6 | 19 | ||||||||||||||||||||||||||||||||||||||||||||||||||||||||||||||||||||||||||||||||||||||||||||||||
| Vascular invasion | Yes | 52 | 31 | 21 | 0.029 | ||||||||||||||||||||||||||||||||||||||||||||||||||||||||||||||||||||||||||||||||||||||||||||||
| No | 66 | 26 | 40 | ||||||||||||||||||||||||||||||||||||||||||||||||||||||||||||||||||||||||||||||||||||||||||||||||
| Tumor encapsulation | Yes | 76 | 32 | 44 | 0.070 | ||||||||||||||||||||||||||||||||||||||||||||||||||||||||||||||||||||||||||||||||||||||||||||||
| No | 42 | 25 | 17 | ||||||||||||||||||||||||||||||||||||||||||||||||||||||||||||||||||||||||||||||||||||||||||||||||
| Recurrence | Yes | 63 | 38 | 25 | 0.005 | ||||||||||||||||||||||||||||||||||||||||||||||||||||||||||||||||||||||||||||||||||||||||||||||
| No | 55 | 19 | 36 | ||||||||||||||||||||||||||||||||||||||||||||||||||||||||||||||||||||||||||||||||||||||||||||||||
| Survival | Alive | 46 | 27 | 19 | 0.071 | ||||||||||||||||||||||||||||||||||||||||||||||||||||||||||||||||||||||||||||||||||||||||||||||
| Abbreviations: CCT7: Chaperonin containing TCP1 subunit 7; AFP: alpha fetoprotein; TNM: tumor node metastasis. *P-Value <0.05 were considered statistically significant. | |||||||||||||||||||||||||||||||||||||||||||||||||||||||||||||||||||||||||||||||||||||||||||||||||||
A univariate Cox regression analysis revealed that greater tumor sizes (P = 0.038), TNM staging (P = 0.006), tumor differentiation (P = 0.012), vascular invasion (P = 0.040) and CCT7 protein expression (P = 0.048) were risk factors for poorer OS in HCC patients. A multivariate Cox regression analysis confirmed that greater tumor differentiation (HR (95% CI): 3.232 (1.273–8.208); P = 0.014), vascular invasion (HR (95% CI): 2.224 (1.253–3.949); P = 0.006) and CCT7 protein expression (HR (95% CI): 1.754 (1.047–2.937); P = 0.033) were independent risk factors for poorer OS. For RFS, greater tumor differentiation (HR (95% CI): 2.840 (1.110–7.264); P = 0.029), greater vascular invasion (HR (95% CI): 2.106 (1.186–3.426); P = 0.010), the absence of tumor encapsulation (HR (95% CI) for tumor encapsulation: 0.303 (0.179–0.511); P < 0.001) and higher CCT7 expression (HR (95% CI): 1.695 (1.012–2.839); P = 0.045) were both risk factors and independent risk factors for poorer RFS (Table 4). In addition, the durations of OS (Figure 2C) and RFS (Figure 2D) were shorter in the high CCT7 protein expression group than in the low expression group.
Table 4. Univariate and multivariate cox regression analysis of overall survival and recurrence-free survival in HCC patients (n = 118).
| Variables | Overall survival | *P-Value | Recurrence-free survival | *P-Value | |||||||||||||||||||||||||||||||||||||||||||||||||||||||||||||||||||||||||||||||||||||||||||||||
| HR (95%CI) | HR (95%CI) | ||||||||||||||||||||||||||||||||||||||||||||||||||||||||||||||||||||||||||||||||||||||||||||||||||
| Univariate analysis | |||||||||||||||||||||||||||||||||||||||||||||||||||||||||||||||||||||||||||||||||||||||||||||||||||
| Age (year) | >55 | 0.799 (0.439–1.456) | 0.464 | 0.755 (0.451–1.264) | 0.285 | ||||||||||||||||||||||||||||||||||||||||||||||||||||||||||||||||||||||||||||||||||||||||||||||
| <=55 | |||||||||||||||||||||||||||||||||||||||||||||||||||||||||||||||||||||||||||||||||||||||||||||||||||
| Gender | Male vs. female | 0.821 (0.324–2.080) | 0.678 | 1.533 (0.779–3.017) | 0.216 | ||||||||||||||||||||||||||||||||||||||||||||||||||||||||||||||||||||||||||||||||||||||||||||||
| Tumor size (cm) | >5 vs. <=5 | 1.913 (1.038–3.527) | 0.038 | 1.527 (0.921–2.530) | 0.101 | ||||||||||||||||||||||||||||||||||||||||||||||||||||||||||||||||||||||||||||||||||||||||||||||
| TNM staging | I/II vs. III | 2.262 (1.267–4.039) | 0.006 | 1.573 (0.943–2.624) | 0.083 | ||||||||||||||||||||||||||||||||||||||||||||||||||||||||||||||||||||||||||||||||||||||||||||||
| Serum AFP level | >400 vs <=400 | 1.709 (0.956–3.054) | 0.071 | 1.205 (0.734–1.980) | 0.461 | ||||||||||||||||||||||||||||||||||||||||||||||||||||||||||||||||||||||||||||||||||||||||||||||
| Tumor location | Left vs. right | 0.825 (0.449–1.514) | 0.535 | 1.182 (0.690–2.024) | 0.543 | ||||||||||||||||||||||||||||||||||||||||||||||||||||||||||||||||||||||||||||||||||||||||||||||
| Tumor differentiation | High vs. median/low | 4.492 (1.393–14.491) | 0.012 | 4.211 (1.686–10.519) | 0.002 | ||||||||||||||||||||||||||||||||||||||||||||||||||||||||||||||||||||||||||||||||||||||||||||||
| Vascular invasion | Yes vs. no | 1.877 (1.030–3.419) | 0.040 | 2.359 (1.400–3.974) | 0.001 | ||||||||||||||||||||||||||||||||||||||||||||||||||||||||||||||||||||||||||||||||||||||||||||||
| Tumor encapsulation | Yes vs. no | 0.837 (0.462–1.515) | 0.556 | 0.258 (0.155–0.431) | <0.001 | ||||||||||||||||||||||||||||||||||||||||||||||||||||||||||||||||||||||||||||||||||||||||||||||
| CCT7 | High vs. low | 1.810 (1.005–3.259) | 0.048 | 2.062 (1.242–3.422) | 0.005 | ||||||||||||||||||||||||||||||||||||||||||||||||||||||||||||||||||||||||||||||||||||||||||||||
| Multivariate analysis | |||||||||||||||||||||||||||||||||||||||||||||||||||||||||||||||||||||||||||||||||||||||||||||||||||
| Tumor size (cm) | >5 vs. <=5 | 0.832 (0.420–1.651) | 0.420 | ||||||||||||||||||||||||||||||||||||||||||||||||||||||||||||||||||||||||||||||||||||||||||||||||
| TNM staging | I/II vs. III | 1.462 (0.755–2.829) | 0.260 | ||||||||||||||||||||||||||||||||||||||||||||||||||||||||||||||||||||||||||||||||||||||||||||||||
| Tumor differentiation | High vs. median/low | 3.232 (1.273–8.208) | 0.014 | 2.840 (1.110–7.264) | 0.029 | ||||||||||||||||||||||||||||||||||||||||||||||||||||||||||||||||||||||||||||||||||||||||||||||
| Vascular invasion | Yes vs. no | 2.224 (1.253–3.949) | 0.006 | 2.106 (1.186–3.426) | 0.010 | ||||||||||||||||||||||||||||||||||||||||||||||||||||||||||||||||||||||||||||||||||||||||||||||
| Tumor encapsulation | Yes vs. no | 0.303 (0.179–0.511) | <0.001 | ||||||||||||||||||||||||||||||||||||||||||||||||||||||||||||||||||||||||||||||||||||||||||||||||
| CCT7 | High vs. low | 1.754 (1.047–2.937) | 0.033 | 1.695 (1.012–2.839) | 0.045 | ||||||||||||||||||||||||||||||||||||||||||||||||||||||||||||||||||||||||||||||||||||||||||||||
| Abbreviations: CCT7: Chaperonin containing TCP1 subunit 7; AFP: alpha fetoprotein; TNM: tumor node metastasis; HR: hazard ratio; CI: confidential interval. *P-Value <0.05 were considered statistically significant. | |||||||||||||||||||||||||||||||||||||||||||||||||||||||||||||||||||||||||||||||||||||||||||||||||||
CCT7 is a diagnostic biomarker of HCC
Next, we analyzed CCT7 mRNA expression in the GSE76427 (Figure 3A), GSE54236 (Figure 3B) and GSE136247 (Figure 3C) datasets from the Gene Expression Omnibus (GEO) database. In each dataset, CCT7 was significantly upregulated in HCC tissues compared with non-HCC tissues (all P < 0.001). The corresponding receiver operating characteristic (ROC) curves exhibited good diagnostic significance, with area under the curve (AUC) values of 0.847 (Figure 3D), 0.673 (Figure 3E) and 0.793 (Figure 3F), respectively. Furthermore, a heat map of the GSE76427 dataset revealed that CCT7 mRNA expression was 90% higher in HCC tissues than in paired adjacent normal liver tissues (Figure 3G).
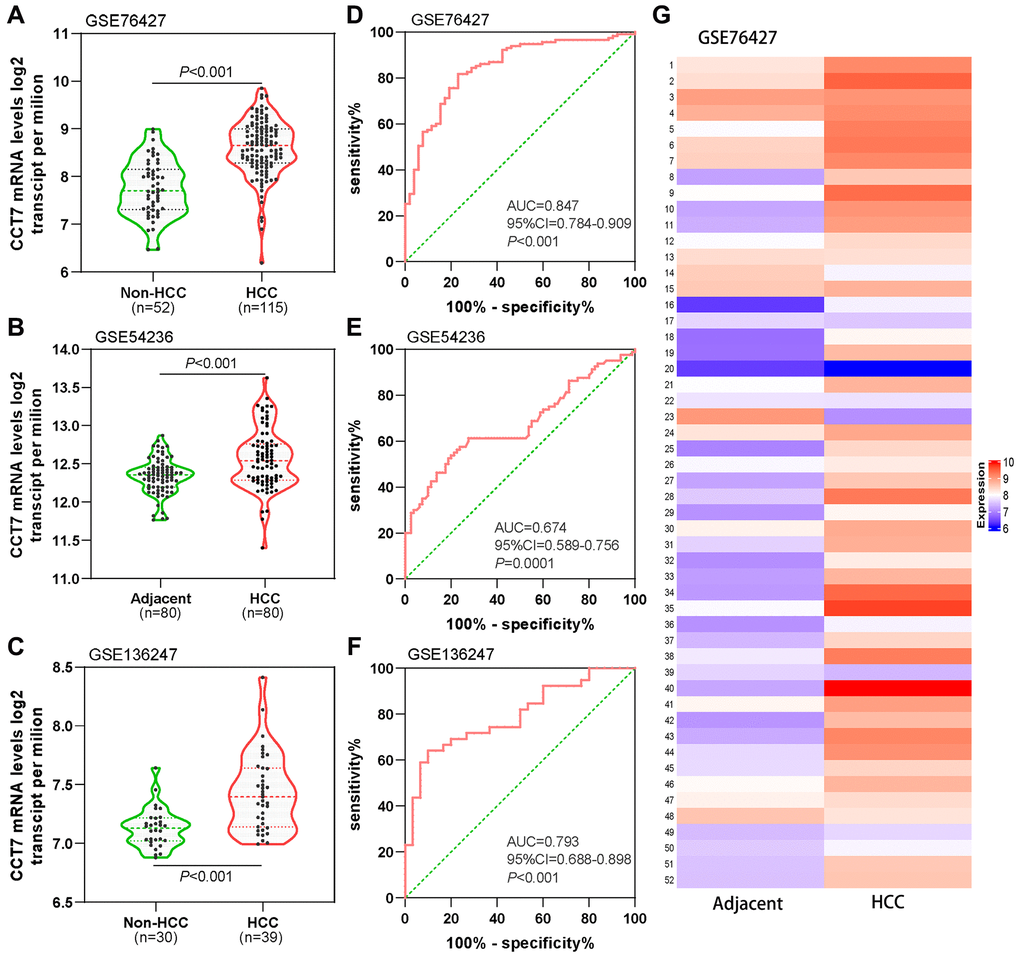
Figure 3. Diagnostic value of CCT7 mRNA expression for HCC in the GEO database. CCT7 mRNA levels were significantly greater in HCC than in non-HCC tissues in GSE76427 (A), GSE54236 (B) and GSE136247 (C). ROC curves exhibited the good diagnostic significance of CCT7 mRNA expression for HCC in GSE76427 (D), GSE54236 (E) and GSE136247 (F). (G) The heat map shows CCT7 mRNA expression in 52 paired HCC and corresponding adjacent normal tissues.
CCT7 has a higher positive predictive value (PPV) than AFP for HCC diagnosis
We then compared the diagnostic efficiencies of CCT7 and AFP mRNA levels for HCC in the GEO and TCGA databases. CCT7 mRNA expression was significantly higher in HCC tissues than in normal liver tissues in the GSE25097 (Figure 4A), GSE63898 (Figure 4B) and TCGA liver hepatocellular carcinoma (LIHC) datasets (Figure 4C). ROC curve analyses revealed that CCT7 had a significantly higher AUC than AFP in the GSE25097 (0.719 vs. 0.677, Figure 4D), GSE63898 (0.803 vs. 0.567, Figure 4E) and TCGA LIHC datasets (0.743 vs. 0.616, Figure 4F). The best diagnostic cut-off values for CCT7 and AFP expression were identified based on the sensitivity and specificity values of the ROC curves. We found that CCT7 had a higher PPV than AFP in the GSE25097 (54.9% vs. 44.1%, Figure 4G), GSE63898 (64.5% vs. 28.1%, Figure 4H) and TCGA LIHC datasets (55.8% vs. 41.3%, Figure 4I), even though the two genes had statistically similar negative predictive values (NPVs). These results demonstrated that CCT7 is more sensitive than AFP for the diagnosis of HCC.
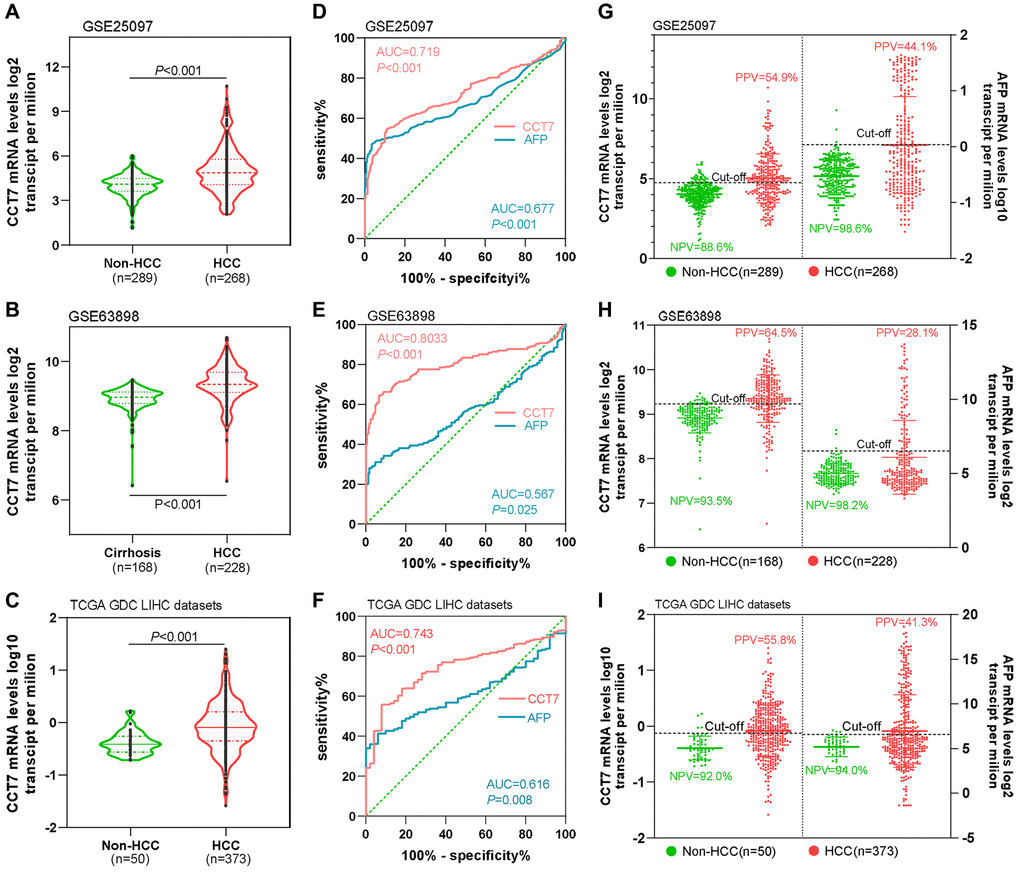
Figure 4. CCT7 has a higher PPV than AFP for HCC diagnosis. CCT7 mRNA levels were significantly greater in HCC than in non-HCC tissues in GSE25097 (A), GSE63898 (B) and TCGA LIHC datasets (C). In ROC curve analyses, CCT7 had a significantly higher AUC than AFP in the GSE25097 (0.719 vs. 0.677, D), GSE63898 (0.803 vs. 0.567, E) and TCGA LIHC datasets (0.743 vs. 0.616, F). CCT7 had a higher PPV than AFP in the GSE25097 (54.9% vs. 44.1%, G), GSE63898 (64.5% vs. 28.1%, H) and TCGA LIHC datasets (55.8% vs. 41.3%, I).
CCT7 has better diagnostic value than AFP in HCC patients with low AFP expression
AFP is upregulated in no more than 70% of patients with HCC. Thus, we evaluated the diagnostic value of CCT7 in HCC patients with low AFP expression using the GSE25097 and GSE63898 datasets from the GEO database. AFP mRNA levels in cirrhosis and HCC patients were similar in the two datasets (Figure 5A, 5D), whereas CCT7 levels were significantly higher in HCC patients than in cirrhosis patients (Figure 5B, 5E). ROC curve analyses revealed that AFP expression had no diagnostic value in either the GSE25097 or the GSE63898 dataset, with AUCs of 0.588 and 0.535, respectively (P > 0.05). On the other hand, CCT7 mRNA expression had significant diagnostic value in both datasets, with AUCs of 0.724 (P < 0.001, Figure 5C) and 0.803 (P < 0.001, Figure 5F), respectively. These results demonstrated that CCT7 can be used as an accurate diagnostic biomarker in HCC patients with low AFP expression.
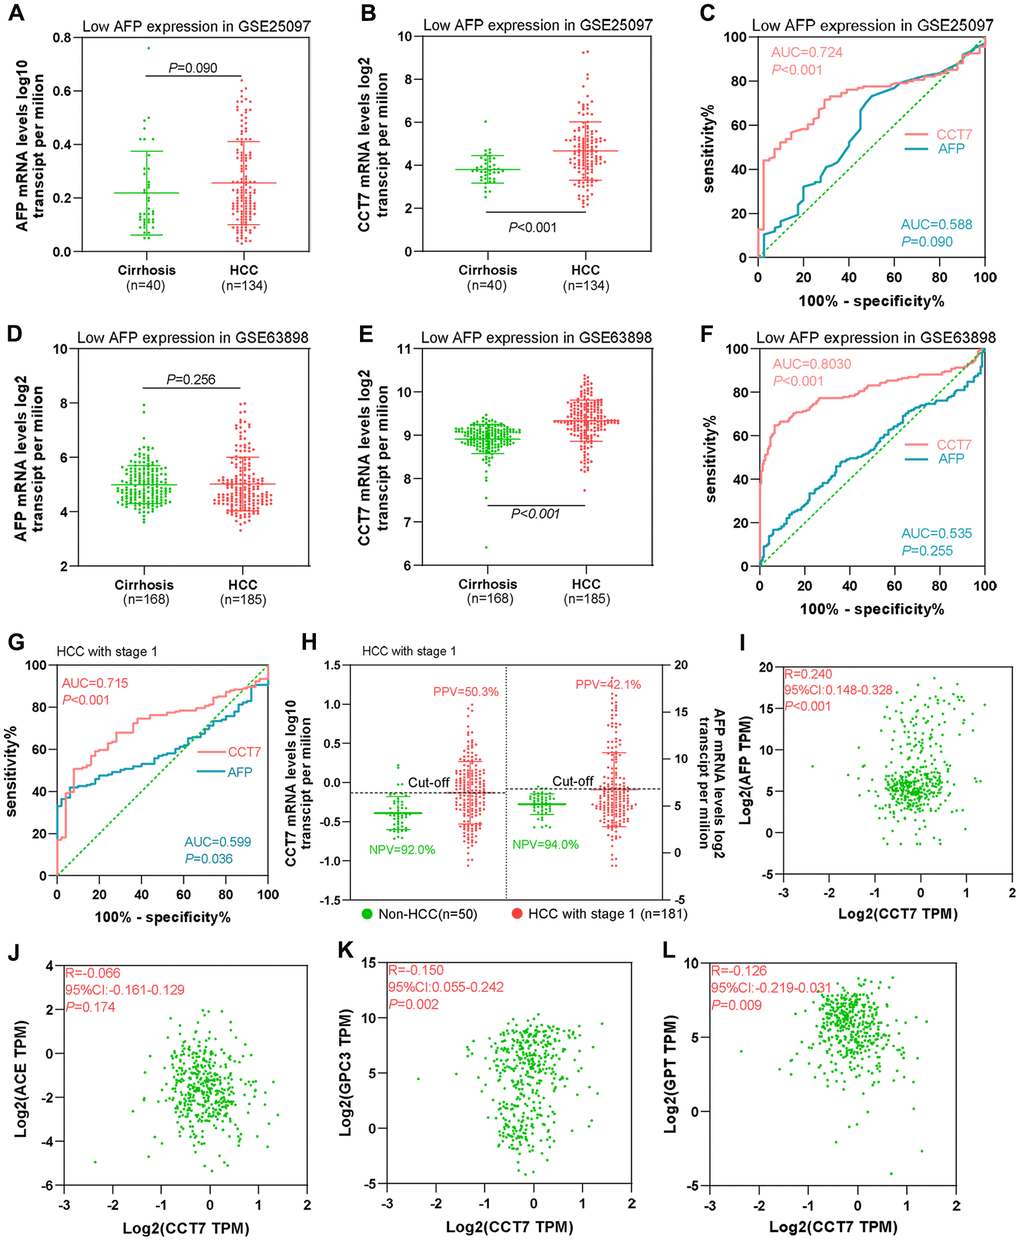
Figure 5. CCT7 has better diagnostic value than AFP for HCC patients with low AFP expression and early-stage disease. (A, B) AFP (A) and CCT7 (B) mRNA expression in tissues from cirrhosis patients (n = 40) and HCC patients with low AFP expression (n = 134) in the GSE25097 dataset. (C) ROC curve analysis showing the diagnostic value of AFP and CCT7 in HCC patients with low AFP expression in the GSE25097 dataset. (D, E) AFP (D) and CCT7 (E) mRNA expression in tissues from cirrhosis patients (n = 168) and HCC patients with low AFP expression (n = 185) in the GSE63898 dataset. (F) ROC curve analysis showing the diagnostic value of AFP and CCT7 in HCC patients with low AFP expression in the GSE63898 dataset. (G) ROC curve analysis showing the diagnostic value of AFP and CCT7 in stage 1 HCC patients from TCGA. (H) The PPV and NPV of AFP and CCT7 in stage 1 HCC patients from TCGA. (I–L) The correlations of CCT7 levels with AFP (I), ACE (J), GPC3 (K) and GPT (L) levels.
CCT7 is a better diagnostic biomarker than AFP for early-stage HCC patients
Next, we used TCGA to evaluate the diagnostic efficiency of CCT7 mRNA expression in early-stage HCC patients. ROC curve analyses revealed that CCT7 had a significantly higher AUC than AFP for stage 1 HCC patients (Figure 5G). In addition, CCT7 mRNA expression had a higher PPV than AFP in stage 1 HCC patients from TCGA (50.3% vs. 42.1%), while the two genes had similar NPVs (92.0% vs. 94.0%, Figure 5H). We also investigated the correlation of CCT7 levels with those of previously identified diagnostic biomarkers [17–19], and obtained the following correlation coefficients: AFP, r = 0.240; angiotensin converting enzyme (ACE), r = 0.066; glypican 3 (GPC3), r = −0.150; and glutamic-pyruvic transaminase (GPT), r = −0.126 (Figure 5I–5L). These results suggested that CCT7 expression could be used as an independent diagnostic biomarker for HCC patients.
Dysregulation of CCT7 expression is associated with DNA methylation status in HCC patients
Our data indicated that CCT7 mRNA expression was frequently upregulated in HCC patients, and further analyses revealed that this dysregulation was associated with copy number alterations (Figure 6A). When we evaluated Illumina Human Methylation 450 datasets in TCGA, we found that CCT7 mRNA expression was negatively associated with DNA methylation status (Figure 6B). Using the MethSurv database, we identified three CCT7-related methylated CpG sites in HCC: cg15777261, cg07135469 and cg19515186 (Figure 6C). One of these CpG sites (cg19515186) was associated with the survival times of HCC patients (P < 0.001, HR (95% CI): 0.49 (0.34–0.72); Figure 6D). A correlation analysis also revealed that the methylation status of cg19515186 was negatively associated with CCT7 mRNA expression (Figure 6E). Furthermore, ROC curve analysis indicated that the methylation status of cg19515186 had significant diagnostic value for HCC in TCGA (AUC = 0.821, P < 0.001, Figure 6F). We also performed a survival analysis, which revealed that higher methylation of cg19515186 was associated with better OS in HCC patients (Figure 6G). These results demonstrated that CCT7 expression is associated with the DNA methylation status of HCC patients.
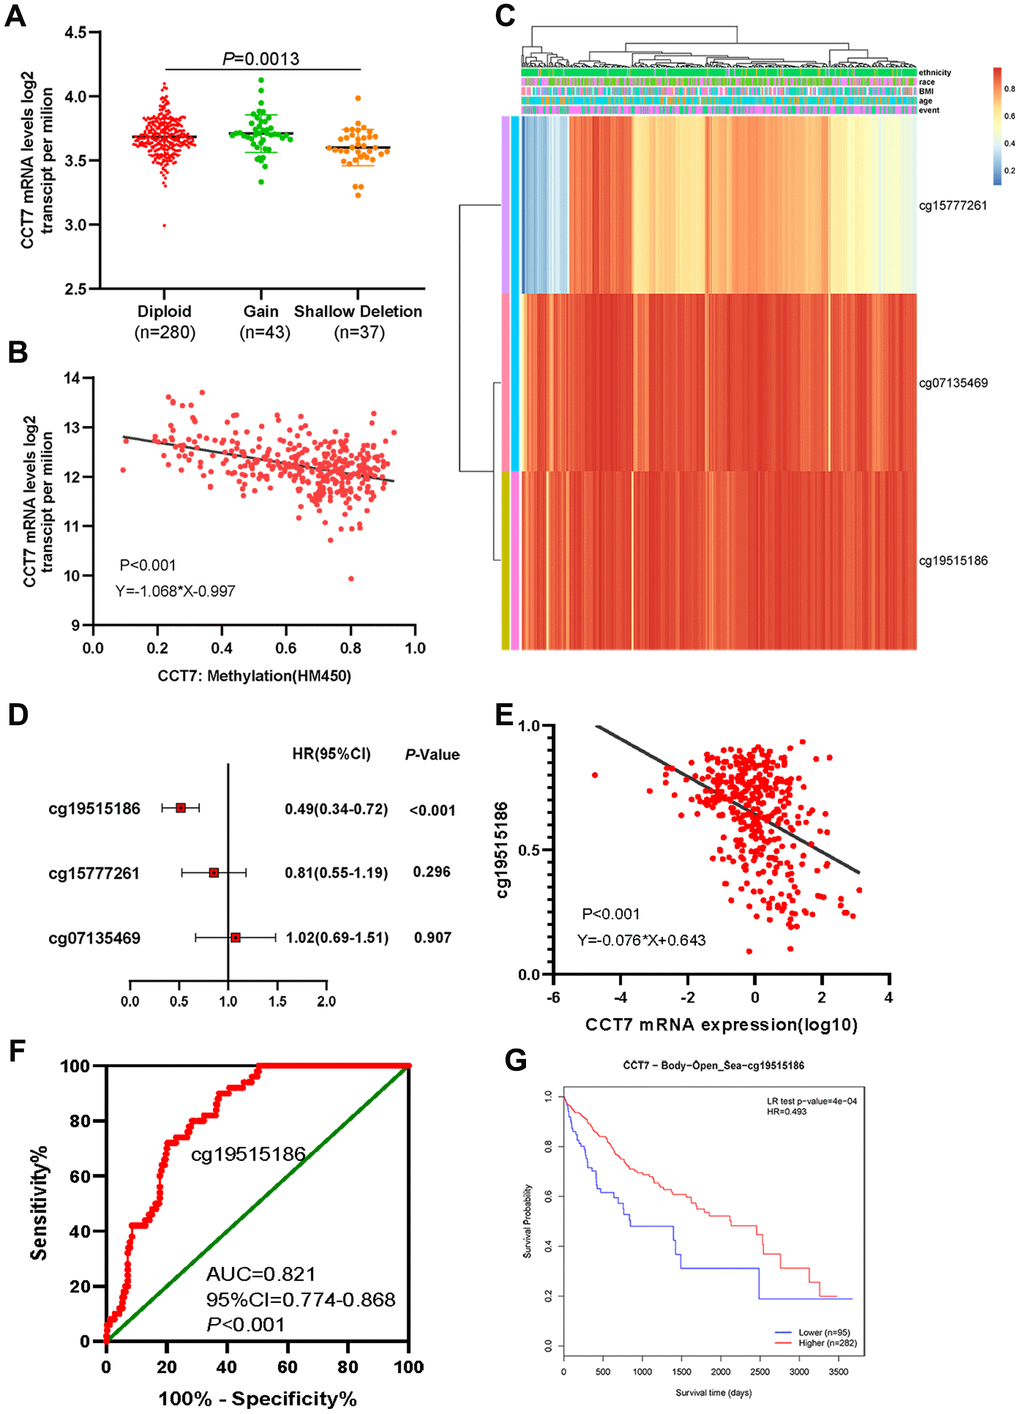
Figure 6. Dysregulated CCT7 expression is associated with DNA methylation status in HCC patients. (A) CCT7 mRNA expression in different copy number groups. (B) The correlation between CCT7 mRNA expression and DNA methylation status. (C) The heat map shows CCT7-related methylated CpG sites in HCC. (D) The forest map shows the correlation between CpG site methylation and survival times in HCC patients. (E) The correlation between CCT7 mRNA expression and cg19515186 methylation status. (F) ROC curve analysis showing the significant diagnostic value of cg19515186 methylation status for HCC in TCGA. (G) Survival analysis showing that higher methylation of cg19515186 was associated with better OS in HCC patients.
Genetic alterations of CCT7 are associated with poorer survival in HCC patients
We then used the cBioPortal database to search for genetic alterations of CCT7 in a cohort of 348 HCC patients. We detected genetic alterations of CCT7 in 143 (41%) of the queried patients, including 1 case of a missense mutation, 14 cases of low expression and 128 cases of high expression (Figure 7A). In addition, we found a mutational hotspot of 1479F/Missense in 104 samples (Figure 7B). Somatic mutations of CCT7 were observed in 0.3% of the patients. Kaplan-Meier survival analyses demonstrated that, compared with HCC patients without CCT7 alterations, HCC patients with CCT7 alterations had poorer OS (P = 6.568e-03, Figure 7C), disease-free survival (P = 5.715e-03, Figure 7D), progression-free survival (P = 2.150e-02, Figure 7E) and disease-specific survival (P = 4.0e-02, Figure 7F). A Spearman’s correlation analysis revealed that CCT7 mRNA expression correlated positively with other prognostic biomarkers in HCC patients (Ki67: r = 0.230, P < 0.001; proliferating cell nuclear antigen [PCNA]: r = 0.307, P < 0.001; Figure 7G and 7H).
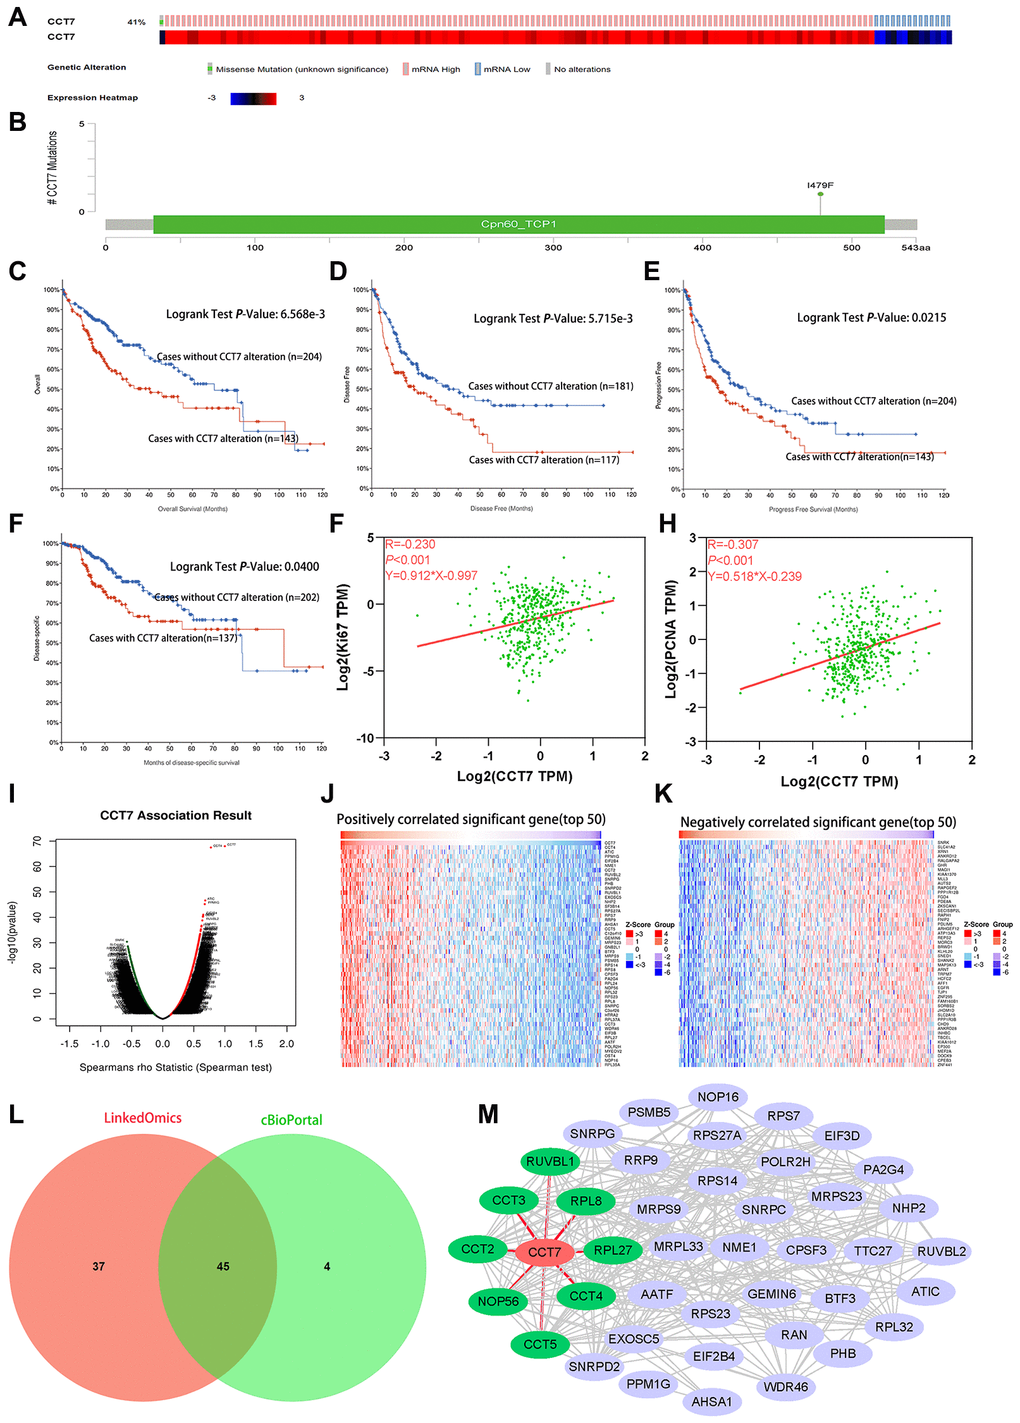
Figure 7. Genetic alterations of CCT7 are associated with poorer survival in HCC patients. (A) CCT7 was genetically altered in 143 patients (41%) from a cohort of 348 HCC patients. (B) A mutational hotspot of 1479F/Missense was found in 104 patients. (C–F) Survival analyses showing that HCC patients with CCT7 alterations had poorer OS (C), disease-free survival (D), progression-free survival (E) and disease-specific survival (F) than those without. (G, H) Spearman’s correlation analysis revealing that CCT7 mRNA expression correlated positively with Ki67 (G) and PCNA (H) expression. (I–K) CCT7 expression-associated target gene analysis in the LinkedOmics database. (I) Volcano chart exhibiting genes with significant positive/negative correlations with CCT7 expression. (J) Top 50 genes that were positively associated with CCT7 expression. (K) Top 50 genes that were negatively associated with CCT7 expression. (L) Venn plot showing the overlapping genes from the LinkedOmics and cBioPortal databases with Spearman’s values greater than 0.55. (M) PPI network for 45 genes co-expressed with CCT7. CCT2, CCT3, CCT4, CCT5, NOP56, RPL8, RPL27 and RUVBL1 were found to interact with CCT7.
Analysis of genes co-expressed with CCT7 in HCC patients
Subsequently, we used LIHC datasets from the LinkedOmics and cBioPortal databases to identify genes that correlated with CCT7 in their expression. A volcano plot and heat map were used to depict the 11319 genes that correlated negatively with CCT7 and the 8670 genes that correlated positively with CCT7 in the LinkedOmics database (Figure 7I–7K). We selected overlapping genes from the two databases with Spearman’s values greater than 0.55, and thus identified 45 genes that were co-expressed with CCT7 (Figure 7L).
Next, we used the Search Tool for the Retrieval of Interacting Genes (STRING) database to identify significant interactions among CCT7 and its 45 co-expressed genes, based on confidence scores greater than 0.9. A protein-protein interaction (PPI) network with 42 nodes and 288 edges was constructed and visualized using Cytoscape software. Eight proteins (CCT2, CCT3, CCT4, CCT5, nucleolar protein 56 [NOP56], ribosomal protein L8 [RPL8], RPL27 and RuvB-like AAA ATPase 1 [RUVBL1]) directly interacted with CCT7 in the PPI network (Figure 7M). Using the TNMplot database, we found that the mRNA levels of these eight genes increased incrementally from normal tissues to HCC tissues to metastatic HCC tissues (Figure 8A a–h). When we performed a survival analysis in the Gene Expression Profiling Interactive Analysis (GEPIA) database, we found that higher levels of these eight genes were associated with poorer OS in HCC patients (Figure 8B a–h). The significant positive correlations between the levels of CCT7 and these eight genes were validated in TCGA (Figure 8C a–h).
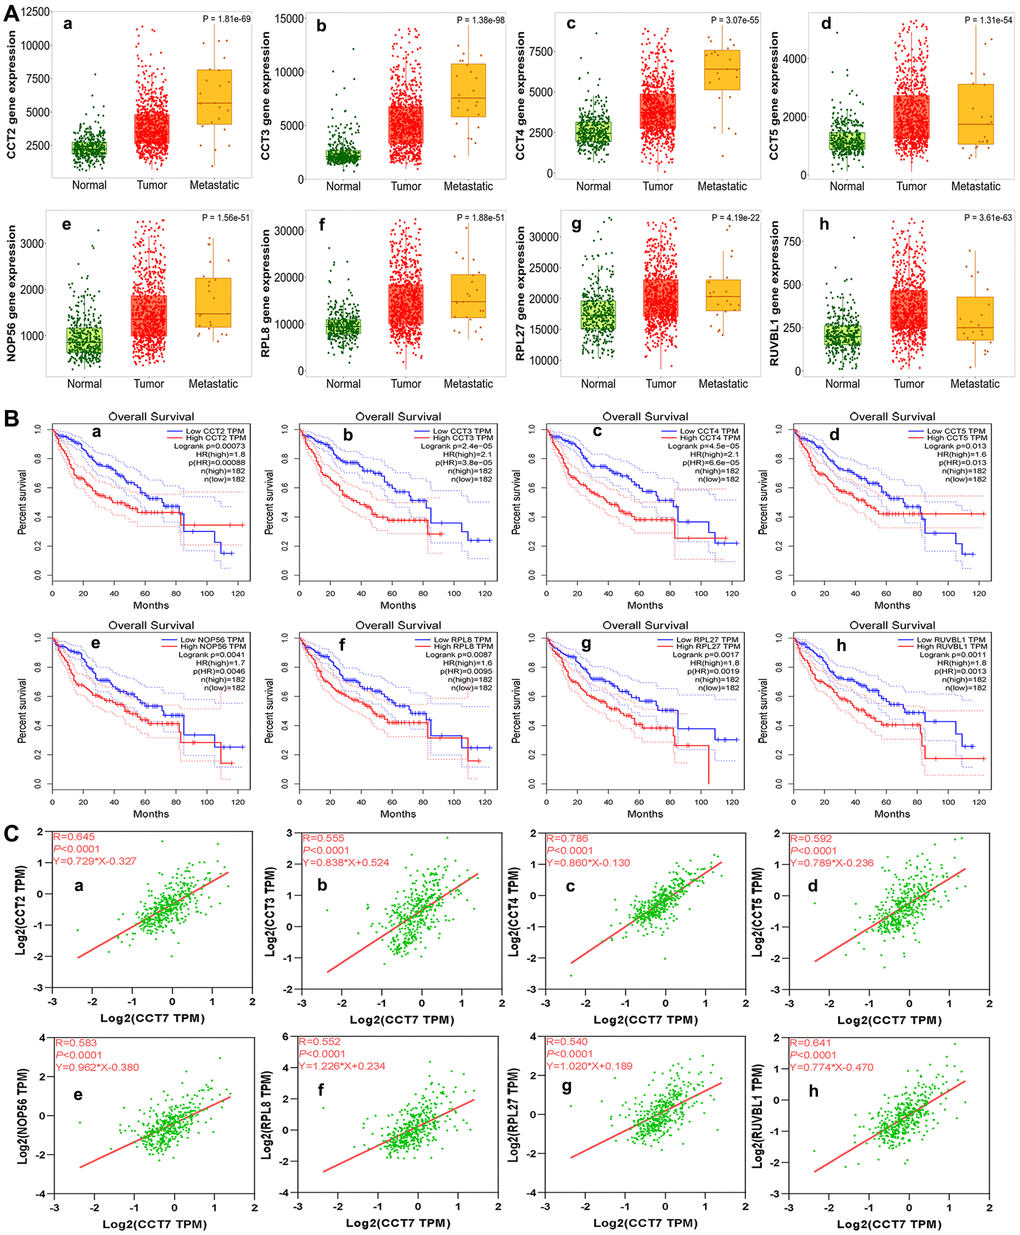
Figure 8. Analysis of genes co-expressed with CCT7 in HCC patients. (A) The mRNA levels of CCT2 (a), CCT3 (b), CCT4 (c), CCT5 (d), NOP56 (e), RPL8 (f), RPL27 (g) and RUVBL1 (h) in normal, tumor and metastatic tissues. (B) Survival analysis showing associations of CCT2 (a), CCT3 (b), CCT4 (c), CCT5 (d), NOP56 (e), RPL8 (f), RPL27 (g) and RUVBL1 (h) mRNA levels with the OS of HCC patients (all P < 0.05). (C) Correlation of CCT7 levels with CCT2 (a), CCT3 (b), CCT4 (c), CCT5 (d), NOP56 (e), RPL8 (f), RPL27 (g) and RUVBL1 (h) levels.
High CCT7 expression correlates with the spliceosome signaling pathway
We then used the Database for Annotation, Visualization and Integrated Discovery (DAVID) to perform GO and KEGG analyses on the 45 genes co-expressed with CCT7. In the GO Biological Process analysis, the co-expressed genes were most enriched in ‘mRNA splicing via spliceosome’, ‘rRNA processing’, ‘protein folding’ and ‘translation’ (Figure 9A). We also performed GO enrichment analyses for Cellular Component and Molecular Function (Supplementary Figure 1). In the KEGG analysis, the ‘ribosome’, ‘spliceosome’, ‘purine metabolism’ and ‘ribosome biogenesis in eukaryotes’ were greatly enriched (Figure 9B). We then analyzed the KEGG pathways of the enriched genes that were most relevant to the survival of HCC patients in the GEPIA database (listed in Supplementary Table 1). The KEGG analysis revealed that the spliceosome pathway correlated significantly with the prognosis of HCC patients (Figure 9C).
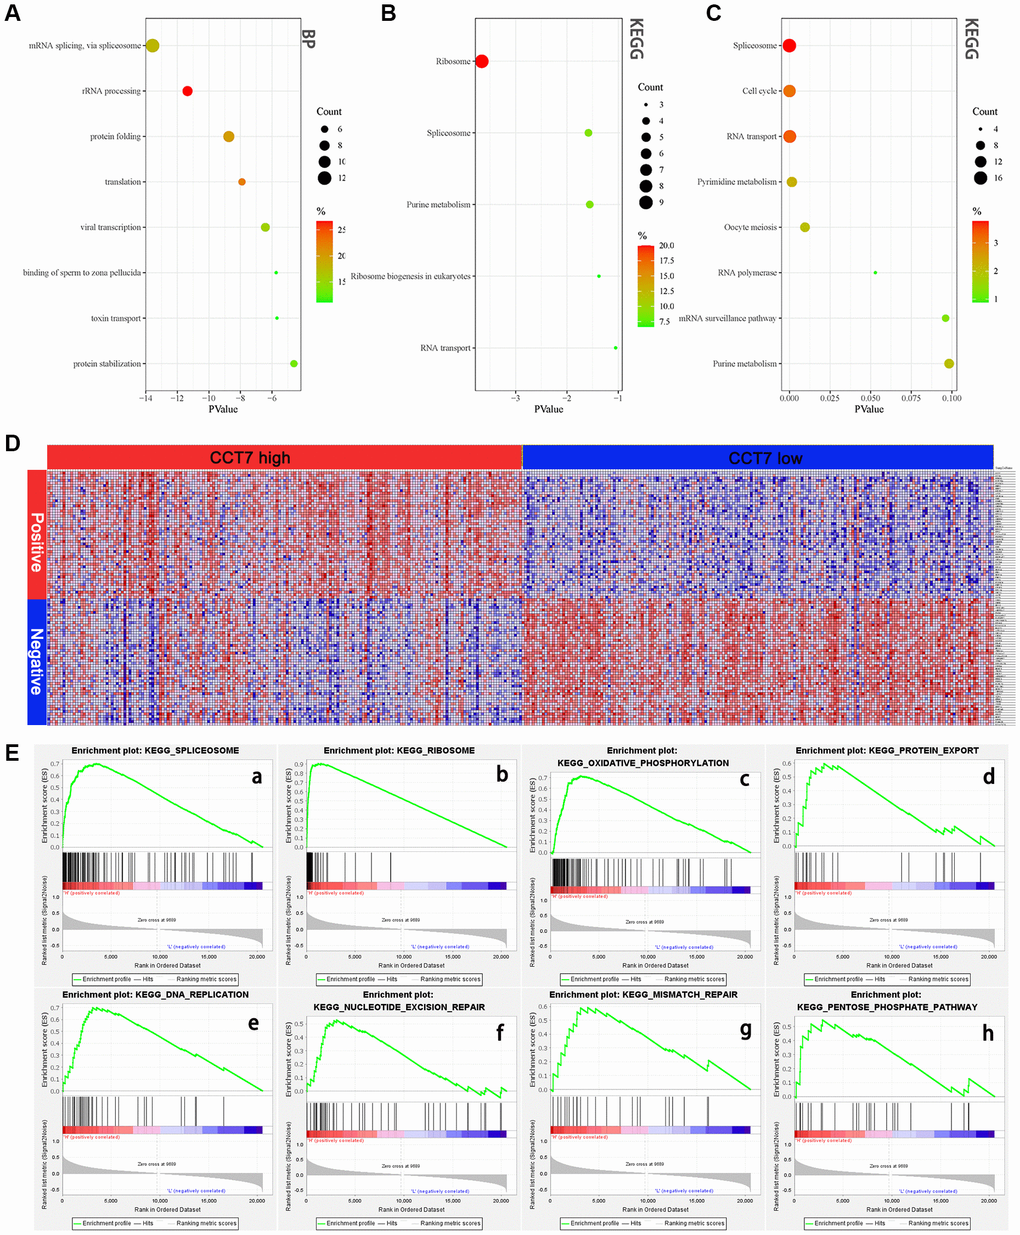
Figure 9. High CCT7 expression is associated with spliceosome gene expression in HCC patients. (A, B) The 45 genes co-expressed with CCT7 in HCC tissues, based on the GO Biological Process analysis (A) and KEGG pathway analysis (B). (C) The most significant survival-associated genes in HCC tissues, based on KEGG pathway analysis of data from the GEPIA database. (D) Heat map showing the median mRNA levels of genes co-expressed with CCT7 in HCC tissues in the GSEA. (E) The main enriched KEGG pathways of CCT7 based on GSEA. SPLICEOSOME (a), RIBOSOME (b), OXIDATIVE PHOSPHORYLATION (c), PROTEIN EXPORT (d), DNA REPLICATION (e), NUCLEOTIDE EXCISION PEPAIR (f), MISMATCH REPAIR (g), PENTOSE PHOSPHATE PATHWAY (h).
To further investigate the potential pathways whereby CCT7 promotes the tumorigenesis and development of HCC, we performed a GSEA. The genes co-expressed with CCT7 in HCC tissues are shown in Figure 9D, and the top eight differentially regulated pathways are shown in (Figure 9E a–h). The normalized enrichment score (NES) for the spliceosome signaling pathway was 2.09, demonstrating that this pathway correlated positively with HCC tumorigenesis and progression. These results revealed that CCT7 mRNA expression correlated positively with the spliceosome signaling pathway in HCC (Figure 10).
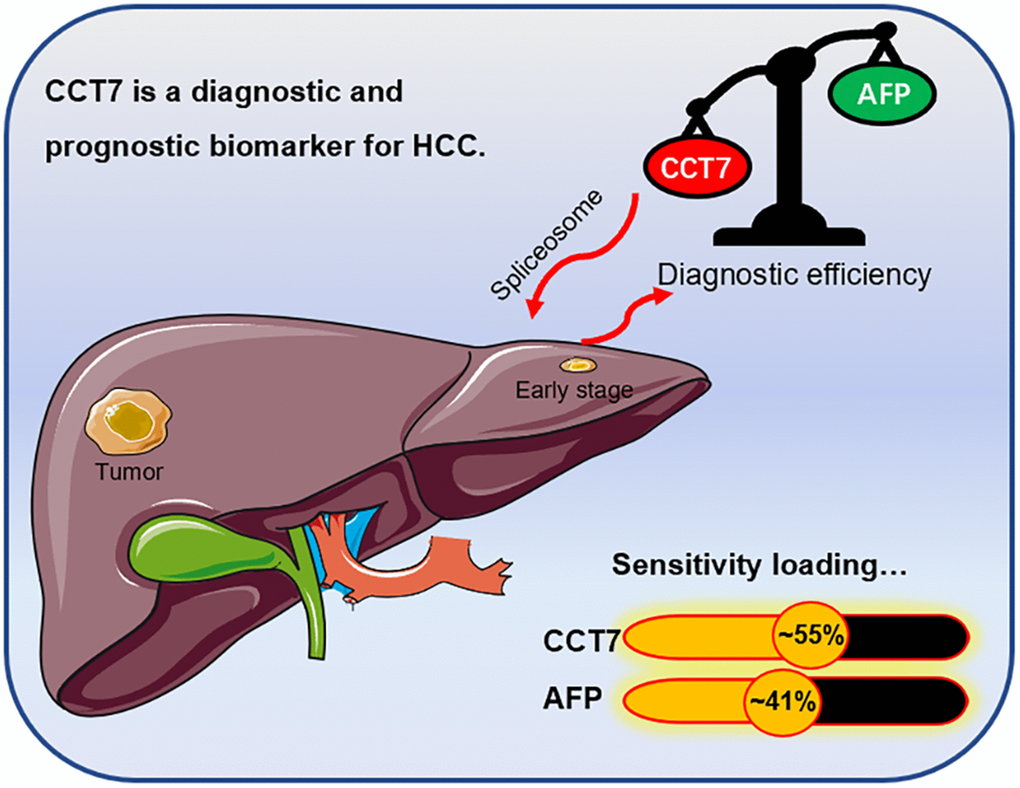
Figure 10. Graphical representation of the diagnostic sensitivity of CCT7 and AFP in HCC patients from TCGA. CCT7 exhibited significantly greater diagnostic value than AFP. CCT7 functions as an oncogene that promotes HCC tumorigenesis and progression through the spliceosome signaling pathway.
Discussion
Numerous studies have demonstrated that various CCT subunits significantly induce tumor proliferation and migration in various cancers [10, 20, 21]. Huang et al. reported that CCT8 was upregulated in HCC and promoted cancer cell proliferation [22]. In addition, Zhang et al. demonstrated that CCT3 promoted HCC cell proliferation by facilitating mitosis and suppressing apoptosis [23]. CCT4, CCT6A and CCT6B were determined to have diagnostic and prognostic value for HCC [16]. Although CCT7 was found to be highly expressed in HCC tissues in a bioinformatic analysis [15], the present study is the first systematic investigation of the diagnostic value, clinical significance and function of CCT7 in HCC.
We found that CCT7 mRNA expression was significantly greater in HCC samples than in normal tissues. CCT7 expression increased incrementally with increasing cancer stages and tumor grades, and was greater in metastatic than in non-metastatic tumor samples. Our correlation analyses suggested that higher CCT7 expression was associated with worse clinicopathological features and was an independent risk factor for worse OS and RFS. CCT7 protein expression was also significantly upregulated in HCC tissues compared with adjacent normal tissues, and higher CCT7 protein levels were associated with poorer clinicopathological features. These results demonstrated that CCT7 can be used as a diagnostic and prognostic biomarker of HCC.
The current gold-standard biomarker for diagnosing HCC is AFP [24, 25]; however, its sensitivity is not satisfactory, especially in AFP-negative patients. We thus compared the diagnostic efficiencies of CCT7 and AFP using independent datasets from the GEO and TCGA databases. In ROC curve analyses, CCT7 had a higher AUC than AFP. CCT7 also exhibited a better PPV than AFP, and was highly expressed in HCC patients with low AFP expression, suggesting that CCT7 has greater diagnostic significance than AFP in such patients. Moreover, in patients with early-stage HCC, CCT7 had a better AUC (0.715 vs. 0.599) and PPV (50.3% vs. 42.1%) than AFP in TCGA. It should be noted that our results were based on an HCC tissue mRNA assay rather than a serum analysis. Nevertheless, a previous study demonstrated that serum CCT3 was a potential biomarker of liver cancer with a better diagnostic capacity than AFP in certain regards [8]. Further experimental research is needed to evaluate the clinical diagnostic applicability of CCT7 for HCC patients.
DNA methylation is dysregulated in virtually all forms of cancer, and has been shown to silence a broad range of genes in different cancer types [26–28]. We found that the upregulation of CCT7 was associated with the hypomethylation of the CpG site cg19515186. In addition, greater methylation of cg19515186 was associated with better OS in HCC patients. These results demonstrated that CCT7 expression is associated with DNA methylation status in HCC patients.
Next, we investigated the function of CCT7 in HCC by performing GO, KEGG and GSEA studies. Each of these analyses revealed that CCT7 was involved in the spliceosome signaling pathway. Spliceosome signaling contributes significantly to the tumorigenesis and progression of several types of tumors [29–32], and previous research has suggested that CCT7 promotes the progression of endometrial cancer through this pathway [33]. Interestingly, in our study, the genes enriched in the spliceosome pathway were among those most relevant to the survival of HCC patients in the GEPIA database. Thus, CCT7 seems to function as an oncogene that enhances HCC tumorigenesis and progression through the spliceosome signaling pathway.
In previous studies, siRNA-induced depletion of CCT3 and CCT8 was found to block S-phase entry and inhibit the proliferation of HCC cells [22, 34]. In addition, the knockdown of CCT3 was shown to inhibit the activation of signal transducer and activator of transcription 3. Xu and colleagues reported that CCT5 was the direct target of miR-139-5p and promoted the progression of HCC through the spliceosome pathway [35]. To the best of our knowledge, no previous studies have described the molecular mechanisms of CCT7 activity in HCC; however, consistent with the known functions of CCT3 and CCT5 in HCC, our study revealed that CCT7 promotes the progression of HCC through the spliceosome pathway. Therefore, it is reasonable to hypothesize that CCT7 regulates signal transducer and activator of transcription 3, thus influencing the cell cycle. This possibility requires further research.
There has been increasing interest in the therapeutic potential of splicing modulation in spliceosome-mutant cancers [36, 37]. Seiler et al. found that the orally available small-molecule splicing modulator H3B-8800 could potently kill spliceosome-mutant epithelial and hematologic tumor cells [38]. Our results indicated that 41% of queried HCC patients exhibited genetic alterations in CCT7, and such alterations predicted a poor prognosis. Thus, drugs designed to address CCT7 alterations could be useful for the treatment of HCC.
In summary, the present study demonstrated that CCT7 mRNA and protein levels were significantly greater in HCC tissues than in adjacent normal liver tissues. Higher CCT7 levels were associated with poorer clinical outcomes and prognoses. CCT7 was found to be an effective diagnostic and prognostic biomarker for HCC patients, especially low-AFP-expressing and early-stage patients. The upregulation of CCT7 was associated with the hypomethylation of the CpG site cg19515186. CCT7 was found to function as an oncogene that promotes HCC tumorigenesis and progression through the spliceosome signaling pathway.
Materials and Methods
Gene expression analysis
We analyzed CCT7 mRNA levels using the UALCAN database [39], which visualizes data from TCGA [40]. The TNMplot database (https://tnmplot.com/analysis/) was used to compare CCT7 mRNA levels between metastatic and non-metastatic tumors [41]. The GEPIA database (http://gepia.cancer-pku.cn/) was used to analyze the association of CCT7 mRNA expression with OS and RFS [42]. The Human Protein Atlas database (https://www.proteinatlas.org/) was used to evaluate CCT7 protein expression [43]. We also used GEO (GSE76247, GSE54236, GSE136247, GSE25097 and GSE63898) [44] and TCGA datasets to analyze the mRNA levels and compare the diagnostic efficiencies of CCT7 and AFP.
Prognostic value analysis using CCT7 mRNA expression and clinicopathological data from TCGA
We downloaded RNAseq data and clinical characteristics from TCGA to determine the relationship between CCT7 expression and clinical outcomes in HCC patients. To evaluate the prognostic value of CCT7, we divided 372 HCC patients into high and low expression groups based on their CCT7 mRNA levels. We defined OS as the time interval between surgery and death or between surgery and the last observation point. We defined RFS as the time interval between the date of surgery and the date of diagnosis of any type of recurrence [45].
Prognostic value analysis using CCT7 protein expression and clinicopathological data from a cohort of 118 HCC patients
To further investigate the association of CCT7 protein expression with clinical outcomes, we performed immunohistochemical staining using 118 HCC tissues and paired adjacent normal liver tissues. The tissues were collected from patients who underwent hepatectomies at the 900th Hospital of the Joint Logistics Team from February 2013 to November 2014. The shortest follow-up time was five years. Follow-up data were obtained through re-examinations, telephone calls and the Social Security Death Index. Liver function and tumor stages were assessed using the Child-Pugh classification and the 2010 International Union Against Cancer TNM classification system, respectively [46, 47]. Patients met the inclusion criteria if they had one or more lesions confined to one liver lobe, had no distant metastases, had not received chemotherapy, TACE or immunotherapy before surgery, and were confirmed to have HCC based on postoperative pathology. This study was performed in accordance with the principles of the Declaration of Helsinki, and was approved by the Human Research Ethics Committee of the 900th Hospital of the Joint Logistics Team (Fuzhou, China). All participants provided written informed consent before surgery and specimen collection.
Immunohistochemical analysis
The 118 HCC specimens were cut into 4-μm sections and fixed on glass slides for microscopy. The tissue sections on the slides were then deparaffinized and rehydrated using gradient concentrations of malondialdehyde and ethanol. Next, the slides were immersed in boiling Tris/ethylenediaminetetraacetic acid (pH 9.0) for 20 minutes for antigen retrieval. The slides were subsequently immersed in 3% H2O2 for 10 minutes to inhibit endogenous peroxidase. Then, the slides were incubated with a primary antibody against CCT7 (1:250; 15994-1-AP; Proteintech, Wuhan, China), followed by the secondary antibody (1:50,000; KIT-5010, anti-rabbit/mouse IgG; Maixin Biotechnology Development Co., Ltd., Fuzhou, China), and were washed three times with phosphate-buffered saline. Finally, the sections were stained with 3,3'-diaminobenzidine and substrate chromogen (Dako) for 2 minutes at room temperature and then counterstained with hematoxylin for 40 seconds. Slides incubated only with the secondary antibody without the primary antibody were used as the negative control. The immunohistochemical staining was assessed by two separate pathologists who were blinded to patients’ information. CCT7 protein expression was assessed on the following five-point scale: 0, no positive cells; 1, <25% positive cells; 2, 26–50% positive cells; 3, 51–75% positive cells; and 4, >75% positive cells.
DNA methylation and genetic alteration of CCT7 in HCC
We used RNAseq and Illumina Human Methylation 450 datasets from TCGA (https://xenabrowser.net/datapages/) [48] to obtain gene expression and DNA methylation data, respectively. Then, we analyzed the correlation between CCT7 mRNA expression and DNA methylation. To identify CpG sites that influenced mRNA expression, we used MethSurv, a web tool that performs multivariable survival analyses using DNA methylation data [49]. We investigated genetic alterations and mutational hotspots in CCT7 using the LIHC (TCGA, Firehose Legacy) dataset from the cBioPortal database (http://www.cbioportal.org/) [50]. Then, we analyzed the correlation between genetic alterations in CCT7 and the prognoses of HCC patients.
GO and KEGG enrichment analyses and PPI network construction
We used LIHC datasets from the cBioPortal and LinkedOmics databases [51] to identify genes that correlated with CCT7 in their expression. Overlapping genes from cBioPortal and LinkedOmics with Spearman’s correlation values greater than 0.55 were selected as the co-expressed genes of CCT7. Next, the Functional Annotation Tool in DAVID was used to perform GO and KEGG enrichment analyses on these genes, in order to explore their potential involvement in HCC tumorigenesis and progression [52]. We also constructed a PPI network from these genes in the STRING database, and visualized the network using Cytoscape software (Version 3.7.2) [53]. For the GO and KEGG enrichment analyses, P < 0.05 and a false discovery rate <0.25 were considered statistically significant.
GSEA
Normalized gene expression data from 373 HCC samples were downloaded from TCGA, and the samples were divided into high and low expression groups based on the median CCT7 expression value. Then, GSEA software (Version 4.1.2) was used to perform KEGG enrichment analyses. In this process, "c2.cp.kegg.v7.0.symbols.gmt" was selected as the functional gene set, and the number of permutations was set to 1000. The default settings were used for all other parameters. Pathways and genes with normal P-values <0.05 and false discovery rate q-values <0.25 were considered significantly enriched.
Statistical analysis
Statistical analyses were performed and figures were generated using GraphPad Prism 6.0 (GraphPad Software, Inc., San Diego, CA, USA). The associations between CCT7 mRNA levels and clinicopathological characteristics were analyzed using two-tailed Student’s t-tests, Fisher’s exact tests or Wilcoxon’s tests. Pearson’s chi-square test was used to compare categorical variables. The Kaplan-Meier method was used with the log-rank test to generate OS and RFS curves. Univariate and multivariate analyses with Cox’s proportional regression models were used to predict the risk factors and independent risk factors affecting survival in HCC patients. The AUCs of ROC curves were used to estimate the diagnostic value of CCT7 mRNA expression and cg19515186 DNA methylation for HCC. P < 0.05 was defined as a statistically significant difference unless otherwise stated.
Availability of data and materials
All data generated or analyzed during this study are included in this published article.
Ethics approval and consent to participate
This study was performed according to the relevant medical ethics regulations and approved by the Human Research Ethics Committee of the 900th Hospital of the Joint Logistics Team (Fuzhou, China). All participants gave written informed consent prior to surgery and specimen collection.
Author Contributions
Conception and design: Yi Jiang, Xinghua Huang; administrative support: Yi Jiang, Xinghua Huang; provision of study materials or patients: Xinghua Huang, Huaxiang Wang, Fengfeng Xu, Lizhi Lv; collection and assembly of data: Xinghua Huang, Huaxiang Wang, Fengfeng Xu, Lizhi Lv, Tingting Liu; data analysis and interpretation: Huaxiang Wang, Fengfeng Xu, Tingting Liu, Huanzhang Hu, Ruling Wang, Bin Jiang; supplementary mechanism experiment: Xinghua Huang, Huaxiang Wang, Fengfeng Xu, Ruling Wang, Bin Jiang, Huanzhang Hu; manuscript writing: Huaxiang Wang, Fengfeng Xu, Lizhi Lv; manuscript review and editing: Yi Jiang, Xinghua Huang; final approval of manuscript: all authors.
Acknowledgments
The authors are grateful to the GEO and TCGA contributors for granting open access to the HCC expression profile data. In addition, we would like to acknowledge all the people who have helped us with our article.
Conflicts of Interest
The authors declare no conflicts of interest related to this study.
Funding
This work was supported by The Key Project of the Natural Science Foundation of Fujian Province (No. 2020Y0078), the Surface Project of the Natural Science Foundation of Fujian Province (No. 2020J011144) and the Civil-Military Integration Project of the 900th Hospital (No. 2018J06).
References
- 1. Siegel RL, Miller KD, Fuchs HE, Jemal A. Cancer Statistics, 2021. CA Cancer J Clin. 2021; 71:7–33. https://doi.org/10.3322/caac.21654 [PubMed]
- 2. Marrero JA, Kulik LM, Sirlin CB, Zhu AX, Finn RS, Abecassis MM, Roberts LR, Heimbach JK. Diagnosis, Staging, and Management of Hepatocellular Carcinoma: 2018 Practice Guidance by the American Association for the Study of Liver Diseases. Hepatology. 2018; 68:723–50. https://doi.org/10.1002/hep.29913 [PubMed]
- 3. Forner A, Bruix J. Biomarkers for early diagnosis of hepatocellular carcinoma. Lancet Oncol. 2012; 13:750–1. https://doi.org/10.1016/S1470-2045(12)70271-1 [PubMed]
- 4. Chang YX, Lin YF, Chen CL, Huang MS, Hsiao M, Liang PH. Chaperonin-Containing TCP-1 Promotes Cancer Chemoresistance and Metastasis through the AKT-GSK3β-β-Catenin and XIAP-Survivin Pathways. Cancers (Basel). 2020; 12:3865. https://doi.org/10.3390/cancers12123865 [PubMed]
- 5. Vallin J, Grantham J. The role of the molecular chaperone CCT in protein folding and mediation of cytoskeleton-associated processes: implications for cancer cell biology. Cell Stress Chaperones. 2019; 24:17–27. https://doi.org/10.1007/s12192-018-0949-3 [PubMed]
- 6. Brackley KI, Grantham J. Activities of the chaperonin containing TCP-1 (CCT): implications for cell cycle progression and cytoskeletal organisation. Cell Stress Chaperones. 2009; 14:23–31. https://doi.org/10.1007/s12192-008-0057-x [PubMed]
- 7. Won KA, Schumacher RJ, Farr GW, Horwich AL, Reed SI. Maturation of human cyclin E requires the function of eukaryotic chaperonin CCT. Mol Cell Biol. 1998; 18:7584–9. https://doi.org/10.1128/MCB.18.12.7584 [PubMed]
- 8. Liu Y, Zhang X, Lin J, Chen Y, Qiao Y, Guo S, Yang Y, Zhu G, Pan Q, Wang J, Sun F. CCT3 acts upstream of YAP and TFCP2 as a potential target and tumour biomarker in liver cancer. Cell Death Dis. 2019; 10:644. https://doi.org/10.1038/s41419-019-1894-5 [PubMed]
- 9. Xu G, Bu S, Wang X, Zhang H, Ge H. Suppression of CCT3 inhibits the proliferation and migration in breast cancer cells. Cancer Cell Int. 2020; 20:218. https://doi.org/10.1186/s12935-020-01314-8 [PubMed]
- 10. Guest ST, Kratche ZR, Bollig-Fischer A, Haddad R, Ethier SP. Two members of the TRiC chaperonin complex, CCT2 and TCP1 are essential for survival of breast cancer cells and are linked to driving oncogenes. Exp Cell Res. 2015; 332:223–35. https://doi.org/10.1016/j.yexcr.2015.02.005 [PubMed]
- 11. Carr AC, Khaled AS, Bassiouni R, Flores O, Nierenberg D, Bhatti H, Vishnubhotla P, Manuel JP, Santra S, Khaled AR. Targeting chaperonin containing TCP1 (CCT) as a molecular therapeutic for small cell lung cancer. Oncotarget. 2017; 8:110273–88. https://doi.org/10.18632/oncotarget.22681 [PubMed]
- 12. Huang K, Zeng Y, Xie Y, Huang L, Wu Y. Bioinformatics analysis of the prognostic value of CCT6A and associated signalling pathways in breast cancer. Mol Med Rep. 2019; 19:4344–52. https://doi.org/10.3892/mmr.2019.10100 [PubMed]
- 13. Gao H, Zheng M, Sun S, Wang H, Yue Z, Zhu Y, Han X, Yang J, Zhou Y, Cai Y, Hu W. Chaperonin containing TCP1 subunit 5 is a tumor associated antigen of non-small cell lung cancer. Oncotarget. 2017; 8:64170–9. https://doi.org/10.18632/oncotarget.19369 [PubMed]
- 14. Nibbe RK, Markowitz S, Myeroff L, Ewing R, Chance MR. Discovery and scoring of protein interaction subnetworks discriminative of late stage human colon cancer. Mol Cell Proteomics. 2009; 8:827–45. https://doi.org/10.1074/mcp.M800428-MCP200 [PubMed]
- 15. Yao L, Zou X, Liu L. The TCP1 ring complex is associated with malignancy and poor prognosis in hepatocellular carcinoma. Int J Clin Exp Pathol. 2019; 12:3329–43. [PubMed]
- 16. Li W, Liu J, Zhao H. Prognostic Power of a Chaperonin Containing TCP-1 Subunit Genes Panel for Hepatocellular Carcinoma. Front Genet. 2021; 12:668871. https://doi.org/10.3389/fgene.2021.668871 [PubMed]
- 17. Yoshiji H, Noguchi R, Toyohara M, Ikenaka Y, Kitade M, Kaji K, Yamazaki M, Yamao J, Mitoro A, Sawai M, Yoshida M, Fujimoto M, Tsujimoto T, et al. Combination of vitamin K2 and angiotensin-converting enzyme inhibitor ameliorates cumulative recurrence of hepatocellular carcinoma. J Hepatol. 2009; 51:315–21. https://doi.org/10.1016/j.jhep.2009.04.011 [PubMed]
- 18. Zhou F, Shang W, Yu X, Tian J. Glypican-3: A promising biomarker for hepatocellular carcinoma diagnosis and treatment. Med Res Rev. 2018; 38:741–67. https://doi.org/10.1002/med.21455 [PubMed]
- 19. Guo W, Tan HY, Li S, Wang N, Feng Y. Glutamic-Pyruvic Transaminase 1 Facilitates Alternative Fuels for Hepatocellular Carcinoma Growth-A Small Molecule Inhibitor, Berberine. Cancers (Basel). 2020; 12:1854. https://doi.org/10.3390/cancers12071854 [PubMed]
- 20. Liu YJ, Kumar V, Lin YF, Liang PH. Disrupting CCT-β: β-tubulin selectively kills CCT-β overexpressed cancer cells through MAPKs activation. Cell Death Dis. 2017; 8:e3052. https://doi.org/10.1038/cddis.2017.425 [PubMed]
- 21. Ying Z, Tian H, Li Y, Lian R, Li W, Wu S, Zhang HZ, Wu J, Liu L, Song J, Guan H, Cai J, Zhu X, et al. CCT6A suppresses SMAD2 and promotes prometastatic TGF-β signaling. J Clin Invest. 2017; 127:1725–40. https://doi.org/10.1172/JCI90439 [PubMed]
- 22. Huang X, Wang X, Cheng C, Cai J, He S, Wang H, Liu F, Zhu C, Ding Z, Huang X, Zhang T, Zhang Y. Chaperonin containing TCP1, subunit 8 (CCT8) is upregulated in hepatocellular carcinoma and promotes HCC proliferation. APMIS. 2014; 122:1070–9. https://doi.org/10.1111/apm.12258 [PubMed]
- 23. Zhang Y, Wang Y, Wei Y, Wu J, Zhang P, Shen S, Saiyin H, Wumaier R, Yang X, Wang C, Yu L. Molecular chaperone CCT3 supports proper mitotic progression and cell proliferation in hepatocellular carcinoma cells. Cancer Lett. 2016; 372:101–9. https://doi.org/10.1016/j.canlet.2015.12.029 [PubMed]
- 24. Wang W, Wei C. Advances in the early diagnosis of hepatocellular carcinoma. Genes Dis. 2020; 7:308–19. https://doi.org/10.1016/j.gendis.2020.01.014 [PubMed]
- 25. Yim SH, Chung YJ. An Overview of Biomarkers and Molecular Signatures in HCC. Cancers (Basel). 2010; 2:809–23. https://doi.org/10.3390/cancers2020809 [PubMed]
- 26. Kulis M, Esteller M. DNA methylation and cancer. Adv Genet. 2010; 70:27–56. https://doi.org/10.1016/B978-0-12-380866-0.60002-2 [PubMed]
- 27. Klutstein M, Nejman D, Greenfield R, Cedar H. DNA Methylation in Cancer and Aging. Cancer Res. 2016; 76:3446–50. https://doi.org/10.1158/0008-5472.CAN-15-3278 [PubMed]
- 28. Villanueva A, Portela A, Sayols S, Battiston C, Hoshida Y, Méndez-González J, Imbeaud S, Letouzé E, Hernandez-Gea V, Cornella H, Pinyol R, Solé M, Fuster J, et al, and HEPTROMIC Consortium. DNA methylation-based prognosis and epidrivers in hepatocellular carcinoma. Hepatology. 2015; 61:1945–56. https://doi.org/10.1002/hep.27732 [PubMed]
- 29. Soto M, Reviejo M, Al-Abdulla R, Romero MR, Macias RIR, Boix L, Bruix J, Serrano MA, Marin JJG. Relationship between changes in the exon-recognition machinery and SLC22A1 alternative splicing in hepatocellular carcinoma. Biochim Biophys Acta Mol Basis Dis. 2020; 1866:165687. https://doi.org/10.1016/j.bbadis.2020.165687 [PubMed]
- 30. Lee SC, Abdel-Wahab O. Therapeutic targeting of splicing in cancer. Nat Med. 2016; 22:976–86. https://doi.org/10.1038/nm.4165 [PubMed]
- 31. Dvinge H, Guenthoer J, Porter PL, Bradley RK. RNA components of the spliceosome regulate tissue- and cancer-specific alternative splicing. Genome Res. 2019; 29:1591–604. https://doi.org/10.1101/gr.246678.118 [PubMed]
- 32. Zhang D, Hu Q, Liu X, Ji Y, Chao HP, Liu Y, Tracz A, Kirk J, Buonamici S, Zhu P, Wang J, Liu S, Tang DG. Intron retention is a hallmark and spliceosome represents a therapeutic vulnerability in aggressive prostate cancer. Nat Commun. 2020; 11:2089. https://doi.org/10.1038/s41467-020-15815-7 [PubMed]
- 33. Wang L, Zhou W, Li H, Yang H, Shan N. Clinical Significance, Cellular Function, and Potential Molecular Pathways of CCT7 in Endometrial Cancer. Front Oncol. 2020; 10:1468. https://doi.org/10.3389/fonc.2020.01468 [PubMed]
- 34. Cui X, Hu ZP, Li Z, Gao PJ, Zhu JY. Overexpression of chaperonin containing TCP1, subunit 3 predicts poor prognosis in hepatocellular carcinoma. World J Gastroenterol. 2015; 21:8588–604. https://doi.org/10.3748/wjg.v21.i28.8588 [PubMed]
- 35. Xu J, Zhang Y, Liu C, Yan P, Yang Z. Roles of the miR-139-5p/CCT5 axis in hepatocellular carcinoma: a bioinformatic analysis. Int J Med Sci. 2021; 18:3556–64. https://doi.org/10.7150/ijms.57504 [PubMed]
- 36. Zhan YT, Li L, Zeng TT, Zhou NN, Guan XY, Li Y. SNRPB-mediated RNA splicing drives tumor cell proliferation and stemness in hepatocellular carcinoma. Aging (Albany NY). 2020; 13:537–54. https://doi.org/10.18632/aging.202164 [PubMed]
- 37. Li Y, Gao X, Wei C, Guo R, Xu H, Bai Z, Zhou J, Zhu J, Wang W, Wu Y, Li J, Zhang Z, Xie X. Modification of Mcl-1 alternative splicing induces apoptosis and suppresses tumor proliferation in gastric cancer. Aging (Albany NY). 2020; 12:19293–315. https://doi.org/10.18632/aging.103766 [PubMed]
- 38. Seiler M, Yoshimi A, Darman R, Chan B, Keaney G, Thomas M, Agrawal AA, Caleb B, Csibi A, Sean E, Fekkes P, Karr C, Klimek V, et al. H3B-8800, an orally available small-molecule splicing modulator, induces lethality in spliceosome-mutant cancers. Nat Med. 2018; 24:497–504. https://doi.org/10.1038/nm.4493 [PubMed]
- 39. Chandrashekar DS, Bashel B, Balasubramanya SAH, Creighton CJ, Ponce-Rodriguez I, Chakravarthi BVS, Varambally S. UALCAN: A Portal for Facilitating Tumor Subgroup Gene Expression and Survival Analyses. Neoplasia. 2017; 19:649–58. https://doi.org/10.1016/j.neo.2017.05.002 [PubMed]
- 40. Weinstein JN, Collisson EA, Mills GB, Shaw KR, Ozenberger BA, Ellrott K, Shmulevich I, Sander C, Stuart JM, and Cancer Genome Atlas Research Network. The Cancer Genome Atlas Pan-Cancer analysis project. Nat Genet. 2013; 45:1113–20. https://doi.org/10.1038/ng.2764 [PubMed]
- 41. Bartha Á, Győrffy B. TNMplot.com: A Web Tool for the Comparison of Gene Expression in Normal, Tumor and Metastatic Tissues. Int J Mol Sci. 2021; 22:2622. https://doi.org/10.3390/ijms22052622 [PubMed]
- 42. Tang Z, Li C, Kang B, Gao G, Li C, Zhang Z. GEPIA: a web server for cancer and normal gene expression profiling and interactive analyses. Nucleic Acids Res. 2017; 45:W98–102. https://doi.org/10.1093/nar/gkx247 [PubMed]
- 43. Lindskog C. The potential clinical impact of the tissue-based map of the human proteome. Expert Rev Proteomics. 2015; 12:213–5. https://doi.org/10.1586/14789450.2015.1040771 [PubMed]
- 44. Edgar R, Domrachev M, Lash AE. Gene Expression Omnibus: NCBI gene expression and hybridization array data repository. Nucleic Acids Res. 2002; 30:207–10. https://doi.org/10.1093/nar/30.1.207 [PubMed]
- 45. Wang H, Xu F, Yang F, Lv L, Jiang Y. Prognostic significance and oncogene function of cathepsin A in hepatocellular carcinoma. Sci Rep. 2021; 11:14611. https://doi.org/10.1038/s41598-021-93998-9 [PubMed]
- 46. Zhao S, Wang M, Yang Z, Tan K, Zheng D, Du X, Liu L. Comparison between Child-Pugh score and Albumin-Bilirubin grade in the prognosis of patients with HCC after liver resection using time-dependent ROC. Ann Transl Med. 2020; 8:539. https://doi.org/10.21037/atm.2020.02.85 [PubMed]
- 47. Kee KM, Wang JH, Lee CM, Chen CL, Changchien CS, Hu TH, Cheng YF, Hsu HC, Wang CC, Chen TY, Lin CY, Lu SN. Validation of clinical AJCC/UICC TNM staging system for hepatocellular carcinoma: analysis of 5,613 cases from a medical center in southern Taiwan. Int J Cancer. 2007; 120:2650–5. https://doi.org/10.1002/ijc.22616 [PubMed]
- 48. Goldman MJ, Craft B, Hastie M, Repečka K, McDade F, Kamath A, Banerjee A, Luo Y, Rogers D, Brooks AN, Zhu J, Haussler D. Visualizing and interpreting cancer genomics data via the Xena platform. Nat Biotechnol. 2020; 38:675–8. https://doi.org/10.1038/s41587-020-0546-8 [PubMed]
- 49. Modhukur V, Iljasenko T, Metsalu T, Lokk K, Laisk-Podar T, Vilo J. MethSurv: a web tool to perform multivariable survival analysis using DNA methylation data. Epigenomics. 2018; 10:277–88. https://doi.org/10.2217/epi-2017-0118 [PubMed]
- 50. Buechner P, Hinderer M, Unberath P, Metzger P, Boeker M, Acker T, Haller F, Mack E, Nowak D, Paret C, Schanze D, von Bubnoff N, Wagner S, et al. Requirements Analysis and Specification for a Molecular Tumor Board Platform Based on cBioPortal. Diagnostics (Basel). 2020; 10:93. https://doi.org/10.3390/diagnostics10020093 [PubMed]
- 51. Vasaikar SV, Straub P, Wang J, Zhang B. LinkedOmics: analyzing multi-omics data within and across 32 cancer types. Nucleic Acids Res. 2018; 46:D956–63. https://doi.org/10.1093/nar/gkx1090 [PubMed]
- 52. Dennis G
Jr , Sherman BT, Hosack DA, Yang J, Gao W, Lane HC, Lempicki RA. DAVID: Database for Annotation, Visualization, and Integrated Discovery. Genome Biol. 2003; 4:P3. [PubMed] - 53. Shannon P, Markiel A, Ozier O, Baliga NS, Wang JT, Ramage D, Amin N, Schwikowski B, Ideker T. Cytoscape: a software environment for integrated models of biomolecular interaction networks. Genome Res. 2003; 13:2498–504. https://doi.org/10.1101/gr.1239303 [PubMed]