


Introduction
In women, breast cancer (BC) is one of the leading causes of death, and is the leading cause of cancer-related death [1]. Although early detection and advanced treatment methods for BC are rapidly being developed, further research is needed to clarify the underlying pathways and prognostic factors of BC. Cancer immune surveillance is a critical process whereby the immune system combats tumors [2]; thus, it is especially important to determine the immune escape mechanisms of BC and identify more effective immunotherapeutic targets so that BC patients can be treated more precisely.
The tumor microenvironment contributes significantly to tumor development, and is characterized by an acidic pH. ATPase H+ Transporting Accessory Protein 1 (ATP6AP1) is a component of a multi-subunit enzyme within Vacuole ATPase (V-ATPase) [3], and deficiencies in this protein can cause immunodeficiency, hepatopathy, cognitive impairment and abnormal protein glycosylation [4]. Due to its function as a proton pump, V-ATPase can help cancer cells excrete excess H+, reverse the transmembrane proton gradient and form a highly acidic extracellular environment while avoiding apoptosis [5]. A recent study indicated that salivary autoantibodies against ATP6AP1 could be used as biomarkers for the early detection of BC [3]. Therefore, ATP6AP1 may alter the immune microenvironment of BC and the prognoses of BC patients.
Severe acute respiratory syndrome coronavirus 2 (SARS-CoV-2), a novel coronavirus of the family Coronaviridae, was identified after the outbreak of the COVID-19 pandemic [6]. Other coronaviruses such as Middle East Respiratory Syndrome-related coronavirus in 2012 and Severe Acute Respiratory Syndrome coronavirus (SARS, also known as SARS-CoV-1) in 2002 have led to massive epidemics across certain continents, and have especially impacted cancer patients [7, 8]. Given the increased incidence rate of SARS-CoV-2, it is likely to co-exist with humans for a long time, like influenza. A previous report indicated that ATP6AP1 can function as a bait for the SARS-CoV-2 nsp6 non-structural protein [9]. The interactions of cancer-related proteins with viruses may alter the prognoses of cancer patients [10]; however, the effects of ATP6AP1 on the prognoses of BC patients during the COVID-19 pandemic have not been described.
In this study, we used public datasets to evaluate ATP6AP1 levels in BC tissues and to determine their correlation with clinicopathological features and patient prognoses. We also investigated tumor-immune infiltration and its association with the prognostic value of ATP6AP1 in BC. Additionally, we determined the genes and pathways associated with ATP6AP1 to clarify its function in BC.
Results
ATP6AP1 levels in BC patients
We first compared ATP6AP1 expression between BC tissues and normal tissues using the Oncomine database (Figure 1A). ATP6AP1 mRNA levels were significantly greater in BC tissues than in normal tissues in multiple datasets (P < 0.05). Then, we used Gene Expression Profiling Interactive Analysis (GEPIA) to compare ATP6AP1 mRNA levels between BC and normal tissues based on RNA sequencing data from The Cancer Genome Atlas (TCGA) and the Genotype-Tissue Expression (GTEx) database (Figure 1B). ATP6AP1 mRNA levels were also significantly upregulated in BC tissues in this analysis (all P < 0.05). We then assessed ATP6AP1 protein levels using the Human Protein Atlas (HPA) database, and found that ATP6AP1 was moderately expressed in normal breast tissues, but moderately or highly expressed in BC tissues. The representative immunohistochemistry results from the HPA database in Figure 1C and 1D illustrate that ATP6AP1 protein levels were greater in BC tissues than in normal tissues. Others were showed in the Supplementary Figure 1.
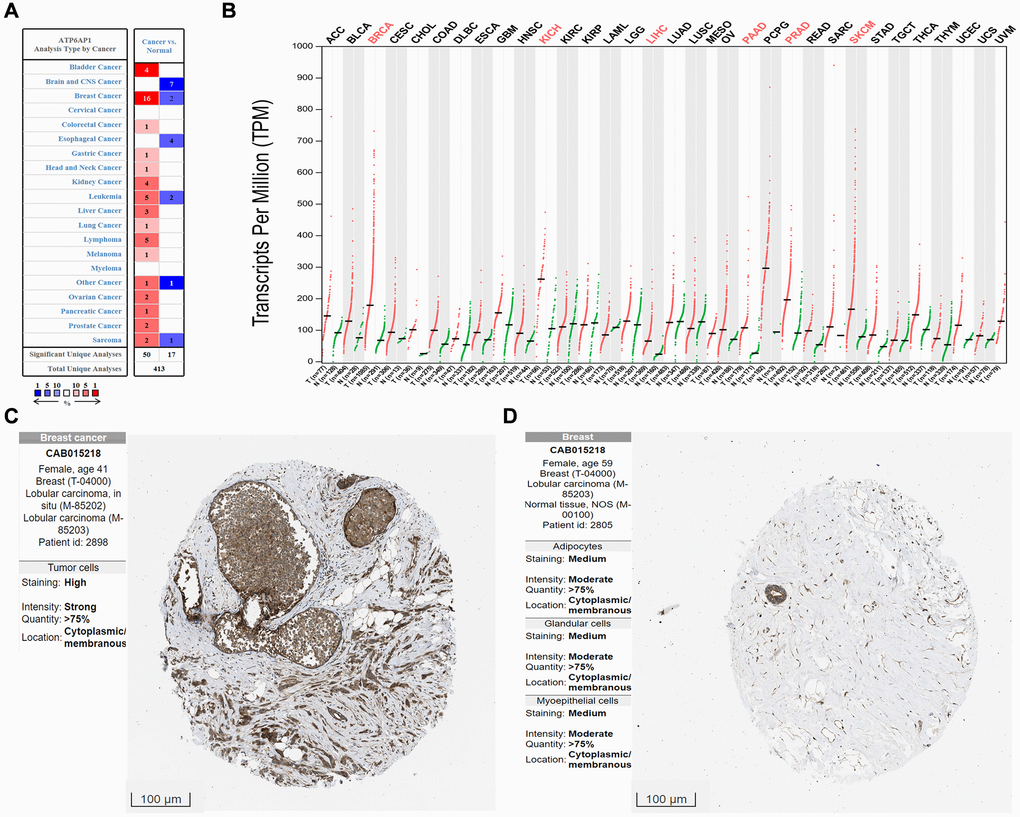
Figure 1. ATP6AP1 levels in cancer tissues compared with normal tissues. (A) ATP6AP1 mRNA levels in samples from the Oncomine database. The numbers in the colored squares represent the number of involved studies. The different colors correspond to different ATP6AP1 levels, with red representing high expression and blue representing low expression. The darker the red color, the higher the expression, and the darker the blue color, the lower the expression. (B) ATP6AP1 mRNA levels in samples from the GEPIA database. Red indicates significant results. (C, D) ATP6AP1 protein levels in normal and cancerous breast tissues based on immunohistochemistry data from the HPA database (antibody: CAB015218, provided by Origene. Dilution: 1:30).
Prognostic potency of ATP6AP1 in BC
To determine the relationship between ATP6AP1 expression and BC prognosis, we used the Kaplan-Meier Plotter to determine the overall survival (OS) and relapse-free survival (RFS) or disease-free survival (DFS) of BC patients who were separated into two groups (high and low) based on the median ATP6AP1 level. As shown in Figure 2A and 2B, higher ATP6AP1 expression was associated with a poorer BC prognosis (OS hazard ratio = 1.81, log-rank P = 0.00024; RFS hazard ratio = 1.7, log-rank P = 0.018). Data from TCGA in GEPIA confirmed that higher ATP6AP1 expression was associated with a significantly poorer prognosis in BC patients (all P < 0.05; Figure 2C and 2D).
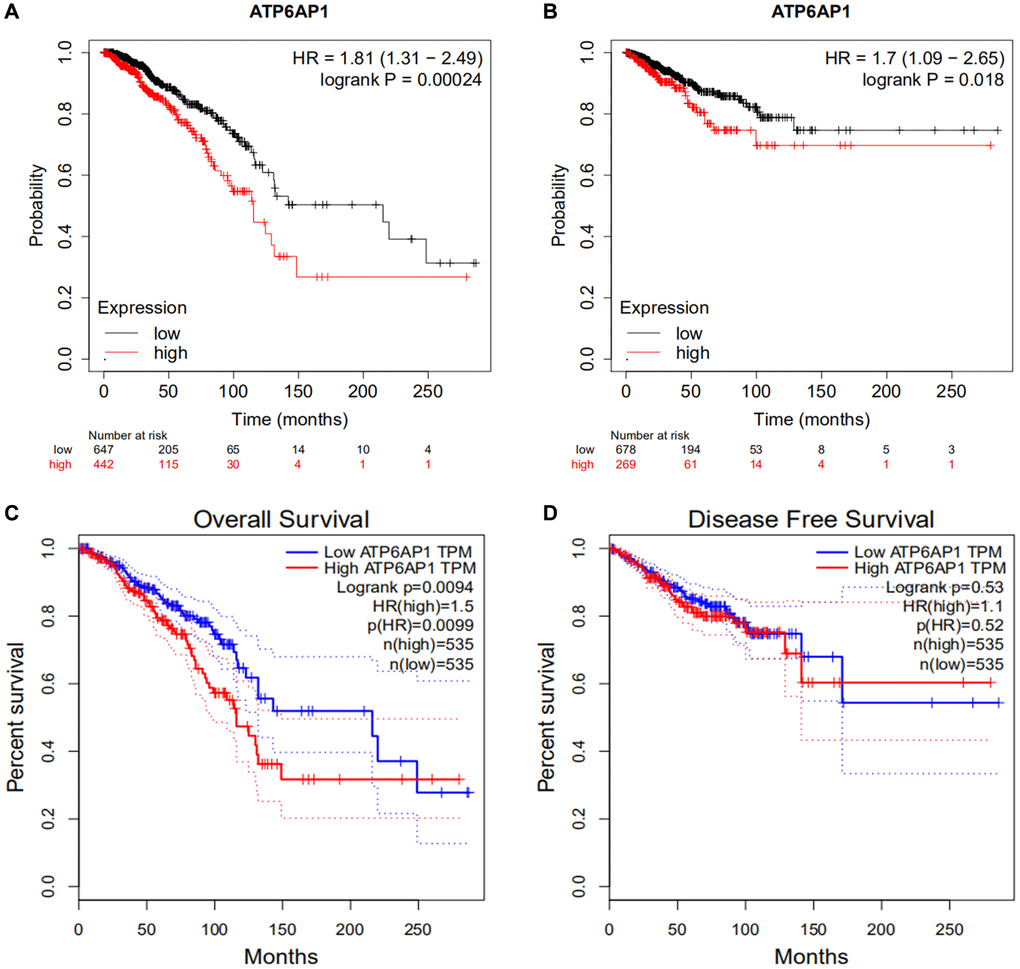
Figure 2. Survival curves in BC patients with higher and lower ATP6AP1 levels. (A, B) OS and RFS of BC patients from the Kaplan-Meier plotter database (n = 1089 and n = 947, respectively). (C, D) OS and DFS curves of BC patients from GEPIA (n = 1070 and n = 1070, respectively).
Correlation of ATP6AP1 levels with tumor-infiltrating immune cell (TIIC) and immune cell marker levels in BC
We then investigated whether ATP6AP1 expression correlated with the levels of TIICs and immune cell markers in BC through Tumor Immune Estimation Resource (TIMER). Correlation analyses revealed that ATP6AP1 levels correlated remarkably with tumor purity and to varying degrees with immune cell levels. ATP6AP1 levels were negatively associated with the levels of CD4+ T cells (Rho = –0.219, P = 2.76e-12), neutrophils (Rho = –0.194, P = 7.27e-10), type 2 T helper (Th2) cells (Rho =-0.205, P = 6.19e-11) and natural killer cells (Rho = –0.148, P = 2.67e-06) in BC tissues (Figure 3A). However, ATP6AP1 levels were positively associated with the levels of Tregs (Rho = 0.165, P = 1.07e-07), macrophages (Rho = 0.149, P = 2.52e-06) and M2 macrophages (Rho = 0.208, P = 3.71e-11). The levels of memory B cells, CD8+ T cells, type 1 T helper (Th1) cells and M0/M1 macrophages were weakly associated with ATP6AP1 levels.
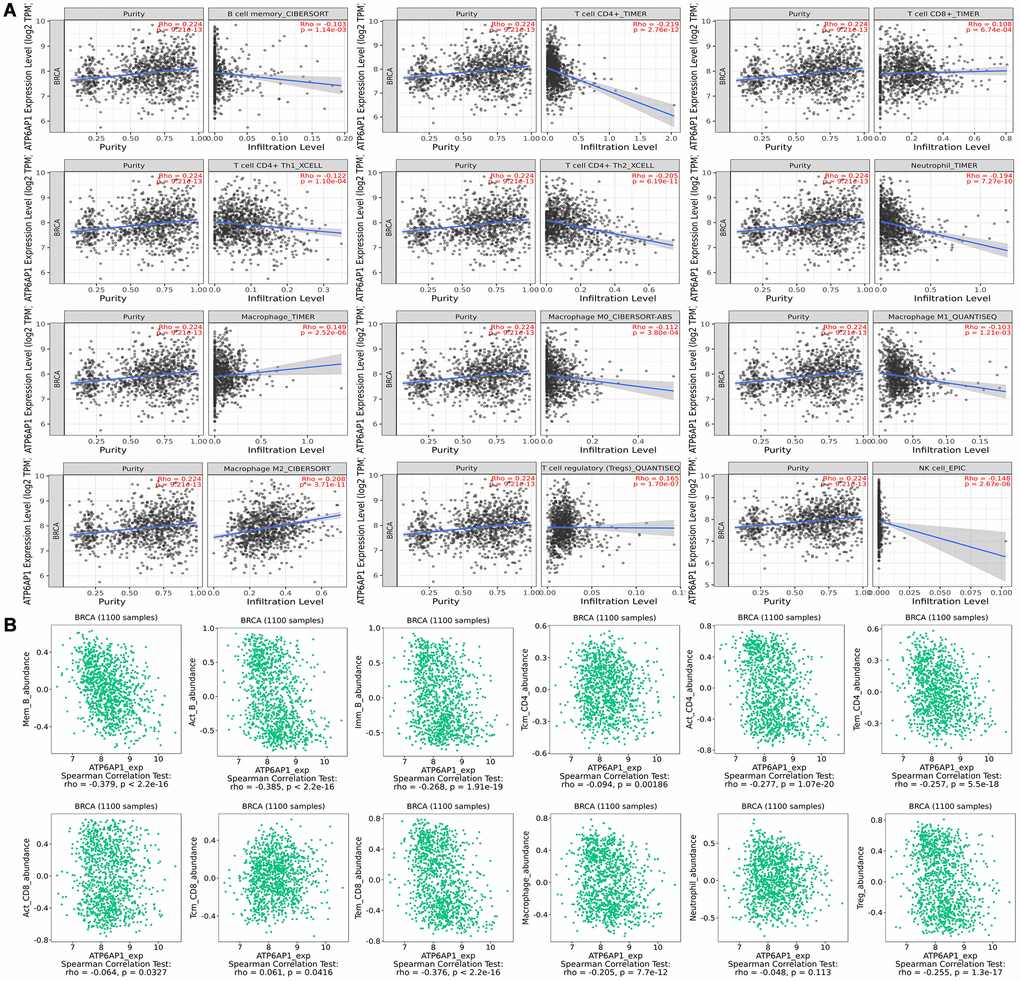
Figure 3. Correlation of ATP6AP1 expression with immune infiltration in BC samples from TIMER and TISIDB. The correlation of ATP6AP1 levels with the infiltrating levels of B cells, CD4+ T cells, CD8+ T cells, macrophages, Tregs, natural killer (NK) cells and neutrophils in BC samples from TIMER (A) and TISIDB (B), respectively (n = 1100). The CIBERSORT, TIMER, XCELL, QUANTISEQ and EPIC in Figure represents the algorithm which the database used.
Next, we used the Tumor-Immune System Interaction Database (TISIDB) to further assess the relationship between ATP6AP1 levels and TIIC levels in BC (Figure 3B). Notably, ATP6AP1 levels correlated negatively with B cell, CD4+ T cell, Treg and macrophage levels, and exhibited a weak negative correlation with CD8+ T cell levels (all P < 0.05). However, ATP6AP1 levels did not correlate significantly with neutrophil levels (P = 0.113). Combining the results from Figure 3A and 3B, CD4+ T cells, Tregs and macrophages may strongly influence ATP6AP1 expression in BC, thus altering the prognoses of BC patients.
We subsequently determined the correlations between the levels of diverse immune cell markers and ATP6AP1, while removing the influence of tumor purity. ATP6AP1 levels exhibited significant negative correlations with B cell, CD8+ T cell, macrophage and Treg surface marker levels (all P < 0.05; Table 1). Interestingly, no significant correlations between the levels of these immune cell markers and ATP6AP1 remained when we removed the influence of the patient’s age. Nevertheless, ATP6AP1 expression may generally be associated with immune infiltration in BC.
Table 1. Correlation analysis between ATP6AP1 and immune cell type markers in TIMER database.
| Cell type | Gene markers | None | Purity | Age | |||||||||||||||||||||||||||||||||||||||||||||||||||||||||||||||||||||||||||||||||||||||||||||||
| COR | P | COR | P | COR | P | ||||||||||||||||||||||||||||||||||||||||||||||||||||||||||||||||||||||||||||||||||||||||||||||
| B Cells | CD19 | –0.224 | 5.12E-14 | –0.121 | 1.31E-04 | 0.067 | 5.57E-01 | ||||||||||||||||||||||||||||||||||||||||||||||||||||||||||||||||||||||||||||||||||||||||||||
| FCRL2 | –0.224 | 5.75E-14 | –0.128 | 5.48E-05 | –0.066 | 5.65E-01 | |||||||||||||||||||||||||||||||||||||||||||||||||||||||||||||||||||||||||||||||||||||||||||||
| CD38 | –0.214 | 7.37E-13 | –0.116 | 2.52E-04 | 0.025 | 8.27E-01 | |||||||||||||||||||||||||||||||||||||||||||||||||||||||||||||||||||||||||||||||||||||||||||||
| CD8+T Cells | CD27 | –0.222 | 1.08E-13 | –0.104 | 1.02E-03 | –0.072 | 5.30E-01 | ||||||||||||||||||||||||||||||||||||||||||||||||||||||||||||||||||||||||||||||||||||||||||||
| CD3D | –0.245 | 1.85E-16 | –0.136 | 1.81E-05 | –0.097 | 3.98E-01 | |||||||||||||||||||||||||||||||||||||||||||||||||||||||||||||||||||||||||||||||||||||||||||||
| CD8A | –0.169 | 1.61E-08 | –0.059 | 6.48E-02 | –0.138 | 2.30E-01 | |||||||||||||||||||||||||||||||||||||||||||||||||||||||||||||||||||||||||||||||||||||||||||||
| Neutrophils | CXCR2 | –0.027 | 3.65E-01 | 0.043 | 1.79E-01 | –0.060 | 5.99E-01 | ||||||||||||||||||||||||||||||||||||||||||||||||||||||||||||||||||||||||||||||||||||||||||||
| SELL | –0.094 | 1.84E-03 | 0.032 | 3.10E-01 | –0.001 | 9.94E-01 | |||||||||||||||||||||||||||||||||||||||||||||||||||||||||||||||||||||||||||||||||||||||||||||
| FCGR3B | 0.033 | 2.67E-01 | 0.069 | 2.98E-02 | 0.083 | 4.70E-01 | |||||||||||||||||||||||||||||||||||||||||||||||||||||||||||||||||||||||||||||||||||||||||||||
| Macrophages | CD14 | –0.178 | 2.86E-09 | –0.110 | 5.08E-04 | –0.216 | 5.77E-02 | ||||||||||||||||||||||||||||||||||||||||||||||||||||||||||||||||||||||||||||||||||||||||||||
| CD163 | –0.078 | 9.43E-03 | 0.007 | 8.19E-01 | –0.014 | 9.05E-01 | |||||||||||||||||||||||||||||||||||||||||||||||||||||||||||||||||||||||||||||||||||||||||||||
| CD84 | –0.013 | 6.58E-01 | 0.086 | 6.84E-03 | –0.011 | 9.25E-01 | |||||||||||||||||||||||||||||||||||||||||||||||||||||||||||||||||||||||||||||||||||||||||||||
| Dendritics | CCL18 | –0.208 | 3.56E-12 | –0.156 | 8.35E-07 | –0.076 | 5.07E-01 | ||||||||||||||||||||||||||||||||||||||||||||||||||||||||||||||||||||||||||||||||||||||||||||
| CD209 | –0.128 | 1.97E-05 | –0.030 | 3.38E-01 | –0.121 | 2.93E-01 | |||||||||||||||||||||||||||||||||||||||||||||||||||||||||||||||||||||||||||||||||||||||||||||
| LYZ | –0.149 | 6.65E-07 | –0.043 | 1.80E-01 | –0.160 | 1.61E-01 | |||||||||||||||||||||||||||||||||||||||||||||||||||||||||||||||||||||||||||||||||||||||||||||
| NK cells | CD69 | –0.163 | 5.54E-08 | –0.036 | 2.59E-01 | –0.168 | 1.41E-01 | ||||||||||||||||||||||||||||||||||||||||||||||||||||||||||||||||||||||||||||||||||||||||||||
| NKG7 | –0.231 | 7.68E-15 | –0.124 | 9.17E-05 | –0.182 | 1.11E-01 | |||||||||||||||||||||||||||||||||||||||||||||||||||||||||||||||||||||||||||||||||||||||||||||
| Th1 cells | CCR1 | –0.111 | 2.37E-04 | –0.035 | 2.66E-01 | –0.132 | 2.48E-01 | ||||||||||||||||||||||||||||||||||||||||||||||||||||||||||||||||||||||||||||||||||||||||||||
| CCR5 | –0.164 | 4.44E-08 | –0.050 | 1.17E-01 | –0.165 | 1.49E-01 | |||||||||||||||||||||||||||||||||||||||||||||||||||||||||||||||||||||||||||||||||||||||||||||
| CXCR3 | –0.189 | 2.93E-10 | –0.074 | 2.01E-02 | –0.102 | 3.73E-01 | |||||||||||||||||||||||||||||||||||||||||||||||||||||||||||||||||||||||||||||||||||||||||||||
| Treg | BIRC3 | –0.249 | 5.43E-17 | –0.152 | 1.49E-06 | 0.073 | 5.27E-01 | ||||||||||||||||||||||||||||||||||||||||||||||||||||||||||||||||||||||||||||||||||||||||||||
| CCR4 | –0.070 | 2.09E-02 | 0.060 | 5.82E-02 | 0.082 | 4.76E-01 | |||||||||||||||||||||||||||||||||||||||||||||||||||||||||||||||||||||||||||||||||||||||||||||
| FOXP3 | –0.158 | 1.32E-07 | –0.062 | 4.95E-02 | 0.081 | 4.79E-01 | |||||||||||||||||||||||||||||||||||||||||||||||||||||||||||||||||||||||||||||||||||||||||||||
| Monocytes | CD86 | –0.133 | 9.24E-06 | –0.035 | 2.69E-01 | –0.177 | 1.21E-01 | ||||||||||||||||||||||||||||||||||||||||||||||||||||||||||||||||||||||||||||||||||||||||||||
| MNDA | –0.087 | 3.83E-03 | 0.028 | 3.86E-01 | –0.127 | 2.69E-01 | |||||||||||||||||||||||||||||||||||||||||||||||||||||||||||||||||||||||||||||||||||||||||||||
| aCOR, rho value of Spearman’s correlation; Purity, correlation adjusted by purity; bAge, correlation adjusted by age. | |||||||||||||||||||||||||||||||||||||||||||||||||||||||||||||||||||||||||||||||||||||||||||||||||||
Survival analysis based on ATP6AP1 expression in BC patients with different immune cell subtype levels
Since higher ATP6AP1 expression was associated with a poorer prognosis in BC patients, we used the TIMER to determine whether this association depended on the abundance of immune infiltrates in BC tissues (Figure 4A). ATP6AP1 expression-based clinical outcomes correlated significantly with B cell levels (log-rank P = 0.046). We then used Kaplan-Meier Plotter to assess the relationship between ATP6AP1 levels and clinical outcomes after stratifying patients according to the levels of other types of TIICs (Figure 4B). BC patients with higher ATP6AP1 levels had poorer prognoses, whether they had enriched or reduced levels of B cells, CD4+ T cells, eosinophils, macrophages, mesenchymal stem cells, natural killer T cells, Th1 cells or Th2 cells (all P < 0.05). On the other hand, BC patients with higher ATP6AP1 levels had poorer prognoses if they had enriched basophil levels, reduced CD8+ T cell levels or reduced Treg levels (all P < 0.05), but not if they had reduced basophil levels, enriched CD8+ T cell levels or enriched Treg levels. Thus, immune infiltration may partly explain the poorer prognoses of BC patients with higher ATP6AP1 levels.
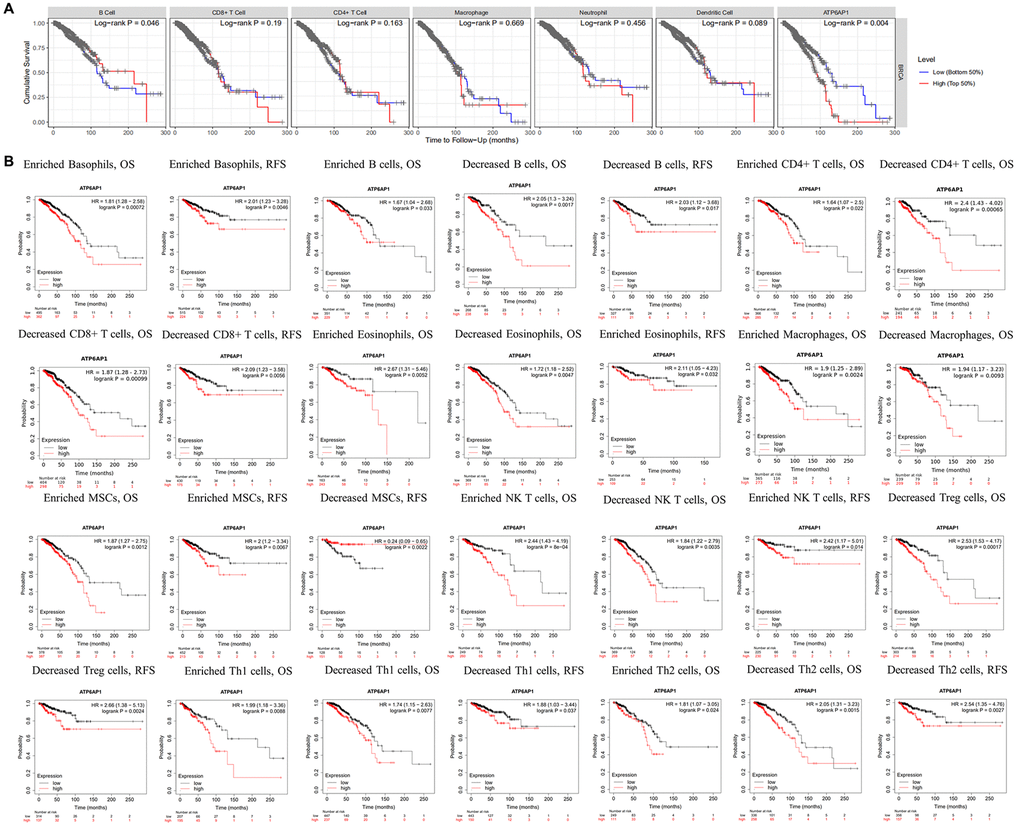
Figure 4. Survival curves based on ATP6AP1 levels stratified according to TIIC levels in BC samples from TIMER and Kaplan-Meier Plotter. (A) Data from TIMER (n = 1100). (B) Data from Kaplan-Meier Plotter.
The clinicopathological significance of ATP6AP1 expression and methylation in BC
Next, we investigated whether ATP6AP1 expression was associated with clinical factors in BC patients. ATP6AP1 levels correlated positively with the pathological stage (Pr(>F) = 0.043) and clinical stage, with an especially pronounced difference between stages 1 and 3 (P < 0.05; Figure 5A and 5B). As for lymph node metastasis, ATP6AP1 levels were significantly greater in N1 than in N0 BC patients (P < 0.05; Figure 5C). However, ATP6AP1 expression had little association with other clinical and pathological factors, as shown in Supplementary Figure 2.
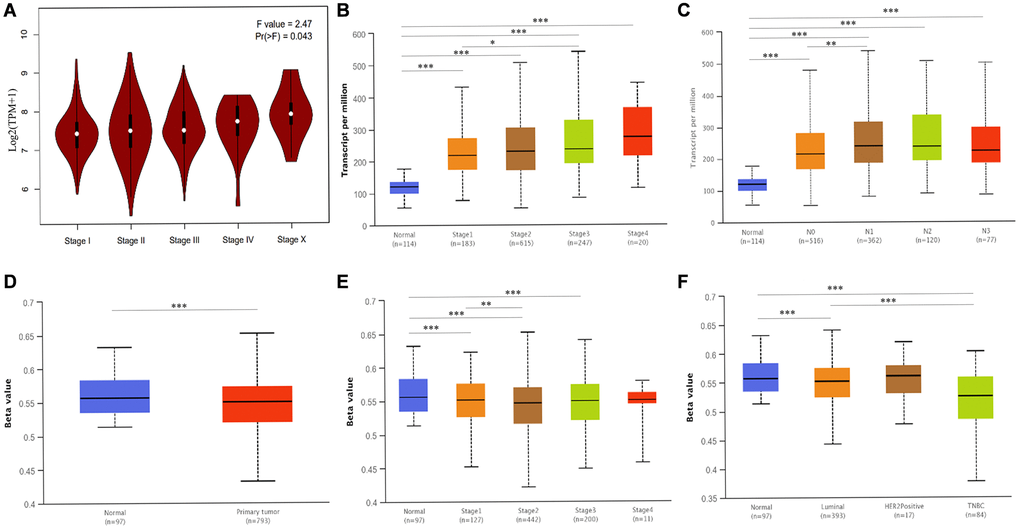
Figure 5. Associated clinicopathological factors and promoter methylation levels of ATP6AP1 in BC. (A) ATP6AP1 levels in various pathological substages of BC in GEPIA. (B) ATP6AP1 levels in different disease stages of BC in UALCAN. (C) The correlation between lymph node metastasis and ATP6AP1 expression in BC. (D) ATP6AP1 promoter methylation profiles of different sample types. (E) ATP6AP1 promoter methylation levels of different BC disease stages. (F) ATP6AP1 promoter methylation levels of different major subclasses of BC. *P < 0.05, **P < 0.01, ***P < 0.001.
Epigenetic changes in DNA methylation (whether they occur within a single gene or across the genome) are important contributors to tumor initiation and development [11]. Thus, we used the UALCAN database to compare the methylation of the ATP6AP1 promoter between BC tissues and normal tissues. The ATP6AP1 promoter was significantly hypomethylated in BC tissues compared with normal tissues (P < 0.05; Figure 5D). Moreover, the methylation of the ATP6AP1 promoter was significantly associated with the subtypes and disease stages of BC, especially differing between luminal and triple-negative BC and between stages 1 and 2 (all P < 0.05; Figure 5E and 5F). Thus, hypomethylation of ATP6AP1 may promote the occurrence and development of BC. We also assessed the genetic variation of ATP6AP1 in BC tissues, and found that there was approximately 1.4% variation due to fusions, amplifications, deep deletions, missense mutations and truncating mutations of unknown significance (Supplementary Figure 3). These findings suggested that variations in ATP6AP1 may contribute to BC tumorigenesis.
ATP6AP1-related network and functional analysis in BC
To determine the biological significance of ATP6AP1 in BC, we used the function module of UALCAN to examine genes that were co-expressed with ATP6AP1 in the BC cohort. The top 48 genes with significant positive or negative correlations with ATP6AP1 levels are presented in Table 2. We also analyzed the co-expression of proteins with ATP6AP1 in BC using the Search Tool for the Retrieval of Interacting Genes (STRING) database. Twenty-one proteins were significantly co-expressed with ATP6AP1, and these proteins were used to construct a protein-protein interaction network, which contained 21 nodes and 210 edges (Figure 6A). Most of these proteins were components of V-ATPase, except for ATP6AP2, LAMTOR1 (Late Endosomal/Lysosomal Adaptor, MAPK and mTOR Activator 1) and Renin, and all of them have previously been implicated in BC [12, 13].
Table 2. The co-expression genes of ATP6AP1 analyzed by UALCAN.
| Positively Genes | Pearson CC | Negatively Genes | Pearson CC | ||||||||||||||||||||||||||||||||||||||||||||||||||||||||||||||||||||||||||||||||||||||||||||||||
| GDI1 | 0.71 | RPS27A | –0.44 | ||||||||||||||||||||||||||||||||||||||||||||||||||||||||||||||||||||||||||||||||||||||||||||||||
| BCAP31 | 0.6 | RPS7 | –0.40 | ||||||||||||||||||||||||||||||||||||||||||||||||||||||||||||||||||||||||||||||||||||||||||||||||
| ARF3 | 0.57 | RPS19 | –0.39 | ||||||||||||||||||||||||||||||||||||||||||||||||||||||||||||||||||||||||||||||||||||||||||||||||
| P4HTM | 0.56 | CSDA | –0.38 | ||||||||||||||||||||||||||||||||||||||||||||||||||||||||||||||||||||||||||||||||||||||||||||||||
| TMBIM6 | 0.56 | RPL37 | –0.38 | ||||||||||||||||||||||||||||||||||||||||||||||||||||||||||||||||||||||||||||||||||||||||||||||||
| NECAB3 | 0.52 | RPS25 | –0.38 | ||||||||||||||||||||||||||||||||||||||||||||||||||||||||||||||||||||||||||||||||||||||||||||||||
| POMGNT1 | 0.52 | C11orf75 | –0.37 | ||||||||||||||||||||||||||||||||||||||||||||||||||||||||||||||||||||||||||||||||||||||||||||||||
| TMED4 | 0.52 | RPS18 | –0.36 | ||||||||||||||||||||||||||||||||||||||||||||||||||||||||||||||||||||||||||||||||||||||||||||||||
| CETN2 | 0.51 | RPL35A | –0.35 | ||||||||||||||||||||||||||||||||||||||||||||||||||||||||||||||||||||||||||||||||||||||||||||||||
| PIGT | 0.50 | RPL24 | –0.35 | ||||||||||||||||||||||||||||||||||||||||||||||||||||||||||||||||||||||||||||||||||||||||||||||||
| FAM134A | 0.50 | RPS10 | –0.35 | ||||||||||||||||||||||||||||||||||||||||||||||||||||||||||||||||||||||||||||||||||||||||||||||||
| CXorf40B | 0.50 | EEF1B2 | –0.35 | ||||||||||||||||||||||||||||||||||||||||||||||||||||||||||||||||||||||||||||||||||||||||||||||||
| SPRYD3 | 0.50 | RPL5 | –0.35 | ||||||||||||||||||||||||||||||||||||||||||||||||||||||||||||||||||||||||||||||||||||||||||||||||
| RELL1 | 0.50 | RPL11 | –0.35 | ||||||||||||||||||||||||||||||||||||||||||||||||||||||||||||||||||||||||||||||||||||||||||||||||
| ATP6V0A1 | 0.50 | TUBB6 | –0.34 | ||||||||||||||||||||||||||||||||||||||||||||||||||||||||||||||||||||||||||||||||||||||||||||||||
| CXXC5 | 0.49 | RPL18A | –0.34 | ||||||||||||||||||||||||||||||||||||||||||||||||||||||||||||||||||||||||||||||||||||||||||||||||
| RAB5B | 0.49 | RPS6 | –0.34 | ||||||||||||||||||||||||||||||||||||||||||||||||||||||||||||||||||||||||||||||||||||||||||||||||
| HAGH | 0.49 | RPL27A | –0.34 | ||||||||||||||||||||||||||||||||||||||||||||||||||||||||||||||||||||||||||||||||||||||||||||||||
| PLXNA3 | 0.49 | OBFC2A | –0.33 | ||||||||||||||||||||||||||||||||||||||||||||||||||||||||||||||||||||||||||||||||||||||||||||||||
| RAB3A | 0.49 | RPS12 | –0.33 | ||||||||||||||||||||||||||||||||||||||||||||||||||||||||||||||||||||||||||||||||||||||||||||||||
| ATP6V0B | 0.48 | C6orf145 | –0.33 | ||||||||||||||||||||||||||||||||||||||||||||||||||||||||||||||||||||||||||||||||||||||||||||||||
| LRBA | 0.48 | RPL31 | –0.33 | ||||||||||||||||||||||||||||||||||||||||||||||||||||||||||||||||||||||||||||||||||||||||||||||||
| WFS1 | 0.48 | EEF1G | –0.33 | ||||||||||||||||||||||||||||||||||||||||||||||||||||||||||||||||||||||||||||||||||||||||||||||||
| CDKN2AIPNL | 0.48 | UBE2E3 | –0.33 | ||||||||||||||||||||||||||||||||||||||||||||||||||||||||||||||||||||||||||||||||||||||||||||||||
| aPearson CC value: 0·00–0·19 “very weak,” 0·20–0·39 “weak,” 0·40–0·59 “moderate,” 0·60–0·79 “strong,” 0·80–1·0 “very strong. | |||||||||||||||||||||||||||||||||||||||||||||||||||||||||||||||||||||||||||||||||||||||||||||||||||
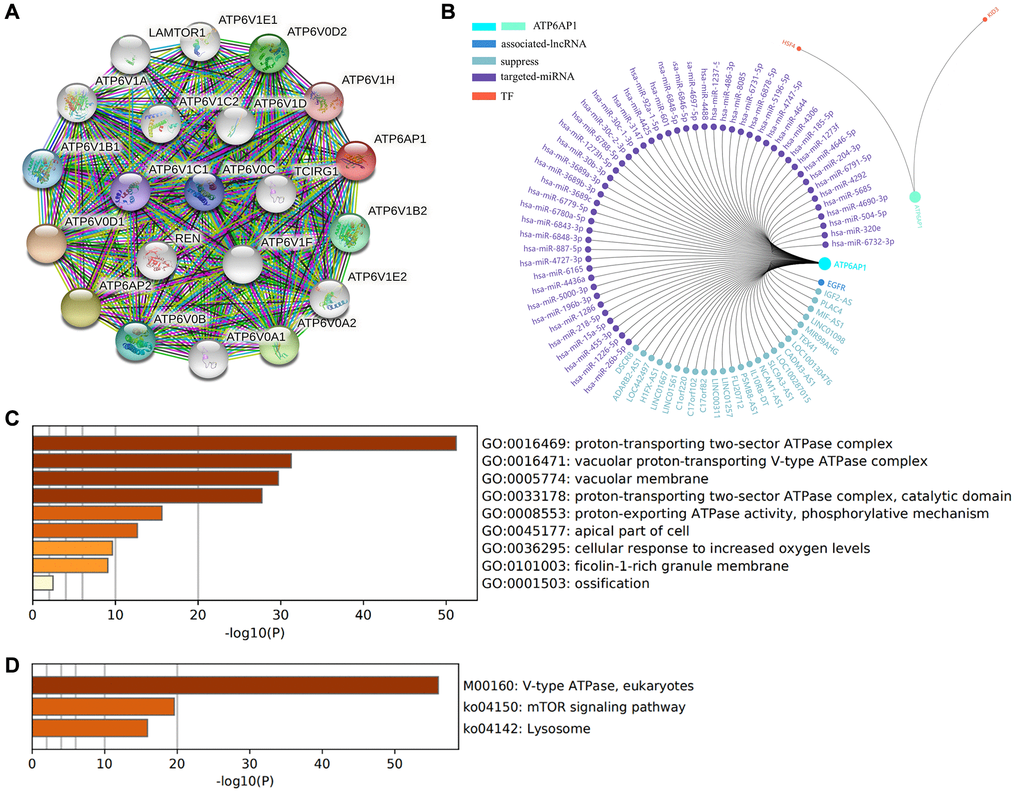
Figure 6. Functional enrichment and regulatory network analyses of ATP6AP1. (A) The protein-protein interaction network of ATP6AP1. (B) Regulatory network analysis conducted in GCBI. (C) GO functional analysis. (D) KEGG pathway analysis.
Next, we evaluated the enriched Gene Ontology (GO) biological functions and Kyoto Encyclopedia of Genes and Genomes (KEGG) pathways of the proteins in this interaction network (Figure 6C and 6D). In terms of biological function, the proteins were mainly associated with the ‘proton-transporting two-sector ATPase complex’, ‘vacuolar proton-transporting V-type ATPase complex’, ‘vacuolar membrane’, ‘proton-transporting two-sector ATPase complex (catalytic domain)’, ‘proton-exporting ATPase activity (phosphorylative mechanism)’, ‘apical part of cell’, ‘cellular response to increased oxygen levels’ and ‘filcolin-1-rich granule membrane’. In the KEGG pathway enrichment results, three pathways were the most likely to represent the function of ATP6AP1 in BC: ‘V-type ATPase (eukaryotes)’, ‘mTOR signaling pathway’ and ‘lysosome’.
We also used the Gene-Cloud of Biotechnology Information (GCBI) database to further explore the regulators of ATP6AP1 in BC. The long noncoding RNAs (lncRNAs), microRNAs (miRNAs) and transcription factors (TFs) associated with ATP6AP1 are shown in Figure 6B.
SARS-CoV-2 infections may reduce the expression of ATP6AP1
ATP6AP1 can be used as a bait through which SARS-CoV-2 nsp6 infects people [9]. Thus, we used the GSE153277 and GSE155241 datasets to assess changes in ATP6AP1 expression after SARS-CoV-2 infections. The results from GSE153277 indicated that ATP6AP1 levels in induced alveolar type II epithelial-like (iAT2) cells were significantly lower in the SARS-CoV-2-infected group than in the control group (Figure 7A). Likewise, in GSE155241, ATP6AP1 levels in human pluripotent stem cell-lung organoids (hPSC-LOs) declined significantly after the cells were infected with SARS-CoV-2 (Figure 7B). These findings suggested that ATP6AP1 levels decrease after SARS-CoV-2 infections.
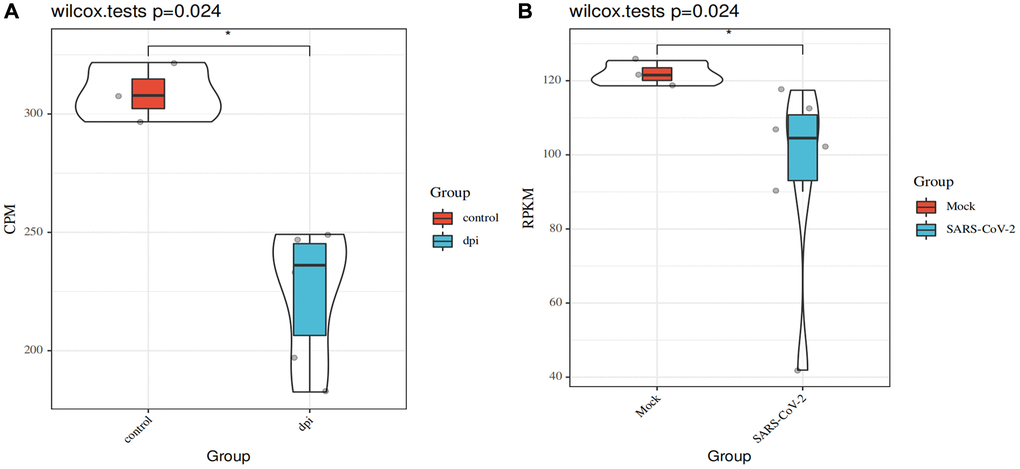
Figure 7. Changes in ATP6AP1 levels after SARS-CoV-2 infections. (A) Comparison of ATP6AP1 levels between the mock (n = 3) and SARS-CoV-2-infected groups (n = 6) of iAT2 cells from the GSE153277 dataset. Triplicate results are shown for iAT2 cells cultured at the air-liquid interface with a mock virus (mock, n = 3), with SARS-CoV-2 one day post-infection (1 dpi, n = 3), and with SARS-CoV-2 four days post-infection (4 dpi, n = 3). (B) ATP6AP1 levels in the SARS-CoV-2-infected group (n = 6) and the mock group (n = 3) of hPSC-LOs from the GSE155241 dataset. CPM: counts per million. RPKM: reads per kilobase million.
Tumor tissues expressing high levels of ATP6AP1 may be particularly susceptible to viral interference. Since SARS-CoV-2 infections can reduce ATP6AP1 levels, and ATP6AP1 expression is associated with immune infiltration in BC, SARS-CoV-2 may influence the occurrence, development and prognosis of BC.
Discussion
In this study, we comprehensively analyzed the involvement of ATP6AP1 in BC. In the context of the novel coronavirus, it is particularly important to determine the prognoses of cancer patients, especially BC patients. As ATP6AP1 is known to bind to SARS-CoV-2, understanding the contribution of ATP6AP1 to the development and prognosis of BC is greatly significant. We found that ATP6AP1 levels were significantly greater in BC tissues than in normal breast tissues, and correlated significantly with the cancer stage and lymph node metastasis status (N1 vs. N0). These results indicated that ATP6AP1 may be an ideal biomarker for early BC diagnosis and nodal metastasis detection. Moreover, higher ATP6AP1 expression was associated with poorer OS and DFS in BC patients. As far as we know, this is the first study to report the association of greater ATP6AP1 mRNA levels with a poorer prognosis in BC patients.
We also found that ATP6AP1 levels correlated with the levels of TIICs in BC, especially those of CD4+ T cells, Tregs and macrophages. However, in terms of whether the correlations were positive or negative, the results from TIMER and TISIDB differed from one another for Tregs and macrophages. The levels of most immune cell types correlate negatively with tumor purity, so correcting for purity can help to clarify the association of gene expression with immune cell infiltration. Since TIMER corrects for tumor purity, its results are likely to be more accurate, especially given that this database employs six algorithms [14]. Moreover, TISIDB does not contain a subtype analysis for macrophages.
Our results indicated that ATP6AP1 expression correlated negatively with CD8+ T cell and B cell infiltration, but positively with Treg and macrophage infiltration. Tumor-associated macrophages can dramatically influence tumor initiation and progression [15], and have been associated with a poor prognosis in BC [16]. M2 (anti-inflammatory) tumor-associated macrophages have been implicated in the progression of BC to invasive carcinoma. Regarding T cells, CD8+ T cell infiltration is known to induce an anti-tumor cytotoxic response [17], whereas the prognostic value of CD4+ immune cell infiltration is somewhat controversial. CD4+ T cells comprise at least four lineages – Th1, Th2, Th17 and Treg cells – which differ in their functions. CD4+ Th1 cells have been shown to prevent tumor growth [16], while CD4+ Th2 and CD4+ forkhead box P3+ lymphocytes (Tregs) are considered to promote tumor growth [15, 16, 18]. CD4+ Tregs can suppress host-derived adaptive anti-tumor immunity by inhibiting tumor-specific cytotoxicity [19]. A comprehensive retrospective analysis indicated that a greater density of infiltrating forkhead box P3+ immune cells was associated with poorer OS in BC patients [20]. As for B cells, greater CD20+ B cell infiltration has been associated with a better survival rate in BC patients [21]. Since ATP6AP1 levels correlated negatively with CD8+ T cell and B cell levels in the present study, high ATP6AP1 expression in BC tissues may inhibit the cytotoxic response to tumor cells, resulting in poor outcomes. The positive correlation of ATP6AP1 levels with CD4+ Treg and macrophage levels further explains why patients with higher ATP6AP1 levels had poorer prognoses, since these TIICs can promote tumor growth. Our findings indicate that ATP6AP1 may be a key contributor to immune suppression and immune escape, and may worsen the prognoses of BC patients by regulating immune infiltration.
Previous studies have demonstrated that the loss of ATP6AP1 can be carcinogenic; for instance, an inactivating mutation in ATP6AP1 was proposed to be the driving factor for granular cell tumor development [22]. On the other hand, the overexpression of oncogenes due to hypomethylation is considered to be an important mechanism of carcinogenesis [23], and DNA methylation is a candidate early biomarker of BC progression [24]. The luminal B subtype of BC is characterized by a hypermethylated phenotype, while the basal-like subtype is characterized by hypomethylation [25]. We found that the ATP6AP1 promoter was markedly hypomethylated in BC tissues compared with normal tissues, and that its methylation level differed significantly between the luminal and triple-negative subtypes. We also observed that ATP6AP1 promoter methylation differed significantly among BC stages, most significantly between stage 1 and 2. Epigenetic modifications of genes may alter the tumor immune microenvironment and induce strong anti-tumor immune responses [11, 24, 26]. Thus, the hypomethylation of ATP6AP1 may explain its increased mRNA levels in BC tissues.
Our analysis indicated that ATP6AP1 expression in certain cell types may be reduced after SARS-CoV-2 infections; thus, its expression in tumor tissues may also be reduced following such infections. Considering that ATP6AP1 was upregulated in BC tissues, these tissues may be more susceptible to viral interference from SARS-CoV-2. Moreover, in our protein-protein interaction network analysis, one of the proteins found to interact with ATP6AP1 was Renin, the rate-limiting enzyme of the renin-angiotensin system. Renin not only has vital functions in cardiovascular and kidney disease, but also is associated with diverse cancers, especially BC [27]. Angiotensin converting enzyme 2, a key regulator of the renin-angiotensin system, has been identified as a functional receptor for SARS-CoV-2 [28]. Given these findings, it is possible that SARS-CoV-2 could alter ATP6AP1 expression in BC tissues, thus disturbing the tumor microenvironment and influencing the development and prognosis of BC.
Our GO and KEGG enrichment analyses indicated that the proteins co-expressed with ATP6AP1 were mainly components of V-ATPase and participants in the mammalian target of rapamycin (mTOR) pathway. V-ATPase regulates the extracellular environment of tumor cells and the pH of many intracellular compartments, thus enabling tumor cells to maintain a high metabolic rate and contributing to their autophagy, invasion, migration and drug resistance [5, 29]. Enhanced phosphoinositide 3-kinase/AKT/mTOR signaling has been associated with BC and found to promote drug resistance [30]. Everolimus, which inhibits mTORC1 and induces AKT phosphorylation, has been approved for the treatment of postmenopausal women with hormone receptor-positive and human epidermal growth factor receptor 2-negative advanced BC [31]. Therefore, it is extremely likely that these co-expressed genes and interacting proteins contribute to the tumorigenic effects of ATP6AP1 in BC.
We also identified the lncRNAs, miRNAs, TFs and downstream genes associated with ATP6AP1 in BC. A number of these genes are known to be involved in cancer, including the downstream gene epidermal growth factor receptor (EGFR), the lncRNAs DSCR8 and ADARB2-AS1, and the TF heat shock factor 4 (HSF4). V-ATPase and EGFR can antagonize one another [32]. The induction of EGFR under hypoxic conditions has been found to promote cell proliferation and migration, and patients with hypoxic breast tumors and EGFR hypomethylation may benefit from EGFR inhibition [33]. Unfortunately, the specific mode of interaction between EGFR and ATP6AP1 in BC is still unknown. Dysregulation of the lncRNA DSCR8 has been observed in uterine cancer, melanoma and liver cancer [34], and upregulation of ADARB2-AS1 has been detected in human epidermal growth factor receptor 2-positive BC [35]. Knockout or overexpression of either HSF4 and HSF2 have been shown to increase the hypoxia-inducible factor-1α expression in MCF-7 BC cells [36], though it is unclear whether HSF4 directly contributes to the development of BC. These genes are probably part of the regulatory network of ATP6AP1 in BC; however, their exact functions remain to be determined.
Our study had several limitations. Firstly, the number of normal breast tissue specimens available in the databases was limited, which may have led to inaccurate results. Additional evidence is needed at the protein level (e.g., from immunohistochemistry or Western blotting experiments) to verify that ATP6AP1 is differentially expressed between normal and cancerous breast tissues. Secondly, due to the limitations of the databases, we were not able to explore the relationship between ATP6AP1 expression and immune infiltration in greater detail. Thirdly, the mechanism whereby ATP6AP1 promotes a poor prognosis in BC was not determined. Future research is urgently needed to confirm our substantial results. In summary, ATP6AP1 was significantly upregulated in BC tissues, and higher ATP6AP1 expression was associated with a poorer prognosis and with higher or lower infiltration of particular immune cells in BC. The poorer prognoses of BC patients with higher ATP6AP1 levels may have been due to the association of ATP6AP1 with immune infiltration, and this possibility is worthy of further research. Tumor tissues may be especially prone to SARS-CoV-2 infections, which may downregulate ATP6AP1, ultimately impacting the prognoses of BC patients with COVID-19.
Materials and Methods
Differential expression analysis
To compare ATP6AP1 expression between BC and adjacent normal tissues, we used the Oncomine [37] (http://www.oncomine.org), GEPIA [38] (http://gepia.cancer-pku.cn/index.html) and HPA [39] (http://www.proteinatlas.org) databases. The Oncomine database draws relevant datasets directly from the Stanford Microarray Database, the National Center for Biotechnology Information Gene Expression Omnibus (GEO), published literature, etc. In Oncomine, mRNA data were selected with P = 0.05 and fold-change = 1.5 as the threshold values. The datasets in GEPIA are based on TCGA and GTEx, which contain normal tissue data for comparison.
The HPA database is a Swedish project to map all human proteins in cells, tissues and organs by integrating data from TCGA, HPA datasets, the GTEx consortium and recount2. We used the HPA database to assess ATP6AP1 protein levels in tumors and adjacent normal tissues. The antibody used to obtain the immunohistochemistry results was CAB015218 (Origene) at a dilution of 1:30. The immunohistochemistry results and antibody information are shown in Figure 1; however, due to the number of specimens in the database, we selected only a representative group for the figure, and placed the rest in the Supplementary Material.
GEO is a common functional genomics data repository. We analyzed expression profiles from GSE153277 [40] and GSE155241 [41]. GSE153277 contains nine samples from iAT2 cells infected with SARS-CoV-2 or a mock virus. GSE155241 contains data from hPSC-LO cells cultured with SARS-CoV-2 or a mock virus. Nine samples were selected from a total of 18. The GPL18573 Illumina NextSeq 500 (Homo sapiens) and GPL24676 Illumina NovaSeq 6000 (Homo sapiens) platforms were used to sequence the respective datasets. ATP6AP1 levels were compared between the control and SARS-CoV-2 groups using the Sangerbox tool, a free online platform for data analysis (http://www.sangerbox.com/tool).
Prognostic analysis
To assess the clinical significance of ATP6AP1, we used RNA sequencing data from Kaplan-Meier plotter [42] (https://kmplot.com) to evaluate the OS and RFS of BC patients based on ATP6AP1 expression. Kaplan-Meier plotter includes data from GEO, the European Genome-Phenome Archive and TCGA. We also used data from GEPIA to determine the association of ATP6AP1 expression with BC patient survival. In addition, we performed survival analyses based on ATP6AP1 expression stratified by TIIC subtype levels in BC tissues.
Immune infiltration analysis
The TIMER 2.0 database [14] (http://timer.cistrome.org/) is a comprehensive resource for the systematic analysis of immune infiltration in different cancer types based on data from TCGA. It integrates six state-of-the-art algorithms, including TIMER, xCell, MCP-counter, CIBERSORT, EPIC and quanTIseq. TISIDB [43] (http://cis.hku.hk/TISIDB/index.php) is a web portal for detecting tumor and immune system interactions. TISIDB integrates data from TCGA, PubMed literature, other public databases (UniProt, GO, DrugBank, etc.) and high-throughput sequencing analyses. The gene set variation analysis package was used to infer tumor-infiltrating lymphocyte levels in TISIDB. We further explored the relationship between ATP6AP1 and TIIC levels in BC and analyzed the surface markers of TIICs using the CellMaker [44] (http://biocc.hrbmu.edu.cn/CellMarker/) database.
Genomic analysis
To analyze the mutation and copy number variation of ATP6AP1 in BC, we used the cBioPortal database [45, 46] (https://www.cbioportal.org), which contains numerous multidimensional cancer genomics datasets from various studies. The promoter methylation status of ATP6AP1 and the associated clinical features were explored using UALCAN [47] (http://ualcan.path.uab.edu/index.html), a comprehensive, user-friendly, interactive web resource for analyzing cancer OMICS data (TCGA and MET500).
Gene co-expression and functional enrichment analyses
We used the UALCAN database to determine the genes that were co-expressed with ATP6AP1 in BC. The STRING database [48] (https://string-db.org) was used to construct the protein-protein interaction network of ATP6AP1 in BC. GO and KEGG enrichment analyses of ATP6AP1 and its interacting proteins were conducted using Metascape [49] (https://metascape.org), an integrated web-based portal.
Network analysis
The lncRNAs, miRNAs and TFs associated with ATP6AP1 were assessed using GCBI (https://www.gcbi.com.cn), a resource based on multiple databases and published studies.
Statistical analysis
The log-rank test was used to analyze patients’ outcomes. The correlations of ATP6AP1 levels with TIIC or immune cell marker levels were evaluated using Spearman's correlation analyses. The association of ATP6AP1 expression with pathological staging was determined using one-way analysis of variance with data from GEPIA. Student’s t-test was used to analyze the association of ATP6AP1 expression with clinical factors from UALCAN. Wilcoxon’s signed rank test was used to compare ATP6AP1 levels between the control and SARS-CoV-2-infected groups. Spearman’s method was used to determine the correlation coefficients between genes in the co-expression analysis. All results with P-values <0.05 were considered statistically significant.
Supplementary Materials
Author Contributions
Yunjiang Liu and Jintian Wang conceived and designed the experiments. Jintian Wang analyzed and interpreted the bioinformatics data and wrote the manuscript. Yunjiang Liu and Shuo Zhang revised the manuscript. All authors reviewed and approved the final manuscript.
Acknowledgments
All the authors are grateful to the specimen donors and researchers who contributed to the public databases used in this study, such as TCGA and GEO.
Conflicts of Interest
The authors declare no conflicts of interest related to this study.
Funding
The authors received no funding for this work.
References
- 1. Bray F, Ferlay J, Soerjomataram I, Siegel RL, Torre LA, Jemal A. Global cancer statistics 2018: GLOBOCAN estimates of incidence and mortality worldwide for 36 cancers in 185 countries. CA Cancer J Clin. 2018; 68:394–424. https://doi.org/10.3322/caac.21492 [PubMed]
- 2. De Cicco P, Ercolano G, Ianaro A. The New Era of Cancer Immunotherapy: Targeting Myeloid-Derived Suppressor Cells to Overcome Immune Evasion. Front Immunol. 2020; 11:1680. https://doi.org/10.3389/fimmu.2020.01680 [PubMed]
- 3. Arif S, Qudsia S, Urooj S, Chaudry N, Arshad A, Andleeb S. Blueprint of quartz crystal microbalance biosensor for early detection of breast cancer through salivary autoantibodies against ATP6AP1. Biosens Bioelectron. 2015; 65:62–70. https://doi.org/10.1016/j.bios.2014.09.088 [PubMed]
- 4. Jansen EJ, Timal S, Ryan M, Ashikov A, van Scherpenzeel M, Graham LA, Mandel H, Hoischen A, Iancu TC, Raymond K, Steenbergen G, Gilissen C, Huijben K, et al. ATP6AP1 deficiency causes an immunodeficiency with hepatopathy, cognitive impairment and abnormal protein glycosylation. Nat Commun. 2016; 7:11600. https://doi.org/10.1038/ncomms11600 [PubMed]
- 5. Collins MP, Forgac M. Regulation and function of V-ATPases in physiology and disease. Biochim Biophys Acta Biomembr. 2020; 1862:183341. https://doi.org/10.1016/j.bbamem.2020.183341 [PubMed]
- 6. Lu R, Zhao X, Li J, Niu P, Yang B, Wu H, Wang W, Song H, Huang B, Zhu N, Bi Y, Ma X, Zhan F, et al. Genomic characterisation and epidemiology of 2019 novel coronavirus: implications for virus origins and receptor binding. Lancet. 2020; 395:565–74. https://doi.org/10.1016/S0140-6736(20)30251-8 [PubMed]
- 7. Dai M, Liu D, Liu M, Zhou F, Li G, Chen Z, Zhang Z, You H, Wu M, Zheng Q, Xiong Y, Xiong H, Wang C, et al. Patients with Cancer Appear More Vulnerable to SARS-CoV-2: A Multicenter Study during the COVID-19 Outbreak. Cancer Discov. 2020; 10:783–91. https://doi.org/10.1158/2159-8290.CD-20-0422 [PubMed]
- 8. Knisely A, Wu J, Kaplan SJ, Zhou ZN, Melamed A, Tergas AI, St Clair CM, Hou JY, Khoury-Collado F, Huang YC, Hershman DL, Wright JD. Coronavirus Spectrum Infections (COVID-19, MERS, SARS) in Cancer Patients: A Systematic Review of the Literature. Cancer Invest. 2020; 38:436–44. https://doi.org/10.1080/07357907.2020.1809668 [PubMed]
- 9. Gordon DE, Jang GM, Bouhaddou M, Xu J, Obernier K, White KM, O’Meara MJ, Rezelj VV, Guo JZ, Swaney DL, Tummino TA, Hüttenhain R, Kaake RM, et al. A SARS-CoV-2 protein interaction map reveals targets for drug repurposing. Nature. 2020; 583:459–68. https://doi.org/10.1038/s41586-020-2286-9 [PubMed]
- 10. Tutuncuoglu B, Cakir M, Batra J, Bouhaddou M, Eckhardt M, Gordon DE, Krogan NJ. The Landscape of Human Cancer Proteins Targeted by SARS-CoV-2. Cancer Discov. 2020; 10:916–21. https://doi.org/10.1158/2159-8290.CD-20-0559 [PubMed]
- 11. Cao J, Yan Q. Cancer Epigenetics, Tumor Immunity, and Immunotherapy. Trends Cancer. 2020; 6:580–92. https://doi.org/10.1016/j.trecan.2020.02.003 [PubMed]
- 12. Anderson KS, Sibani S, Wallstrom G, Qiu J, Mendoza EA, Raphael J, Hainsworth E, Montor WR, Wong J, Park JG, Lokko N, Logvinenko T, Ramachandran N, et al. Protein microarray signature of autoantibody biomarkers for the early detection of breast cancer. J Proteome Res. 2011; 10:85–96. https://doi.org/10.1021/pr100686b [PubMed]
- 13. Collins MP, Forgac M. Regulation of V-ATPase Assembly in Nutrient Sensing and Function of V-ATPases in Breast Cancer Metastasis. Front Physiol. 2018; 9:902. https://doi.org/10.3389/fphys.2018.00902 [PubMed]
- 14. Li T, Fu J, Zeng Z, Cohen D, Li J, Chen Q, Li B, Liu XS. TIMER2.0 for analysis of tumor-infiltrating immune cells. Nucleic Acids Res. 2020; 48:W509–14. https://doi.org/10.1093/nar/gkaa407 [PubMed]
- 15. Baxevanis CN, Sofopoulos M, Fortis SP, Perez SA. The role of immune infiltrates as prognostic biomarkers in patients with breast cancer. Cancer Immunol Immunother. 2019; 68:1671–80. https://doi.org/10.1007/s00262-019-02327-7 [PubMed]
- 16. Badr NM, Berditchevski F, Shaaban AM. The Immune Microenvironment in Breast Carcinoma: Predictive and Prognostic Role in the Neoadjuvant Setting. Pathobiology. 2020; 87:61–74. https://doi.org/10.1159/000504055 [PubMed]
- 17. Teh JLF, Aplin AE. Arrested Developments: CDK4/6 Inhibitor Resistance and Alterations in the Tumor Immune Microenvironment. Clin Cancer Res. 2019; 25:921–27. https://doi.org/10.1158/1078-0432.ccr-18-1967 [PubMed]
- 18. Annaratone L, Cascardi E, Vissio E, Sarotto I, Chmielik E, Sapino A, Berrino E, Marchiò C. The Multifaceted Nature of Tumor Microenvironment in Breast Carcinomas. Pathobiology. 2020; 87:125–42. https://doi.org/10.1159/000507055 [PubMed]
- 19. Whiteside TL. Regulatory T cell subsets in human cancer: are they regulating for or against tumor progression? Cancer Immunol Immunother. 2014; 63:67–72. https://doi.org/10.1007/s00262-013-1490-y [PubMed]
- 20. Shou J, Zhang Z, Lai Y, Chen Z, Huang J. Worse outcome in breast cancer with higher tumor-infiltrating FOXP3+ Tregs: a systematic review and meta-analysis. BMC Cancer. 2016; 16:687. https://doi.org/10.1186/s12885-016-2732-0 [PubMed]
- 21. Gatti-Mays ME, Balko JM, Gameiro SR, Bear HD, Prabhakaran S, Fukui J, Disis ML, Nanda R, Gulley JL, Kalinsky K, Abdul Sater H, Sparano JA, Cescon D, et al. If we build it they will come: targeting the immune response to breast cancer. NPJ Breast Cancer. 2019; 5:37. https://doi.org/10.1038/s41523-019-0133-7 [PubMed]
- 22. Pareja F, Brandes AH, Basili T, Selenica P, Geyer FC, Fan D, Da Cruz Paula A, Kumar R, Brown DN, Gularte-Mérida R, Alemar B, Bi R, Lim RS, de Bruijn I, et al. Loss-of-function mutations in ATP6AP1 and ATP6AP2 in granular cell tumors. Nat Commun. 2018; 9:3533. https://doi.org/10.1038/s41467-018-05886-y [PubMed]
- 23. Romero-Garcia S, Prado-Garcia H, Carlos-Reyes A. Role of DNA Methylation in the Resistance to Therapy in Solid Tumors. Front Oncol. 2020; 10:1152. https://doi.org/10.3389/fonc.2020.01152 [PubMed]
- 24. Terry MB, McDonald JA, Wu HC, Eng S, Santella RM. Epigenetic Biomarkers of Breast Cancer Risk: Across the Breast Cancer Prevention Continuum. Adv Exp Med Biol. 2016; 882:33–68. https://doi.org/10.1007/978-3-319-22909-6_2 [PubMed]
- 25. Biancolella M, Testa B, Baghernajad Salehi L, D’Apice MR, Novelli G. Genetics and Genomics of Breast Cancer: update and translational perspectives. Semin Cancer Biol. 2021; 72:27–35. https://doi.org/10.1016/j.semcancer.2020.03.013 [PubMed]
- 26. Argentieri MA, Nagarajan S, Seddighzadeh B, Baccarelli AA, Shields AE. Epigenetic Pathways in Human Disease: The Impact of DNA Methylation on Stress-Related Pathogenesis and Current Challenges in Biomarker Development. EBioMedicine. 2017; 18:327–50. https://doi.org/10.1016/j.ebiom.2017.03.044 [PubMed]
- 27. Donlon TA, Morris BJ. In silico analysis of human renin gene-gene interactions and neighborhood topologically associated domains suggests breakdown of insulators contribute to ageing-associated diseases. Biogerontology. 2019; 20:857–69. https://doi.org/10.1007/s10522-019-09834-1 [PubMed]
- 28. Gul R, Kim UH, Alfadda AA. Renin angiotensin system at the interface of COVID-19 infection. Eur J Pharmacol. 2021; 890:173656. https://doi.org/10.1016/j.ejphar.2020.173656 [PubMed]
- 29. Tianyuan L, Cheng X, Yang M. The Role and Mechanism of V-ATPases in Tumors. Chinese Journal of Biochemistry and Molecular Biology. 2019; 35:945–51. https://doi.org/10.13865/j.cnki.cjbmb.2019.09.04
- 30. du Rusquec P, Blonz C, Frenel JS, Campone M. Targeting the PI3K/Akt/mTOR pathway in estrogen-receptor positive HER2 negative advanced breast cancer. Ther Adv Med Oncol. 2020; 12:1758835920940939. https://doi.org/10.1177/1758835920940939 [PubMed]
- 31. Osborne CK, Schiff R. Mechanisms of endocrine resistance in breast cancer. Annu Rev Med. 2011; 62:233–47. https://doi.org/10.1146/annurev-med-070909-182917 [PubMed]
- 32. Hong J, Wuest TR, Min Y, Lin PC. Oxygen Tension Regulates Lysosomal Activation and Receptor Tyrosine Kinase Degradation. Cancers (Basel). 2019; 11:1653. https://doi.org/10.3390/cancers11111653 [PubMed]
- 33. Mamo M, Ye IC, DiGiacomo JW, Park JY, Downs B, Gilkes DM. Hypoxia Alters the Response to Anti-EGFR Therapy by Regulating EGFR Expression and Downstream Signaling in a DNA Methylation-Specific and HIF-Dependent Manner. Cancer Res. 2020; 80:4998–5010. https://doi.org/10.1158/0008-5472.CAN-20-1232 [PubMed]
- 34. Wang Y, Sun L, Wang L, Liu Z, Li Q, Yao B, Wang C, Chen T, Tu K, Liu Q. Long non-coding RNA DSCR8 acts as a molecular sponge for miR-485-5p to activate Wnt/β-catenin signal pathway in hepatocellular carcinoma. Cell Death Dis. 2018; 9:851. https://doi.org/10.1038/s41419-018-0937-7 [PubMed]
- 35. Yang F, Lyu S, Dong S, Liu Y, Zhang X, Wang O. Expression profile analysis of long noncoding RNA in HER-2-enriched subtype breast cancer by next-generation sequencing and bioinformatics. Onco Targets Ther. 2016; 9:761–72. https://doi.org/10.2147/OTT.S97664 [PubMed]
- 36. Puustinen MC, Sistonen L. Molecular Mechanisms of Heat Shock Factors in Cancer. Cells. 2020; 9:1202. https://doi.org/10.3390/cells9051202 [PubMed]
- 37. Rhodes DR, Yu J, Shanker K, Deshpande N, Varambally R, Ghosh D, Barrette T, Pandey A, Chinnaiyan AM. Large-scale meta-analysis of cancer microarray data identifies common transcriptional profiles of neoplastic transformation and progression. Proc Natl Acad Sci U S A. 2004; 101:9309–14. https://doi.org/10.1073/pnas.0401994101 [PubMed]
- 38. Tang Z, Li C, Kang B, Gao G, Li C, Zhang Z. GEPIA: a web server for cancer and normal gene expression profiling and interactive analyses. Nucleic Acids Res. 2017; 45:W98–102. https://doi.org/10.1093/nar/gkx247 [PubMed]
- 39. Uhlen M, Zhang C, Lee S, Sjostedt E, Fagerberg L, Bidkhori G, Benfeitas R, Arif M, Liu Z, Edfors F, Sanli K, von Feilitzen K, Oksvold P, et al. A pathology atlas of the human cancer transcriptome. Science. 2017; 357:eaan2507. https://doi.org/10.1126/science.aan2507 [PubMed]
- 40. Huang J, Hume AJ, Abo KM, Werder RB, Villacorta-Martin C, Alysandratos KD, Beermann ML, Simone-Roach C, Lindstrom-Vautrin J, Olejnik J, Suder EL, Bullitt E, Hinds A, et al. SARS-CoV-2 Infection of Pluripotent Stem Cell-Derived Human Lung Alveolar Type 2 Cells Elicits a Rapid Epithelial-Intrinsic Inflammatory Response. Cell Stem Cell. 2020; 27:962–73.e7. https://doi.org/10.1016/j.stem.2020.09.013 [PubMed]
- 41. Han Y, Duan X, Yang L, Nilsson-Payant BE, Wang P, Duan F, Tang X, Yaron TM, Zhang T, Uhl S, Bram Y, Richardson C, Zhu J, et al. Identification of SARS-CoV-2 inhibitors using lung and colonic organoids. Nature. 2021; 589:270–75. https://doi.org/10.1038/s41586-020-2901-9 [PubMed]
- 42. Nagy Á, Lánczky A, Menyhárt O, Győrffy B. Validation of miRNA prognostic power in hepatocellular carcinoma using expression data of independent datasets. Sci Rep. 2018; 8:9227. https://doi.org/10.1038/s41598-018-27521-y [PubMed]
- 43. Ru B, Wong CN, Tong Y, Zhong JY, Zhong SSW, Wu WC, Chu KC, Wong CY, Lau CY, Chen I, Chan NW, Zhang J. TISIDB: an integrated repository portal for tumor-immune system interactions. Bioinformatics. 2019; 35:4200–02. https://doi.org/10.1093/bioinformatics/btz210 [PubMed]
- 44. Zhang X, Lan Y, Xu J, Quan F, Zhao E, Deng C, Luo T, Xu L, Liao G, Yan M, Ping Y, Li F, Shi A, et al. CellMarker: a manually curated resource of cell markers in human and mouse. Nucleic Acids Res. 2019; 47:D721–28. https://doi.org/10.1093/nar/gky900 [PubMed]
- 45. Cerami E, Gao J, Dogrusoz U, Gross BE, Sumer SO, Aksoy BA, Jacobsen A, Byrne CJ, Heuer ML, Larsson E, Antipin Y, Reva B, Goldberg AP, et al. The cBio cancer genomics portal: an open platform for exploring multidimensional cancer genomics data. Cancer Discov. 2012; 2:401–04. https://doi.org/10.1158/2159-8290.CD-12-0095 [PubMed]
- 46. Gao J, Aksoy BA, Dogrusoz U, Dresdner G, Gross B, Sumer SO, Sun Y, Jacobsen A, Sinha R, Larsson E, Cerami E, Sander C, Schultz N. Integrative analysis of complex cancer genomics and clinical profiles using the cBioPortal. Sci Signal. 2013; 6:pl1. https://doi.org/10.1126/scisignal.2004088 [PubMed]
- 47. Chandrashekar DS, Bashel B, Balasubramanya SAH, Creighton CJ, Ponce-Rodriguez I, Chakravarthi BVSK, Varambally S. UALCAN: A Portal for Facilitating Tumor Subgroup Gene Expression and Survival Analyses. Neoplasia. 2017; 19:649–58. https://doi.org/10.1016/j.neo.2017.05.002 [PubMed]
- 48. Szklarczyk D, Gable AL, Lyon D, Junge A, Wyder S, Huerta-Cepas J, Simonovic M, Doncheva NT, Morris JH, Bork P, Jensen LJ, Mering CV. STRING v11: protein-protein association networks with increased coverage, supporting functional discovery in genome-wide experimental datasets. Nucleic Acids Res. 2019; 47:D607–13. https://doi.org/10.1093/nar/gky1131 [PubMed]
- 49. Zhou Y, Zhou B, Pache L, Chang M, Khodabakhshi AH, Tanaseichuk O, Benner C, Chanda SK. Metascape provides a biologist-oriented resource for the analysis of systems-level datasets. Nat Commun. 2019; 10:1523. https://doi.org/10.1038/s41467-019-09234-6 [PubMed]