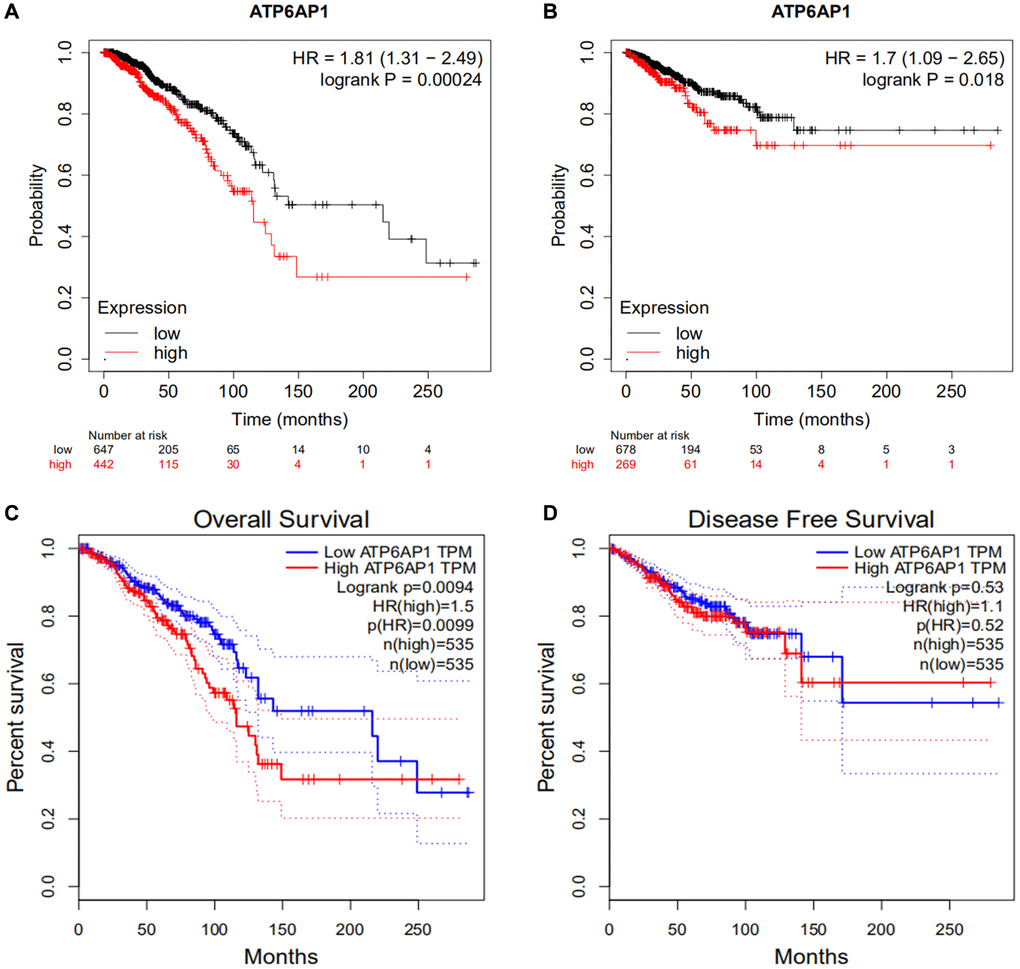
Figure 2.Survival curves in BC patients with higher and lower ATP6AP1 levels. (A, B) OS and RFS of BC patients from the Kaplan-Meier plotter database (n = 1089 and n = 947, respectively). (C, D) OS and DFS curves of BC patients from GEPIA (n = 1070 and n = 1070, respectively).