


Introduction
Endometrial cancer (EC) is the leading gynecologic tumor in developed countries and remains the second most frequently occurring tumor in developing countries. With the decline in birth rate and the growing epidemic of obesity, its incidence rate has increased significantly. It was reported that there were an estimated 382,000 new cases and 89,900 deaths worldwide in 2018 [1]. Although surgical treatment provides early-stage EC patients with a good prognosis, the 5-year OS of relapsed or metastatic EC patients is decreased dramatically [2]. Therefore, careful prognostic evaluation is urgently needed.
Since iron has a unique role and function in the female reproductive system, it is not surprising that iron disorders have been noted in many gynecological diseases [3]. It was reported that iron-mediated cell death (ferroptosis) was closely related to several endometrial diseases, such as endometriosis [3], repeated implantation failure [4], and endometrial hyperplasia [5], and it can be used as a therapeutic target for these diseases [5–7]. Ferroptosis is a novel form of programmed cell death induced by the excess accumulation of iron-dependent lipid peroxidation products [8]. Studies have revealed that ferroptosis is related to the growth and development of EC [9, 10] and various other cancers, such as pancreatic cancer [11], hepatocellular carcinoma [12], gastric cancer [13, 14], colorectal cancer [15, 16], breast cancer [17, 18], lung cancer [19], ovarian cancer [20], clear cell renal cell carcinoma [21, 22], and head and neck cancer [23]. However, the role of ferroptosis in EC remains unclear; thus, it is imperative to explore the relationship between EC and ferroptosis.
To explore the relationship between ferroptosis-related genes (FRGs) and the prognostic value of ferroptosis in EC, we collected 135 FRGs, downloaded 552 UCEC samples from The Cancer Genome Atlas (TCGA) and constructed a prognostic signature containing eight FRGs. The results showed that FRGs may play a critical role in EC.
Results
Identification of candidate FRGs
We obtained 87 differentially expressed ferroptosis-related genes (DE-FRGs) (false discovery rate (FDR) < 0.05) through the Wilcoxon test and the “limma” R package between 23 normal samples and 276 training samples. Then, we extracted 12 prognostic FRGs through univariate Cox analysis implemented by the “survival” R package (P < 0.05) (Supplementary Figure 1). Intersecting the 87 DE-FRGs and the 12 prognostic FRGs resulted in eight prognostic FRGs, namely, MDM2, GPX4, PRKAA2, PRNP, SLC11A2, ATP5MC3, PHKG2 and ACO1. From the results of univariate Cox regression analysis, we found that MDM2, GPX4, SLC11A2 and PHKG2 are favorable genes; that is, those with high expression levels of these genes had a good prognosis. PRKAA2, PRNP, ATP5MC3 and ACO1 were unfavorable genes (Figure 1A). From the heatmap in Figure 1B and the mean expression of the eight FRGs in Table 1, we could see that the eight FRGs were abnormally expressed in EC samples compared with normal samples. The expression levels of GPX4, ATP5MC3, SLC11A2,PHKG2 and MDM2 were upregulated in the EC group, while the expression levels of PRNP, ACO1 and PRKAA2 were higher in the normal group.
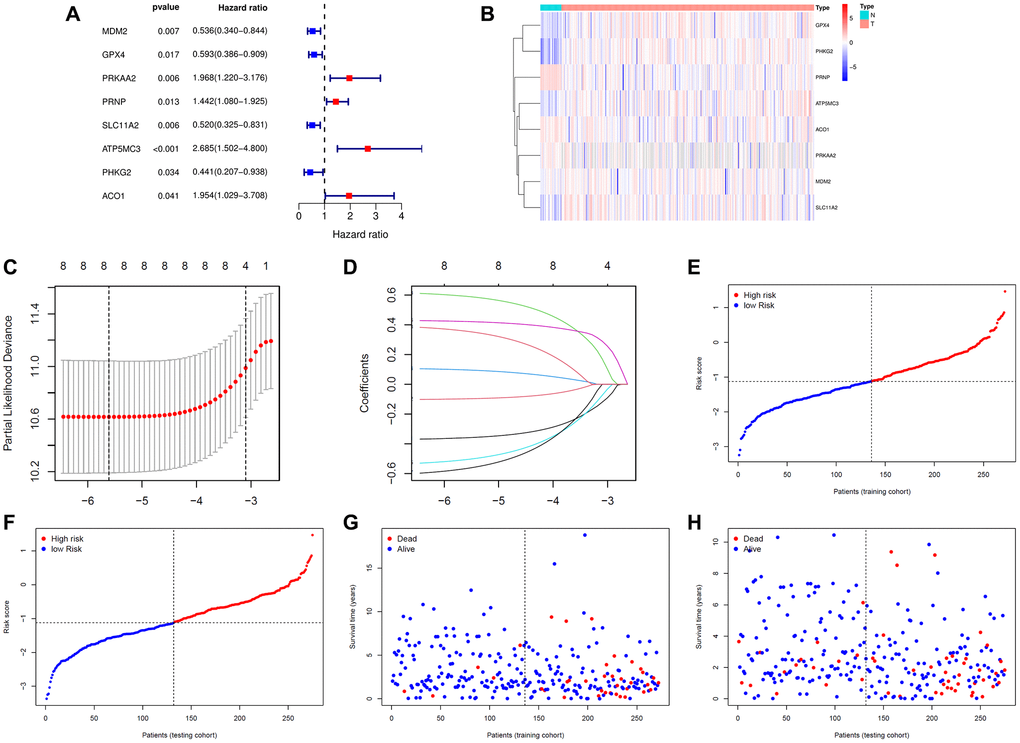
Figure 1. Construction of the signature. (A) The prognostic analyses for eight ferroptosis-related genes in the training cohort of endometrial cancer using a univariate Cox regression model. Hazard ratio >1 represented risk factors for survival and hazard ratio <1 represented protective factors for survival. (B) Heatmap of eight ferroptosis-related genes in 23 normal samples and 272 endometrial cancer samples. (C) Optimal parameter (λ) selected in the LASSO Cox regression model based on the minimum criteria. (D) The LASSO coefficient profiles of the eight ferroptosis-related genes signature. (E) The distribution and median value of the risk scores in the training cohort. (F) The distribution and median value of the risk scores in the training cohort. (G) Survival statuses of endometrial cancer patients in the training cohort. (H) Survival statuses of endometrial cancer patients in the testing cohort.
Table 1. Mean expression and calculated difference value of eight FRGs.
| Gene ID | ConMean | EC.Mean | logFC | P Value | FDR | Coef | |||||||||||||||||||||||||||||||||||||||||||||||||||||||||||||||||||||||||||||||||||||||||||||
| MDM2 | 5.209091 | 7.138429 | 0.454575 | 0.024106 | 0.033182 | –0.34216 | |||||||||||||||||||||||||||||||||||||||||||||||||||||||||||||||||||||||||||||||||||||||||||||
| GPX4 | 77.67361 | 197.0067 | 1.342749 | 3.29E-10 | 2.14E-09 | –0.08952 | |||||||||||||||||||||||||||||||||||||||||||||||||||||||||||||||||||||||||||||||||||||||||||||
| PRKAA2 | 2.082538 | 1.557735 | –0.41889 | 0.000291 | 0.000576 | 0.55497 | |||||||||||||||||||||||||||||||||||||||||||||||||||||||||||||||||||||||||||||||||||||||||||||
| PRNP | 82.51514 | 18.32231 | –2.17106 | 4.29E-14 | 1.25E-12 | 0.08230 | |||||||||||||||||||||||||||||||||||||||||||||||||||||||||||||||||||||||||||||||||||||||||||||
| SLC11A2 | 6.368706 | 12.21955 | 0.940119 | 1.06E-05 | 2.48E-05 | –0.46253 | |||||||||||||||||||||||||||||||||||||||||||||||||||||||||||||||||||||||||||||||||||||||||||||
| ATP5MC3 | 15.5362 | 25.16703 | 0.695901 | 1.40E-07 | 4.97E-07 | 0.41109 | |||||||||||||||||||||||||||||||||||||||||||||||||||||||||||||||||||||||||||||||||||||||||||||
| PHKG2 | 2.96983 | 7.257239 | 1.28904 | 1.79E-12 | 2.09E-11 | –0.50883 | |||||||||||||||||||||||||||||||||||||||||||||||||||||||||||||||||||||||||||||||||||||||||||||
| ACO1 | 7.499537 | 5.685589 | –0.39949 | 0.000159 | 0.000332 | 0.30930 | |||||||||||||||||||||||||||||||||||||||||||||||||||||||||||||||||||||||||||||||||||||||||||||
| Abbreviations: ConMean: Mean gene expression in normal samples; FDR: false discovery rate; EC.Mean: Mean gene expression in endometrial cancer samples; Coef: Coefficients in prognostic models. | |||||||||||||||||||||||||||||||||||||||||||||||||||||||||||||||||||||||||||||||||||||||||||||||||||
Construction and validation of a prognostic FRG signature
Then, these eight FRGs were input into the LASSO regression model for feature selection. Under penalizing conditions (alpha = 1), 8 FRG scores with nonzero coefficients were selected to formulate the risk score: Risk score = (–0.34216 × MDM2 expression) + (–0.08952 × GPX4 expression) + (0.55497 × PRKAA2 expression) + (0.08230 x PRNP expression) + (–0.46253 × SLC11A2 expression) + (0.41109 × ATP5MC3 expression) + (–0.50883 × PHKG2 expression) + (0.30930 × ACO1 expression) (Figure 1C, 1D). According to the median risk score of the training group, the samples were divided into low- and high-risk groups (Figure 1E–1H). By principal component analysis (PCA), we also demonstrated that EC samples in different risk groups were distributed in two directions as a whole (Figure 2A, 2B). The Kaplan-Meier survival curves of the training group showed that the predicted survival time of the low-risk group was obviously longer than that of the high-risk group, P < 0.001 (Figure 2C, 2D). Time-dependent receiver operating characteristic (ROC) curves of the EC samples showed that the 1-year area under the curve (AUC) was 0.676, the 2-year AUC was 0.775, the 3-year AUC was 0.797, and the 5-year AUC was 0.826 in the training group, and the 1-year AUC was 0.692, the 2-year AUC was 0.704, the 3-year AUC was 0.670, and the 5-year AUC was 0.690 in the testing group, which indicated that the performance of the 8-FRG signature was very stable (Figure 2E, 2F).
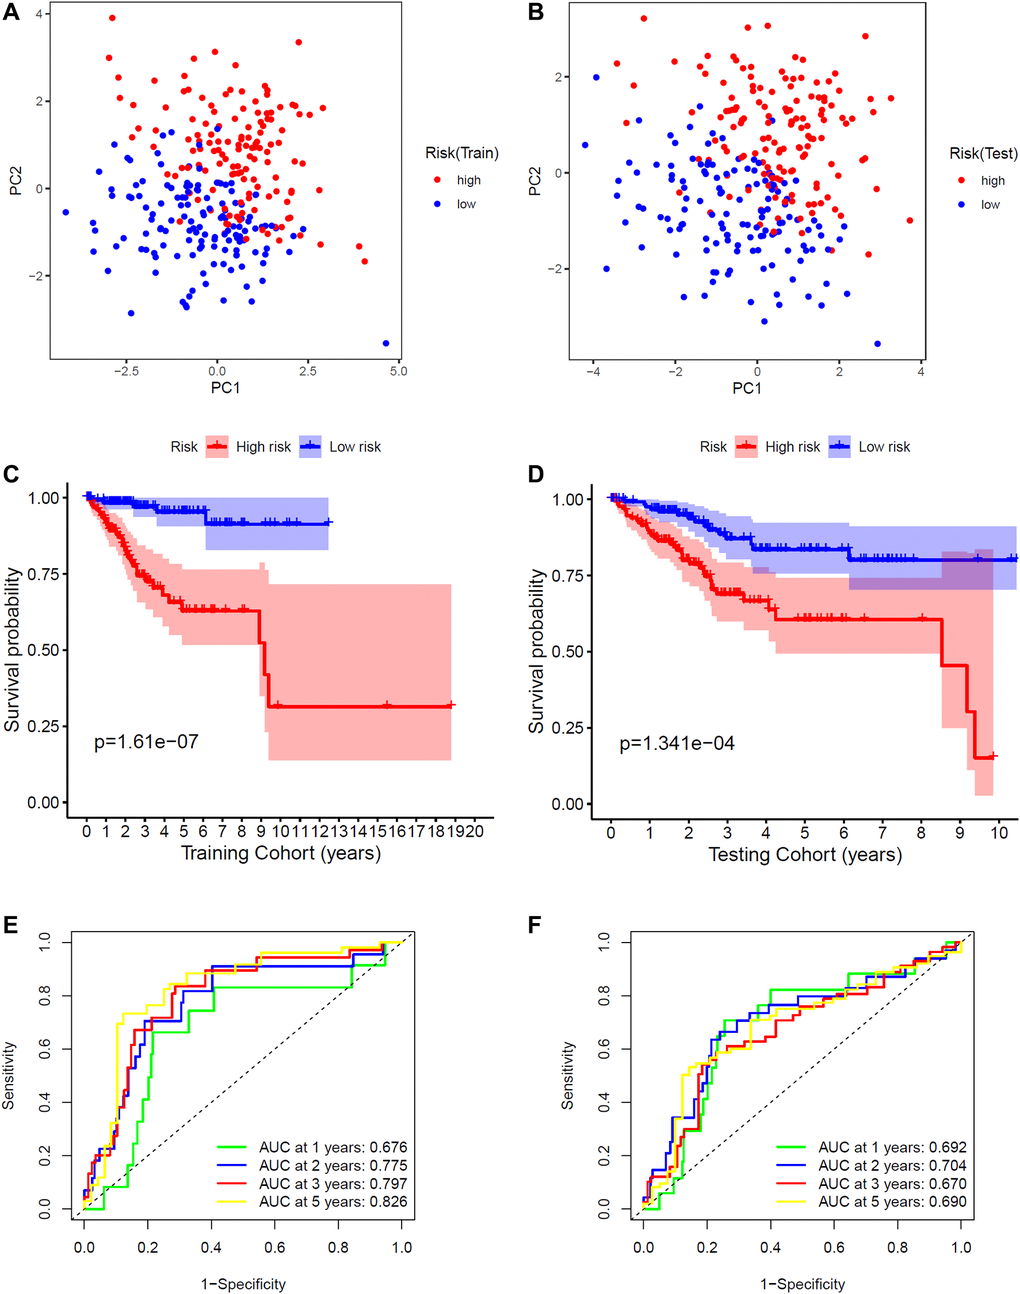
Figure 2. Validation of the signature. (A) PCA plot in the training cohort. (B) PCA plot in the training and testing cohorts. (C) K-M survival curve of endometrial cancer patients in the training group. (D) K-M survival curve of endometrial cancer patients in the testing group. (E) Time-dependent ROC curve of endometrial cancer patients in the training group. (F) Time-dependent ROC curve of endometrial cancer patients in the testing group.
The above analysis showed that this signature performed well. Then, we wanted to determine whether the signature was an independent prognostic factor, so we performed univariate and multivariate Cox regression analyses, which showed that the signature was indeed an independent prognostic factor (Figure 3A–3D).
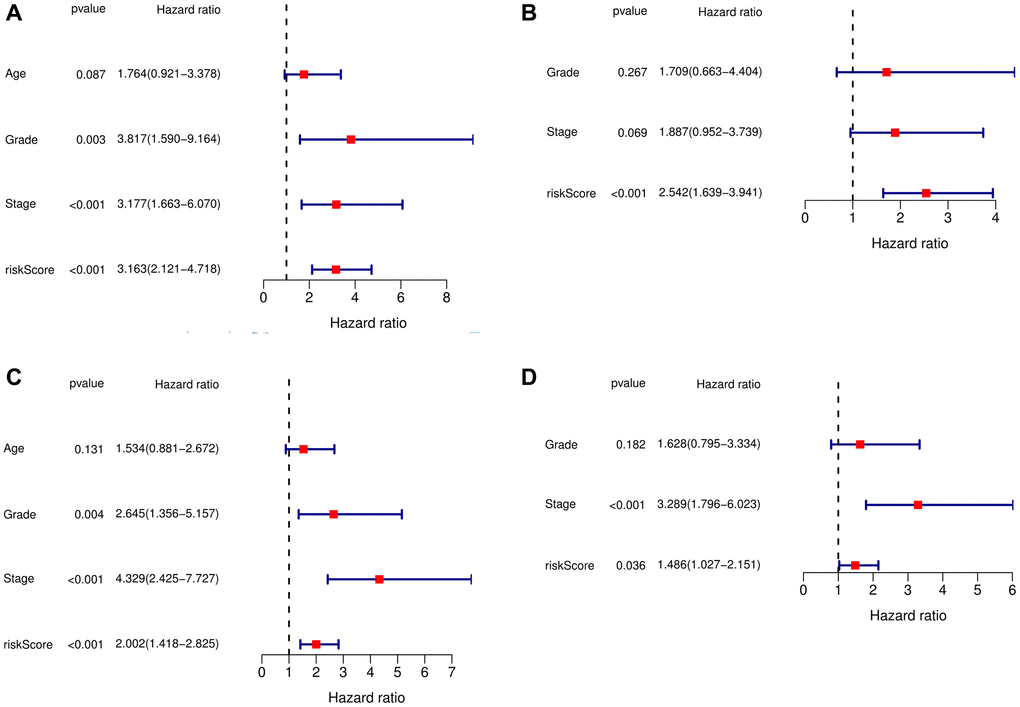
Figure 3. Independent prognostic analysis of risk scores and clinical parameters. (A) Univariate Cox regression analysis in the training cohort. (B) The multivariate Cox regression analysis in the training cohort. (C) The univariate Cox regression analysis in the testing cohort. (D) The multivariate Cox regression analysis in the testing cohort.
Functional annotation
To observe the expression specificity of these eight FRGs in different tissues of the human body, we searched the Human Protein Atlas (HPA) database. We found that PHKG2 and GPX4 were specifically highly expressed in germ cells; ATP5MC3 was specifically highly expressed in distal tubular cells, proximal tubular cells, Hofbauer cells, extravillous trophoblasts, and cytotrophoblasts; PRNP was highly expressed in basal keratinocytes; ACO1 was highly expressed in hepatocytes and proximal tubular cells; PRKAA2 was highly expressed in cardiomyocytes and rod photoreceptor cells; and MDM2 and SLC11A2 had low cell-type specificity (Supplementary Figure 2A–2J). Then, we explored the relationships among the eight FRGs through Search Tool for the Retrieval of Interacting Genes/Proteins (STRING) and Pearson correlation analysis. The STRING results showed that SLC11A2 was related to ACO1, while the others were independent of each other (Figure 4A). The correlation network of these 8 FRGs showed that there was a positive coexpression correlation among PRKAA2, MDM2 and SLC11A2. ATP5MC3 and ACO1 had a similar positive correlation. PRNP and GPX4, PRKAA2 and GPX4, PHKG2 and SLC11A2, and PHKG2 and ACO1 showed negative coexpression correlations (Figure 4B).
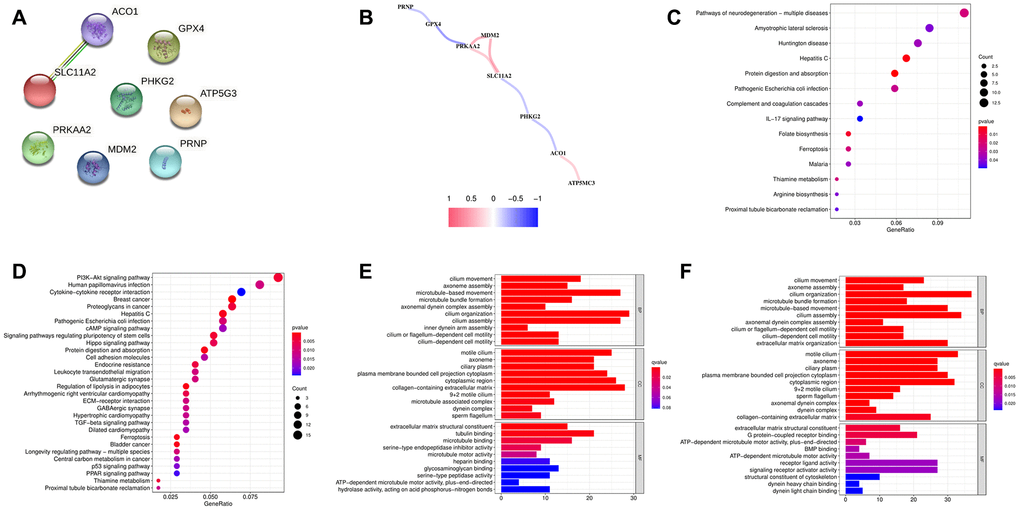
Figure 4. (A) PPI of eight ferroptosis-related genes (FRGs). (B) Correlation network of the eight FRGs. (C) KEGG analysis of the differentially expressed genes (DEGs) between the low- and high-risk groups in the training cohort. (D) KEGG analysis of the DEGs between the low- and high-risk groups in the testing cohort. (E) GO analysis of the DEGs between the low- and high-risk groups in the training cohort. (F) GO analysis of the DEGs between the low- and high-risk groups in the testing cohort.
Kyoto Encyclopedia of Genes and Genomes (KEGG) analysis of these eight FRGs showed that they were mainly related to ferroptosis (Supplementary Figure 3A). Gene Ontology (GO) analysis of the biological processes of these eight FRGs showed that they were mainly related to metal ions. Their molecular functions were mainly involved in proton transmembrane transporter activity and monovalent inorganic cation transmembrane transporter activity (Supplementary Figure 3B). KEGG analysis of the differentially expressed genes (DEGs) between the low- and high-risk groups showed that they were mainly enriched in cancer-associated pathways, such as the PI3K-Akt signaling pathway [24], human papillomavirus infection [25], breast cancer, proteoglycans in cancer, protein digestion and absorption, and hepatitis C [26] (Figure 4C, 4D). GO analysis of biological processes and cellular components showed that the DEGs were mainly related to the cilium. Molecular function analysis showed that the DEGs were mainly related to tubulin binding (Figure 4E, 4F).
Immune annotation
Since ferroptosis is closely related to immunity, we explored the differences in immune infiltration between the high- and low-risk groups. CIBERSORT is a classic method for characterizing the composition of 22 immune cells from gene expression profiles in complex tissues [24], so we used it to analyze the composition of immune cells. Through CIBERSORT algorithm analysis, we obtained 243 EC patients (133 low-risk patients and 110 high-risk patients) whose CIBERSORT results showed P < 0.05. The results are presented in the form of a heatmap and bar plot (Figure 5A, 5B). As seen from the figure, the composition of tumor-infiltrating immune cells (TIICs) in the high- and low-risk groups remained basically the same, mainly composed of M0 macrophages, CD8 T cells and resting memory CD4 T cells, with significant differences in some immune cells, such as M2 macrophages. The relatively high expression of CD8 T cells may be the reason why endometrial carcinoma has a better prognosis than highly malignant tumors. It can also be seen that local immunity is not strongly suppressed in these EC patients. Wilcoxon test analysis showed that plasma cells and regulatory T cells (Tregs) showed higher infiltration in the low-risk group than in the high-risk group. Activated memory CD4 T cells, activated dendritic cells (aDCs), M1 macrophages and M2 macrophages showed higher infiltration in the high-risk group (Figure 5C).
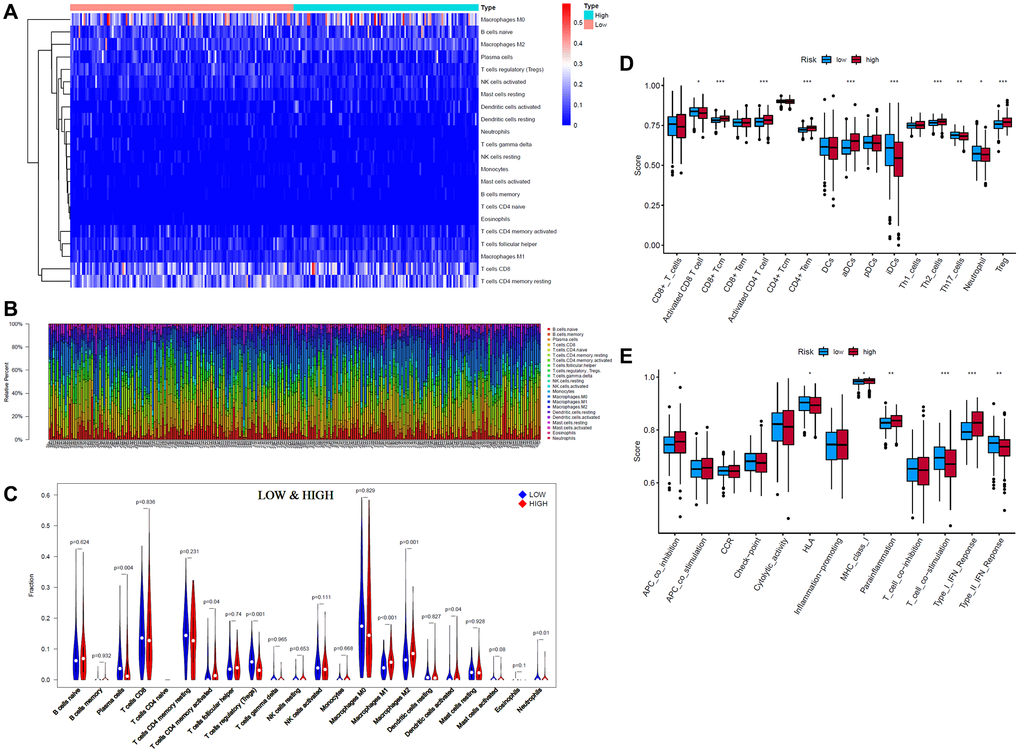
Figure 5. Tumor-infiltrating immune cells (TIICs) analysis of 243 endometrial cancer (EC) patients (133 low-risk patients and 110 high-risk patients) (CIBERSORT: P < 0.05). (A, B) Composition of 22 TIICs. (C) Wilcoxon test analysis of 22 TIICs between low- and high-risk EC patients. (D, E) Single-sample gene set enrichment analysis (ssGSEA) of specific immune cells and immune functions (*p < 0.05; **p < 0.01; ***p < 0.001).
Considering the high proportion of CD8 T cells in the high- and low-risk groups, the particularity of activated memory CD4 T cells and the poor display of neutrophils and dendritic cells (DCs) in the violin plot, we further conducted single-sample gene set enrichment analysis (ssGSEA) for these cells and other immune functions (Figure 5D, 5E). The ssGSEA results were consistent with those of CIBERSORT. CD8 T cells, DCs, and plasmacytoid DCs (pDCs) did not differ between the high- and low-risk groups. There was also no difference in effector memory CD8 T cells (CD8+ Tem). However, activated CD8 T cells were more significantly enriched in the low-risk group, while central memory CD8 T cells were more significantly enriched in the high-risk group. Activated CD4 T cells, effector memory CD4 T cells (CD4+ Tem), and aDCs were also more significantly enriched in the high-risk group, while immature dendritic cells (iDCs) and neutrophils were more significantly enriched in the low-risk group. In addition, the ssGSEA results of immune function showed that aDCs, NK cells, APC coinhibition, MHC class I, parainflammation, and type I interferon (IFN) response were more significantly enriched in the high-risk group, while HLA, T cell costimulation, and type II IFN response were more significantly enriched in the low-risk group.
To better understand the relationship between the eight FRGs and TIICs, we searched the TIMER database (Figure 6A–6H). We could see from the left-most panel, which displays the gene expression levels (log2 TPM) against tumor purity, that MDM2 expression was higher in the microenvironment in EC (cor = –0.116, P = 0.048). ACO1, GPX4, PRNP and SLC11A2 may be highly expressed in the microenvironment, but the difference was not statistically significant (cor < 0, P > 0.05). ATP5G3, PHKG2 and PRKAA2 may be highly expressed in tumor cells, but the difference was not statistically significant (cor > 0, P > 0.05). The results also showed that ACO1 was positively correlated with macrophages, neutrophils, CD8+ T cells and DCs (P < 0.05) and negatively associated with CD4+ T cells (cor = 0.123, P = 0.036). ATP5MC3 was negatively correlated with B cells (P = 0.048) and CD4+ T cells and positively correlated with neutrophils (P = 0.003). GPX4 was negatively associated with neutrophils (P < 0.001) and positively associated with CD4+ T cells (P = 0.025). MDM2 was significantly positively associated with CD8+ T cells, CD4+ T cells, macrophages and DCs (P < 0.05). PHKG2 was negatively correlated with CD8+ T cells and DCs (cor < 0, P < 0.05). PRKAA2 was significantly negatively correlated with B cells, CD4+ T cells, and macrophages and positively correlated with CD8+ T cells and neutrophils (P < 0.05). PRNP was significantly positively associated with CD8+ T cells, macrophages, neutrophils and DCs (P < 0.05). SLC11A2 was negatively correlated with B cells and CD4+ T cells.
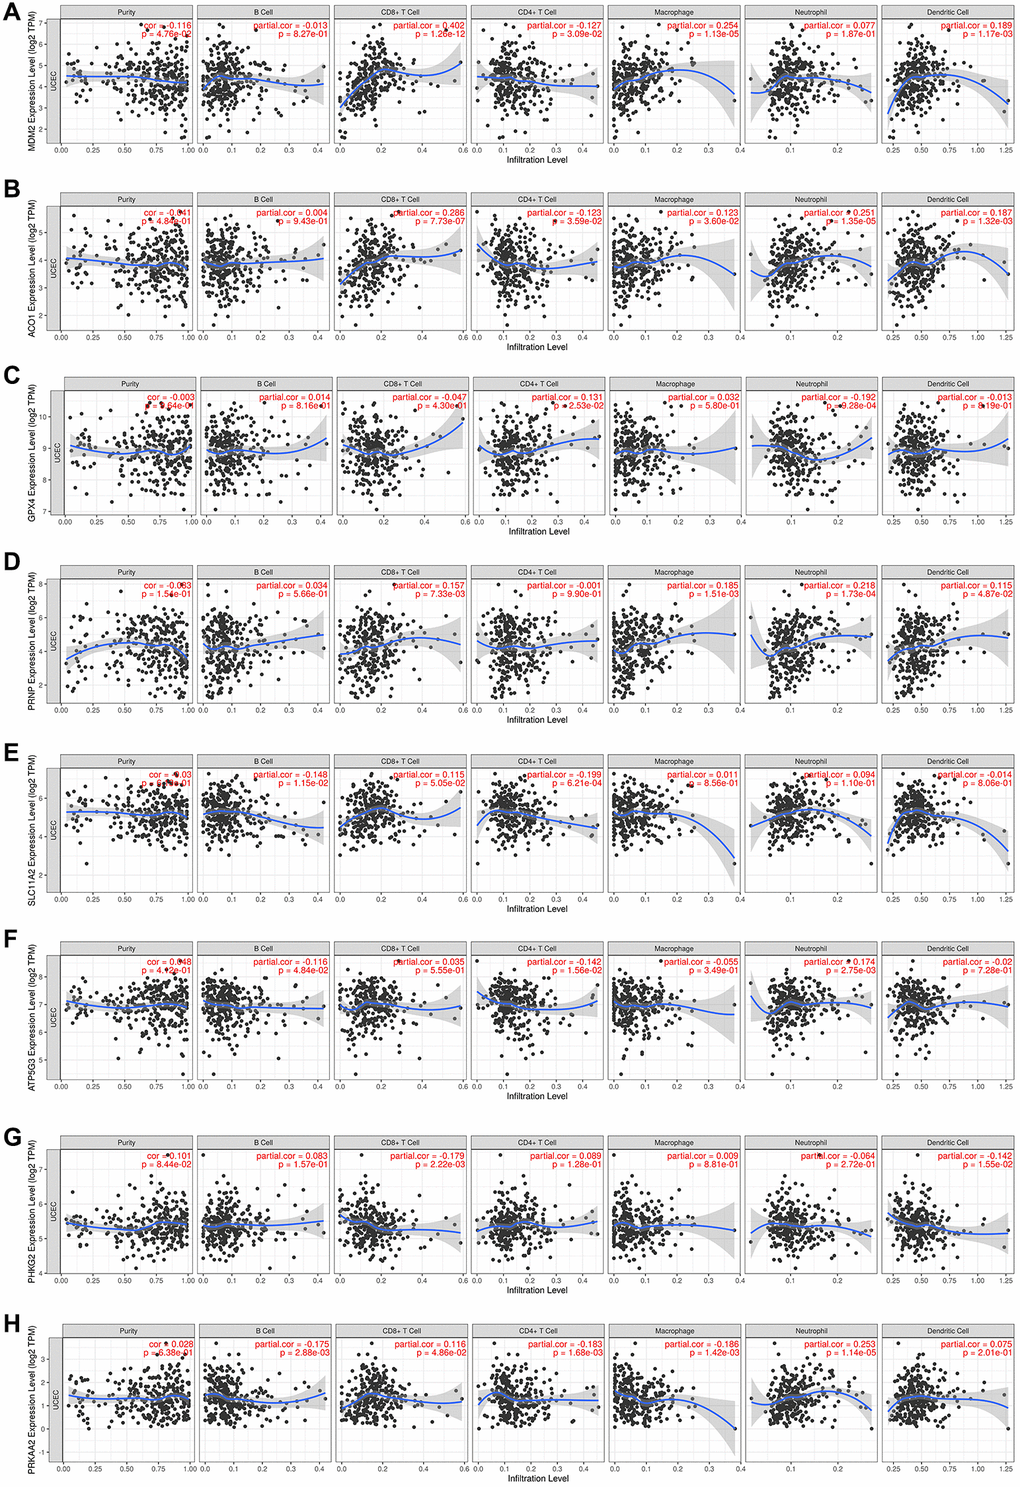
Figure 6. (A–H) The TIMER database results of the correlations between the expression of eight ferroptosis-related genes and immune infiltrating cells in endometrial cancer patients, showing the purity-corrected partial Spearman’s rho value and statistical significance.
Genetic variation
We then summarized the incidence of copy number variations (CNV) and somatic mutations of 8 FRGs in EC. Among 529 samples, 74 experienced alterations of 8 FRGs, with frequency 13.99%. The genetic alteration rates of MDM2, GPX4, PRKAA2, PRNP, SLC11A2, ATP5MC3, PHKG2 and ACO1 were 2%, 1%, 5%, 2%, 5%, 0%, 2% and 6%, respectively. Most of their genetic alteration type was missense mutation (Figure 7A). The investigation of CNV alteration frequency showed most were focused on the amplification in copy number, while GPX4 had a widespread frequency of CNV deletion (Figure 7B). The location of CNV alteration of FRGs on chromosomes was shown in Figure 7C. To ascertain whether the above genetic alterations influenced the expression of FRGs in EC patients, we investigated the mRNA expression levels of FRGs between normal and EC samples, and found that the alterations of CNV was not the prominent factors resulting in perturbations on the GPX4, ACO1 and PRNP expression. Compared to normal endometrial tissues, genes with amplificated CNV demonstrated markedly lower expression in EC tissues (e.g., ACO1 and PRNP), and vice versa (e.g., GPX4) (Figure 7C, 7D). The alterations of CNV could be the prominent factors resulting in perturbations on the PHKG2, SLC11A2 and ATP5MC3 expression. They exhibited higher expression in EC tissues, companied with amplificated CNV. The above analyses indicate a high degree of heterogeneity in the landscape of genetic and expressional alterations in FRGs between normal and EC samples.
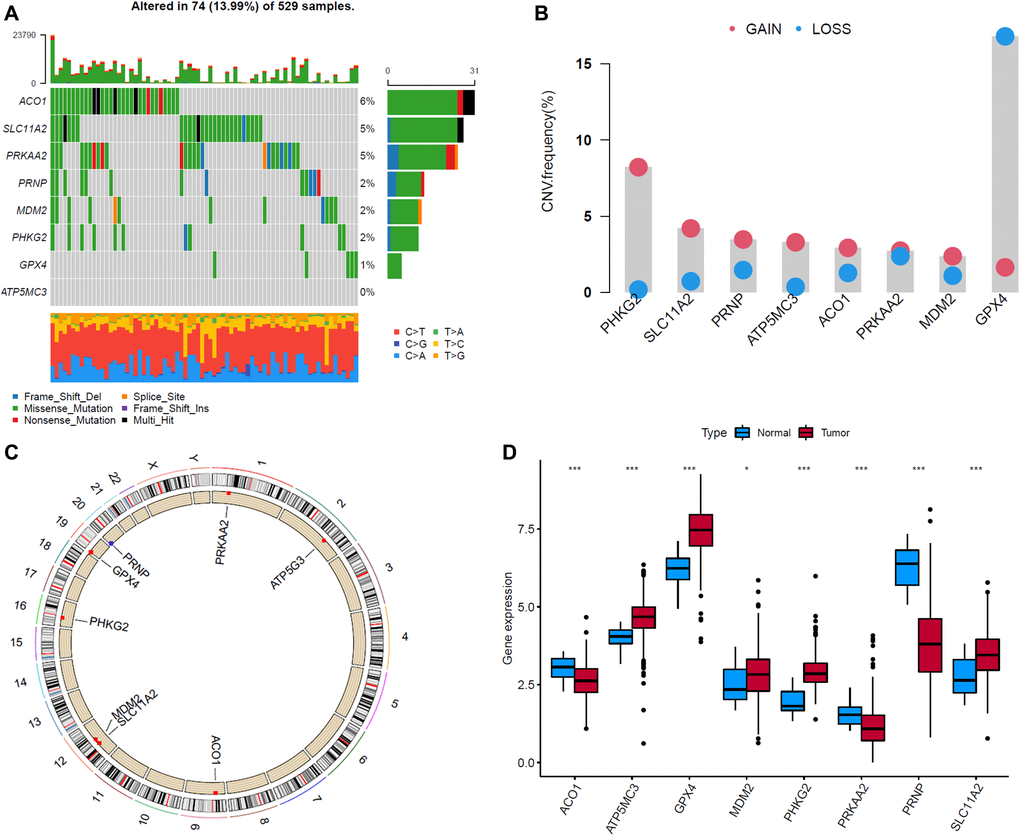
Figure 7. Landscape of genetic and expression variation of eight ferroptosis-related genes (FRGs) in endometrial cancer (EC) samples. (A) The alteration frequency of 8 FRGs in 529 EC samples. Each column represented individual patients. The upper bar plot showed TMB. The number on the right indicated the alteration frequency in each regulator. The right bar plot showed the proportion of each variant type. The stacked bar plot below showed fraction of conversions in each sample. (B) The CNV variation frequency of FRGs in EC samples. The height of the column represented the alteration frequency. The deletion frequency, blue dot; The amplification frequency, red dot. (C) The location of CNV alteration of FRGs on 23 chromosomes. (D) The expression of 8 FRGs between normal tissues and EC tissues. Tumor, red; Normal, blue. The upper and lower ends of the boxes represented interquartile range of values. The lines in the boxes represented median value, and black dots showed outliers. The asterisks represented the statistical p value (*P < 0.05; **P < 0.01; ***P < 0.001).
Discussion
EC is a heterogeneous disease. Although surgery can provide favorable survival in early-stage EC patients, the treatment measures and prognosis of advanced and metastatic EC remain poor. Since iron plays a critical role in the female reproductive system, iron-mediated cell death (ferroptosis) aroused our attention. A previous study found that cell death pathways, such as necroptosis and ferroptosis, are present in low-grade, early-stage endometrioid EC [10]. Interestingly, these proteomic research [10] results are consistent with our research results, namely, macrophage and CD8 T cell infiltration was significantly increased in EC tissues. Meanwhile, there was heterogeneity in the immune response between tumors (Figure 5A, 5B) [25]. In our study, TIICs in EC were analyzed by CIBERSORT, ssGSEA and the TIMER database. As seen in Figure 5C, 5D patients in the low-risk group had a better immune response to kill tumor cells, namely, more plasma cells and activated CD8+ T cells, and more enrichment in immune function of T cell costimulation and type II IFN response. T-cell costimulation is a hierarchical process with elements of mutual interdependence [26]. It is often essential for the development of an effective immune response. Type II IFN is mainly produced by activated T cells and NK cells. Although the proportion of Tregs in the low-risk group was significantly higher than that in the high-risk group, according to the calculation results of CIBERSORT, the enrichment score of Tregs in ssGSEA was significantly lower than that in the high-risk group. Combined with the greater enrichment of APC coinhibition of immune function, antitumor immunity was suppressed in the high-risk group. Tregs are an important subset of CD4+ T cells. Their function is to maintain immune homeostasis. Loss of function of Tregs can lead to autoimmunity, while excessive activity of Tregs can promote tumorigenesis [27]. Higher Tregs may be the result of higher parainflammation and a type I IFN response. Parainflammation is a type of inflammation between homeostasis and chronic inflammation. Numerous studies have shown that parainflammation is widely present in tumors and correlates with poor prognosis [28]. The function of pDCs is mainly to secrete type I IFN. Although the enrichment score of pDCs showed no difference between the high- and low-risk groups, the enrichment of type I IFN-responsive genes was significantly higher in the high-risk group. Type I IFN is mainly activated by viruses and responds to viral infection [29, 30].
T-helper 17 (Th17) cells can mobilize, recruit and activate neutrophils. In our results, Th17 cells were significantly enriched in the low-risk group. Th17 cells have also been suggested to be an independent prognostic factor for the survival of squamous cervical cancer and are significantly associated with improved disease-specific survival [31]. Kryczek et al. reported that decreased tumor ascites Th17 cells are a significant predictor of increased risk for reduced survival in ovarian cancer [32]. Th2 cells secrete IL-4 and IL-13, which can promote the differentiation of macrophages into M2 macrophages. Macrophages are cells that differentiate from mononuclear cells in the blood when they pass through the blood vessels. It is a plastic and pluripotent cell population, showing obvious functional differences under the influence of different microenvironments. In this article, M2 macrophages had a much higher proportion than M1 macrophages. M2 macrophages were more common in the high-risk group than in the low-risk group, which predicted a poorer prognosis. M2 is the pro-tumor subtype of macrophages. Jin et al. reported that TBBPA (a novel organic contaminant widely detected in human samples)-driven M2 macrophage polarization is responsible for EC deterioration [33]. M2 macrophage–conditioned medium treated with selective estrogen receptor alpha (ERα) agonists induced epithelial-to-mesenchymal transformation (EMT) in EC cells [34]. Although the high-risk group was enriched with more APCs (aDCs, activated CD4 T cells, MCH I class, etc.), its antigen-presenting function was significantly suppressed (higher enrichment of APC coinhibition).
In summary, our results showed that the low-risk group had a greater immune ability to kill tumor cells, while the immune response of the high-risk group was more strongly suppressed.
Glutathione peroxidase 4 (GPX4) is a key regulator of ferroptosis that catalyzes the reduction of hydrogen peroxide, organic hydroperoxides, and lipid hydroperoxides, thereby protecting cells against oxidative damage. It can also repair lipid peroxides as an antioxidant enzyme and regulate cytokine signaling [35, 36]. This is consistent with our findings: GPX4 is a favorable prognostic factor in EC patients. PRKAA2 encodes a catalytic subunit of AMP-activated protein kinase (AMPK), an important energy-sensing enzyme that monitors cellular energy status. HPA is a favorable prognostic marker for renal cancer and an unfavorable prognostic marker for liver cancer and EC, which is consistent with our results. In addition, high expression of PRKAA2 may predict poor prognosis in head and neck squamous cell carcinoma [37] and colorectal cancer (CRC) [38]. MDM2 is a p53 regulator and encodes a nuclear-localized E3 ubiquitin ligase that keeps the activity of p53 low under normal conditions by targeting p53 for degradation via the 26S proteasome [39]. In response to various oncogenic stresses, the p19ARF protein product of the INK4a locus binds to and disables the E3 ligase activity of MDM2; thus, hyperproliferative signals activate p53[40]. The MDM2 promoter SNP55 (rs2870820) T-allele was also associated with a reduced risk of endometrial cancer before 50 years of age [41]. However, the single-cell specificity of MDM2 was low (Supplementary Figure 2D). The TIMER results showed that MDM2 expression was higher in the microenvironment in EC and strongly positively associated with CD8+ T cells (cor = 0.402, P = 1.26e-12) (Figure 6A). The RNA blood cell type of MDM2 also showed that it was commonly expressed in all immune cells (Supplementary Figure 2J). Therefore, high levels of MDM2 and CD8+ T cells in the tumor microenvironment may be the reason why EC patients have a better OS. Zhou et al. reported that mice with MDM2-deficient T cells showed accelerated tumor progression and decreased survival and function of tumor-infiltrating CD8+ T cells [42]. Therefore, it is interesting to conduct further research on MDM2-CD8+ T cell-p53 in EC. SLC11A2 is the only known transmembrane iron transporter involved in cellular iron uptake, acting as a proton-dependent iron importer of Fe2+ [43]. Its relationship with cancer has not been reported. Our study shows that the expression of SLC11A2 is upregulated in EC, and it is positively coexpressed with MDM2. PHKG2 is a phosphorylase kinase. Methylation of PHKG2 may be associated with mutation of the BRAF/RAS oncogene in papillary thyroid cancer [44]. It is differentially expressed in paired normal tissue samples and EC samples [45] and could be inhibited by alectinib, which can strongly inhibit RET activity [46]. However, studies about its relationship with cancer are rare. The prion protein (PRNP) gene encodes a membrane glycosylphosphatidylinositol-anchored glycoprotein (prion protein, PrPC) that tends to aggregate into rod-like structures. It is involved in the main aspects of cancer biology: proliferation, metastasis, and drug resistance [47]. PRNP is associated with the prognosis of many cancers, such as gastric cancer [48], CRC [49] and pancreatic cancer [50]. Therefore, it is not surprising that it is a poor prognostic factor for EC. Reports on the correlation of ATP5MC3 (also known as P3 and ATP5G3) with cancer are lacking. However, according to data from the HPA database, it is a potentially favorable prognostic marker in renal cancer and CRC and a potentially unfavorable prognostic marker in head and neck cancer. In our reports, ATP5MC3 was an unfavorable prognostic factor for EC. Aconitase 1 (ACO1) encodes a bifunctional, cytosolic protein that functions as an essential enzyme in the TCA cycle and interacts with mRNA to control intracellular iron levels. When the iron content is high, this protein binds to 4Fe-4S and acts as an aconitase, catalyzing the conversion of citrate to isocitrate. When cellular iron levels are low, this protein binds to the iron response element, thereby inhibiting the translation of ferritin mRNA and the degradation of rapidly degrading transferrin receptor mRNA. It may be associated with tumor development and progression [51, 52].
This study also has limitations. First, the data were analyzed from the TCGA database. However, the sample size was large enough that we could perform random grouping to analyze and verify the data. Second, due to the scarcity of studies about ferroptosis in EC, the prognostic value and mechanisms of ferroptosis still need further validation in more studies.
In conclusion, we constructed a prognostic FRG signature in EC for the first time. We also validated that it can be a prognostic indicator independent of other clinical factors in EC. Since studies on the relationship between ferroptosis and EC are still rare, this study can also provide ideas and directions for ferroptosis-related studies in EC, which may be favorable for novel therapeutic methods.
Materials and Methods
Datasets and FRGs
Gene expression quantification RNA-Seq (HTSeq-FPKM) of transcriptome profiling and clinical data of uterine corpus endometrial carcinoma (UCEC) were downloaded from The Cancer Genome Atlas (TCGA) website (https://portal.gdc.cancer.gov), including 552 malignant tumor samples and 23 normal samples. A total of 552 malignant tumor samples were randomly assigned to two groups in a 1:1 ratio. Then, malignant tumor samples with incomplete key clinical information (age, grade, stage, survival time, survival status) were omitted, leaving 272 samples in the training group and 273 samples in the test group (Supplementary Table 1). A total of 103 ferroptosis-related genes (FRGs) were retrieved from GeneCards (https://www.genecards.org/), and 60 FRGs were retrieved from previous literature [20]. Intersecting the two sets of genes resulted in 135 FRGs (Supplementary Table 2). Finally, the expression of the eight genes in single cells was also analyzed in the Human Protein Atlas (HPA) database (https://www.proteinatlas.org).
Construction of the FRG signature
First, we screened the differentially expressed FRGs (DE-FRGs) between normal samples and EC patients in the training set by using the “limma” R package with P < 0.05 and false discovery rate (FDR) < 0.05. Then, we identified twelve potential prognostic FRGs in the training set through univariate Cox analysis of OS by using the coxph function in the “survival” R package with P < 0.05 (Supplementary Figure 4). Intersecting the two sets of genes resulted in eight FRGs (Supplementary Figure 1). Second, we put these eight prognostic FRGs into the least absolute shrinkage and selection operator (LASSO) regression model. The LASSO analysis with cross-validation was conducted by the “glmnet” R package [53, 54].
Verification of the FRG signature
The patients were classified into low- and high-risk subgroups based on the median risk score of the training group. We performed survival analysis to compare the OS between the high- and low-risk groups and showed results via Kaplan-Meier curves. Multivariate Cox analysis, receiver operating characteristic (ROC) analysis, and principal component analysis (PCA) were also performed to test the specificity and sensitivity of the survival prediction.
Functional annotation analysis
After verifying that this 8-FRG signature performed well, we obtained the differentially expressed genes (DEGs) between the low- and high-risk groups of EC patients in the training and testing groups by the “limma” R package and performed Gene Ontology (GO) and Kyoto Encyclopedia of Genes and Genomes (KEGG) enrichment analyses of the DEGs by using the “clusterProfiler” R package.
Statistical analysis
In this study, all statistical analyses were performed using R software (version 3.6.3). Continuous variables were compared using the Wilcoxon test. Survival analyses were conducted using the Kaplan–Meier method with the log-rank test by the “survival” R package. Feature selection was conducted with univariate and multivariate Cox regression. Time-dependent ROC curve analysis and LASSO Cox regression analysis with cross-validation were performed using R packages. Unless otherwise stated, statistical significance was defined at p values < 0.05.
Author Contributions
YWJ designed the study; YWJ and LFC collected and preliminary analyzed data. CMJ and QXQ interpreted the data; YWJ and GH drafted the manuscripts. YDS and LY made some modification; YDS was in charge of the entire study. The final draft was read and approved by all authors.
Acknowledgments
We would like to acknowledge TCGA, TIMER and the Human Protein Atlas Database for free use.
Conflicts of Interest
The authors declare no conflicts of interest related to this study.
References
- 1. Bray F, Ferlay J, Soerjomataram I, Siegel RL, Torre LA, Jemal A. Global cancer statistics 2018: GLOBOCAN estimates of incidence and mortality worldwide for 36 cancers in 185 countries. CA Cancer J Clin. 2018; 68:394–424. https://doi.org/10.3322/caac.21492 [PubMed]
- 2. Abu-Zaid A, Alomar O, Abuzaid M, Baradwan S, Salem H, Al-Badawi IA. Preoperative anemia predicts poor prognosis in patients with endometrial cancer: A systematic review and meta-analysis. Eur J Obstet Gynecol Reprod Biol. 2021; 258:382–90. https://doi.org/10.1016/j.ejogrb.2021.01.038 [PubMed]
- 3. Ng SW, Norwitz SG, Taylor HS, Norwitz ER. Endometriosis: The Role of Iron Overload and Ferroptosis. Reprod Sci. 2020; 27:1383–90. https://doi.org/10.1007/s43032-020-00164-z [PubMed]
- 4. Bielfeld AP, Pour SJ, Poschmann G, Stühler K, Krüssel JS, Baston-Büst DM. A Proteome Approach Reveals Differences between Fertile Women and Patients with Repeated Implantation Failure on Endometrial Level⁻Does hCG Render the Endometrium of RIF Patients? Int J Mol Sci. 2019; 20:425. https://doi.org/10.3390/ijms20020425 [PubMed]
- 5. Zhang M, Zhang T, Song C, Qu J, Gu Y, Liu S, Li H, Xiao W, Kong L, Sun Y, Lv W. Guizhi Fuling Capsule ameliorates endometrial hyperplasia through promoting p62-Keap1-NRF2-mediated ferroptosis. J Ethnopharmacol. 2021; 274:114064. https://doi.org/10.1016/j.jep.2021.114064 [PubMed]
- 6. Li Y, Zeng X, Lu D, Yin M, Shan M, Gao Y. Erastin induces ferroptosis via ferroportin-mediated iron accumulation in endometriosis. Hum Reprod. 2021; 36:951–64. https://doi.org/10.1093/humrep/deaa363 [PubMed]
- 7. Mintz J, Mirza J, Young E, Bauckman K. Iron Therapeutics in Women's Health: Past, Present, and Future. Pharmaceuticals (Basel). 2020; 13:449. https://doi.org/10.3390/ph13120449 [PubMed]
- 8. Li J, Cao F, Yin HL, Huang ZJ, Lin ZT, Mao N, Sun B, Wang G. Ferroptosis: past, present and future. Cell Death Dis. 2020; 11:88. https://doi.org/10.1038/s41419-020-2298-2 [PubMed]
- 9. Wang H, Peng S, Cai J, Bao S. Silencing of PTPN18 Induced Ferroptosis in Endometrial Cancer Cells Through p-P38-Mediated GPX4/xCT Down-Regulation. Cancer Manag Res. 2021; 13:1757–65. https://doi.org/10.2147/CMAR.S278728 [PubMed]
- 10. López-Janeiro Á, Ruz-Caracuel I, Ramón-Patino JL, De Los Ríos V, Villalba Esparza M, Berjón A, Yébenes L, Hernández A, Masetto I, Kadioglu E, Goubert V, Heredia-Soto V, Barderas R, et al. Proteomic Analysis of Low-Grade, Early-Stage Endometrial Carcinoma Reveals New Dysregulated Pathways Associated with Cell Death and Cell Signaling. Cancers (Basel). 2021; 13:794. https://doi.org/10.3390/cancers13040794 [PubMed]
- 11. Jiang P, Yang F, Zou C, Bao T, Wu M, Yang D, Bu S. The construction and analysis of a ferroptosis-related gene prognostic signature for pancreatic cancer. Aging (Albany NY). 2021; 13:10396–414. https://doi.org/10.18632/aging.202801 [PubMed]
- 12. Yuan Y, Cao W, Zhou H, Qian H, Wang H. CLTRN, Regulated by NRF1/RAN/DLD Protein Complex, Enhances Radiation Sensitivity of Hepatocellular Carcinoma Cells Through Ferroptosis Pathway. Int J Radiat Oncol Biol Phys. 2021; 110:859–71. https://doi.org/10.1016/j.ijrobp.2020.12.062 [PubMed]
- 13. Zhao L, Peng Y, He S, Li R, Wang Z, Huang J, Lei X, Li G, Ma Q. Apatinib induced ferroptosis by lipid peroxidation in gastric cancer. Gastric Cancer. 2021; 24:642–54. https://doi.org/10.1007/s10120-021-01159-8 [PubMed]
- 14. Wang C, Shi M, Ji J, Cai Q, Zhao Q, Jiang J, Liu J, Zhang H, Zhu Z, Zhang J. Stearoyl-CoA desaturase 1 (SCD1) facilitates the growth and anti-ferroptosis of gastric cancer cells and predicts poor prognosis of gastric cancer. Aging (Albany NY). 2020; 12:15374–91. https://doi.org/10.18632/aging.103598 [PubMed]
- 15. Sun J, Cheng X, Pan S, Wang L, Dou W, Liu J, Shi X. Dichloroacetate attenuates the stemness of colorectal cancer cells via trigerring ferroptosis through sequestering iron in lysosomes. Environ Toxicol. 2021; 36:520–29. https://doi.org/10.1002/tox.23057 [PubMed]
- 16. Yang C, Zhang Y, Lin S, Liu Y, Li W. Suppressing the KIF20A/NUAK1/Nrf2/GPX4 signaling pathway induces ferroptosis and enhances the sensitivity of colorectal cancer to oxaliplatin. Aging (Albany NY). 2021; 13:13515–34. https://doi.org/10.18632/aging.202774 [PubMed]
- 17. Lin CC, Yang WH, Lin YT, Tang X, Chen PH, Ding CC, Qu DC, Alvarez JV, Chi JT. DDR2 upregulation confers ferroptosis susceptibility of recurrent breast tumors through the Hippo pathway. Oncogene. 2021; 40:2018–34. https://doi.org/10.1038/s41388-021-01676-x [PubMed]
- 18. Zhang H, Ge Z, Wang Z, Gao Y, Wang Y, Qu X. Circular RNA RHOT1 promotes progression and inhibits ferroptosis via mir-106a-5p/STAT3 axis in breast cancer. Aging (Albany NY). 2021; 13:8115–26. https://doi.org/10.18632/aging.202608 [PubMed]
- 19. Li G, Yang J, Zhao G, Shen Z, Yang K, Tian L, Zhou Q, Chen Y, Huang Y. Dysregulation of ferroptosis may involve in the development of non-small-cell lung cancer in Xuanwei area. J Cell Mol Med. 2021; 25:2872–84. https://doi.org/10.1111/jcmm.16318 [PubMed]
- 20. Yang L, Tian S, Chen Y, Miao C, Zhao Y, Wang R, Zhang Q. Ferroptosis-Related Gene Model to Predict Overall Survival of Ovarian Carcinoma. J Oncol. 2021; 2021:6687391. https://doi.org/10.1155/2021/6687391 [PubMed]
- 21. Wang J, Yin X, He W, Xue W, Zhang J, Huang Y. SUV39H1 deficiency suppresses clear cell renal cell carcinoma growth by inducing ferroptosis. Acta Pharm Sin B. 2021; 11:406–19. https://doi.org/10.1016/j.apsb.2020.09.015 [PubMed]
- 22. Wu G, Wang Q, Xu Y, Li Q, Cheng L. A new survival model based on ferroptosis-related genes for prognostic prediction in clear cell renal cell carcinoma. Aging (Albany NY). 2020; 12:14933–48. https://doi.org/10.18632/aging.103553 [PubMed]
- 23. Lee J, You JH, Kim MS, Roh JL. Epigenetic reprogramming of epithelial-mesenchymal transition promotes ferroptosis of head and neck cancer. Redox Biol. 2020; 37:101697. https://doi.org/10.1016/j.redox.2020.101697 [PubMed]
- 24. Newman AM, Liu CL, Green MR, Gentles AJ, Feng W, Xu Y, Hoang CD, Diehn M, Alizadeh AA. Robust enumeration of cell subsets from tissue expression profiles. Nat Methods. 2015; 12:453–57. https://doi.org/10.1038/nmeth.3337 [PubMed]
- 25. Dou Y, Kawaler EA, Cui Zhou D, Gritsenko MA, Huang C, Blumenberg L, Karpova A, Petyuk VA, Savage SR, Satpathy S, Liu W, Wu Y, Tsai CF, et al, and Clinical Proteomic Tumor Analysis Consortium. Proteogenomic Characterization of Endometrial Carcinoma. Cell. 2020; 180:729–48.e26. https://doi.org/10.1016/j.cell.2020.01.026 [PubMed]
- 26. Kroczek RA, Mages HW, Hutloff A. Emerging paradigms of T-cell co-stimulation. Curr Opin Immunol. 2004; 16:321–27. https://doi.org/10.1016/j.coi.2004.03.002 [PubMed]
- 27. Dees S, Ganesan R, Singh S, Grewal IS. Regulatory T cell targeting in cancer: Emerging strategies in immunotherapy. Eur J Immunol. 2021; 51:280–91. https://doi.org/10.1002/eji.202048992 [PubMed]
- 28. Aran D, Lasry A, Zinger A, Biton M, Pikarsky E, Hellman A, Butte AJ, Ben-Neriah Y. Widespread parainflammation in human cancer. Genome Biol. 2016; 17:145. https://doi.org/10.1186/s13059-016-0995-z [PubMed]
- 29. Michalska A, Blaszczyk K, Wesoly J, Bluyssen HAR. A Positive Feedback Amplifier Circuit That Regulates Interferon (IFN)-Stimulated Gene Expression and Controls Type I and Type II IFN Responses. Front Immunol. 2018; 9:1135. https://doi.org/10.3389/fimmu.2018.01135 [PubMed]
- 30. Randall RE, Goodbourn S. Interferons and viruses: an interplay between induction, signalling, antiviral responses and virus countermeasures. J Gen Virol. 2008; 89:1–47. https://doi.org/10.1099/vir.0.83391-0 [PubMed]
- 31. Punt S, Fleuren GJ, Kritikou E, Lubberts E, Trimbos JB, Jordanova ES, Gorter A. Angels and demons: Th17 cells represent a beneficial response, while neutrophil IL-17 is associated with poor prognosis in squamous cervical cancer. Oncoimmunology. 2015; 4:e984539. https://doi.org/10.4161/2162402X.2014.984539 [PubMed]
- 32. Kryczek I, Banerjee M, Cheng P, Vatan L, Szeliga W, Wei S, Huang E, Finlayson E, Simeone D, Welling TH, Chang A, Coukos G, Liu R, Zou W. Phenotype, distribution, generation, and functional and clinical relevance of Th17 cells in the human tumor environments. Blood. 2009; 114:1141–49. https://doi.org/10.1182/blood-2009-03-208249 [PubMed]
- 33. Jin X, Su H, Xu L, Wang Y, Su R, Zhang Z, Guan G, Li Z. Different co-culture models reveal the pivotal role of TBBPA-promoted M2 macrophage polarization in the deterioration of endometrial cancer. J Hazard Mater. 2021; 413:125337. https://doi.org/10.1016/j.jhazmat.2021.125337 [PubMed]
- 34. Jing X, Peng J, Dou Y, Sun J, Ma C, Wang Q, Zhang L, Luo X, Kong B, Zhang Y, Wang L, Qu X. Macrophage ERα promoted invasion of endometrial cancer cell by mTOR/KIF5B-mediated epithelial to mesenchymal transition. Immunol Cell Biol. 2019; 97:563–76. https://doi.org/10.1111/imcb.12245 [PubMed]
- 35. Brigelius-Flohé R. Glutathione peroxidases and redox-regulated transcription factors. Biol Chem. 2006; 387:1329–35. https://doi.org/10.1515/BC.2006.166 [PubMed]
- 36. Adeniran SO, Zheng P, Feng R, Adegoke EO, Huang F, Ma M, Wang Z, Ifarajimi OO, Li X, Zhang G. The Antioxidant Role of Selenium via GPx1 and GPx4 in LPS-Induced Oxidative Stress in Bovine Endometrial Cells. Biol Trace Elem Res. 2021. https://doi.org/10.1007/s12011-021-02731-0 [PubMed]
- 37. Zhou H, He Y, Li L, Wu C, Hu G. Identification novel prognostic signatures for Head and Neck Squamous Cell Carcinoma based on ceRNA network construction and immune infiltration analysis. Int J Med Sci. 2021; 18:1297–311. https://doi.org/10.7150/ijms.53531 [PubMed]
- 38. Zhang Q, Hong Z, Zhu J, Zeng C, Tang Z, Wang W, Huang H. miR-4999-5p Predicts Colorectal Cancer Survival Outcome and Reprograms Glucose Metabolism by Targeting PRKAA2. Onco Targets Ther. 2020; 13:1199–210. https://doi.org/10.2147/OTT.S234666 [PubMed]
- 39. Karni-Schmidt O, Lokshin M, Prives C. The Roles of MDM2 and MDMX in Cancer. Annu Rev Pathol. 2016; 11:617–44. https://doi.org/10.1146/annurev-pathol-012414-040349 [PubMed]
- 40. Sherr CJ. Tumor surveillance via the ARF-p53 pathway. Genes Dev. 1998; 12:2984–91. https://doi.org/10.1101/gad.12.19.2984 [PubMed]
- 41. Helwa R, Gansmo LB, Bjørnslett M, Halle MK, Werner HMJ, Romundstad P, Hveem K, Vatten L, Dørum A, Lønning PE, Knappskog S. Impact of MDM2 promoter SNP55 (rs2870820) on risk of endometrial and ovarian cancer. Biomarkers. 2021; 26:302–08. https://doi.org/10.1080/1354750X.2021.1891291 [PubMed]
- 42. Zhou J, Kryczek I, Li S, Li X, Aguilar A, Wei S, Grove S, Vatan L, Yu J, Yan Y, Liao P, Lin H, Li J, et al. The ubiquitin ligase MDM2 sustains STAT5 stability to control T cell-mediated antitumor immunity. Nat Immunol. 2021; 22:460–70. https://doi.org/10.1038/s41590-021-00888-3 [PubMed]
- 43. Gunshin H, Mackenzie B, Berger UV, Gunshin Y, Romero MF, Boron WF, Nussberger S, Gollan JL, Hediger MA. Cloning and characterization of a mammalian proton-coupled metal-ion transporter. Nature. 1997; 388:482–88. https://doi.org/10.1038/41343 [PubMed]
- 44. Kikuchi Y, Tsuji E, Yagi K, Matsusaka K, Tsuji S, Kurebayashi J, Ogawa T, Aburatani H, Kaneda A. Aberrantly methylated genes in human papillary thyroid cancer and their association with BRAF/RAS mutation. Front Genet. 2013; 4:271. https://doi.org/10.3389/fgene.2013.00271 [PubMed]
- 45. Colas E, Perez C, Cabrera S, Pedrola N, Monge M, Castellvi J, Eyzaguirre F, Gregorio J, Ruiz A, Llaurado M, Rigau M, Garcia M, Ertekin T, et al. Molecular markers of endometrial carcinoma detected in uterine aspirates. Int J Cancer. 2011; 129:2435–44. https://doi.org/10.1002/ijc.25901 [PubMed]
- 46. Sakamoto H, Tsukaguchi T, Hiroshima S, Kodama T, Kobayashi T, Fukami TA, Oikawa N, Tsukuda T, Ishii N, Aoki Y. CH5424802, a selective ALK inhibitor capable of blocking the resistant gatekeeper mutant. Cancer Cell. 2011; 19:679–90. https://doi.org/10.1016/j.ccr.2011.04.004 [PubMed]
- 47. Go G, Lee SH. The Cellular Prion Protein: A Promising Therapeutic Target for Cancer. Int J Mol Sci. 2020; 21:9208. https://doi.org/10.3390/ijms21239208 [PubMed]
- 48. Tang Z, Ma J, Zhang W, Gong C, He J, Wang Y, Yu G, Yuan C, Wang X, Sun Y, Ma J, Liu F, Zhao Y. The Role of Prion Protein Expression in Predicting Gastric Cancer Prognosis. J Cancer. 2016; 7:984–90. https://doi.org/10.7150/jca.14237 [PubMed]
- 49. Le Corre D, Ghazi A, Balogoun R, Pilati C, Aparicio T, Martin-Lannerée S, Marisa L, Djouadi F, Poindessous V, Crozet C, Emile JF, Mulot C, Le Malicot K, et al. The cellular prion protein controls the mesenchymal-like molecular subtype and predicts disease outcome in colorectal cancer. EBioMedicine. 2019; 46:94–104. https://doi.org/10.1016/j.ebiom.2019.07.036 [PubMed]
- 50. Li C, Yu S, Nakamura F, Yin S, Xu J, Petrolla AA, Singh N, Tartakoff A, Abbott DW, Xin W, Sy MS. Binding of pro-prion to filamin A disrupts cytoskeleton and correlates with poor prognosis in pancreatic cancer. J Clin Invest. 2009; 119:2725–36. https://doi.org/10.1172/JCI39542 [PubMed]
- 51. Wilkinson N, Pantopoulos K. The IRP/IRE system in vivo: insights from mouse models. Front Pharmacol. 2014; 5:176. https://doi.org/10.3389/fphar.2014.00176 [PubMed]
- 52. Torti SV, Torti FM. Iron and cancer: more ore to be mined. Nat Rev Cancer. 2013; 13:342–55. https://doi.org/10.1038/nrc3495 [PubMed]
- 53. Tibshirani R. The lasso method for variable selection in the Cox model. Stat Med. 1997; 16:385–95. https://doi.org/10.1002/(sici)1097-0258(19970228)16:4<385::aid-sim380>3.0.co;2-3 [PubMed]
- 54. Goeman JJ. L1 penalized estimation in the Cox proportional hazards model. Biom J. 2010; 52:70–84. https://doi.org/10.1002/bimj.200900028 [PubMed]
- 55. Newman AM, Steen CB, Liu CL, Gentles AJ, Chaudhuri AA, Scherer F, Khodadoust MS, Esfahani MS, Luca BA, Steiner D, Diehn M, Alizadeh AA. Determining cell type abundance and expression from bulk tissues with digital cytometry. Nat Biotechnol. 2019; 37:773–82. https://doi.org/10.1038/s41587-019-0114-2 [PubMed]
- 56. Thorsson V, Gibbs DL, Brown SD, Wolf D, Bortone DS, Ou Yang TH, Porta-Pardo E, Gao GF, Plaisier CL, Eddy JA, Ziv E, Culhane AC, Paull EO, et al, and Cancer Genome Atlas Research Network. The Immune Landscape of Cancer. Immunity. 2018; 48:812–30.e14. https://doi.org/10.1016/j.immuni.2018.03.023 [PubMed]
- 57. Rooney MS, Shukla SA, Wu CJ, Getz G, Hacohen N. Molecular and genetic properties of tumors associated with local immune cytolytic activity. Cell. 2015; 160:48–61. https://doi.org/10.1016/j.cell.2014.12.033 [PubMed]
- 58. Li B, Severson E, Pignon JC, Zhao H, Li T, Novak J, Jiang P, Shen H, Aster JC, Rodig S, Signoretti S, Liu JS, Liu XS. Comprehensive analyses of tumor immunity: implications for cancer immunotherapy. Genome Biol. 2016; 17:174. https://doi.org/10.1186/s13059-016-1028-7 [PubMed]
- 59. Li T, Fan J, Wang B, Traugh N, Chen Q, Liu JS, Li B, Liu XS. TIMER: A Web Server for Comprehensive Analysis of Tumor-Infiltrating Immune Cells. Cancer Res. 2017; 77:e108–10. https://doi.org/10.1158/0008-5472.CAN-17-0307 [PubMed]