


Introduction
Prostate cancer is the second most common cancer, and the fifth leading cause of death from cancer in men worldwide [1, 2]. However, the incidence and mortality of PCa were varied significantly from different races [3, 4]. African Americans were reported to have the highest incidence worldwide, while the White and Black people are at a higher risk than Asian people for suffering from PCa [2, 5]. Moreover, the White and Black people have poorer cancer specific survival (CSS) and overall survival (OS) for PCa than Asian people [6–8]. Meanwhile, the incidence of prostate cancer has been in a rising trend amongst all races in recent years [9, 10]. However, the original mechanism for these differences among the races has still not been fully understood until recently.
It is reported that dietary patterns and geographical environment differences may be the explanation for PCa incidence differences among ethnic groups [11–13]. However, the reasons for different treatment outcomes amongst the ethnicities are still not entirely clear. There was a study that reported that racial differences in genetic variants have an impact on drug sensitivities, clinical signs of progress and treatment options for prostate cancer [14]. In addition, Bernard B. et al reported that Black, White, and Asian people have differences in their responses to chemotherapy and endocrine therapy, which lead to different survival benefits [15]. These results suggest that drug response and treatment outcomes for PCa differ between racial and ethnic groups. However, systematic comparisons of race differences in drug treatments (cytotoxic therapy, endocrine therapy, molecular targeting therapy, and so on) have not been reported yet, and the mechanisms of the treatment response differentiations amongst ethnicities are still not well understood.
What drives racial differences in drug sensitivity and treatment outcomes of PCa patients, and are there any genetic differences amongst races that lead to the differences in drug metabolic capacity? In recent years, sequencing technology has provided new methods that allow researchers to easily review hundreds of tumor profiles and discover the genetic alterations responsible for drug metabolism. In our study, we aimed to investigate the drug metabolism differences in the White, Black and Asian ethnicities, using a comprehensive signature involving transcriptomics, epigenome and SNPs, so as to systematically compare the significant differences in drug metabolism-related pathways, drug sensitivities among ethnicities, and to account for the racial differences in treatment outcomes. Finding drug metabolism-related core genes in multi-omics and predicting treatment outcomes for PCa, these findings may provide effective and novel evidence for the personalized treatment of PCa.
Results
Multi-omics genetic signatures differences in White, Black and Asian PCa patients
Firstly, we compared the differences of transcriptomics, epigenome and SNPs among White, Black and Asian people. From a total of 19676 official mRNA gene symbols, 470 differentially expressed genes (DEGs) (including 253 up-regulated genes and 217 down-regulated genes) were identified when comparing White people to Asian people, 396 DEGs were identified (including 204 up-regulated genes and 192 down-regulated genes) when comparing Black people to Asian people, 483 DEGs were identified (including 307 up-regulated genes and 176 down-regulated genes) when comparing White people to Black people, respectively (Figure 1A). From a total of 1881 official miRNA gene symbols, 51 DEGs were identified (including 14 up-regulated genes and 37 down-regulated genes) when comparing White people to Asian people, 50 DEGs were identified (including 10 up-regulated genes and 40 down-regulated genes) when comparing Black people to Asian people, 45 DEGs were identified (including 25 up-regulated genes and 20 down-regulated genes) when comparing White people to Black people, respectively (Figure 1B). From a total of 14447 official lncRNA gene symbols, 600 DEGs were identified (including 340 up-regulated genes and 260 down-regulated genes) when comparing White people to Asian people, 618 DEGs were identified (including 354 up-regulated genes and 264 down-regulated genes) when comparing Black people to Asian people, 648 DEGs were identified (including 317 up-regulated genes and 331 down-regulated genes) when comparing White people to Black people, respectively (Figure 1C). From a total of 29004 official methylation gene symbols, 3567 differential methylation genes were identified (including 3437 up-regulated genes and 130 down-regulated genes) when comparing White people to Asian people, 2285 differential methylation genes were identified (including 2174 up-regulated genes and 111 down-regulated genes) when comparing Black people to Asian people, 3659 differential methylation genes were identified (including 1916 up-regulated genes and 1743 down-regulated genes) when comparing White people to Black people, respectively (Figure 1D). From a total of 11202 official SNP gene symbols, 10697 mutations were noted in White people, 1679 mutations in Black people, 320 mutations in Asian people- of which White people had more prominent mutations of TP53, ATM; Black people had more prominent mutations in ATM, TP53, CDK12 than Asian people; White people had more prominent mutations in TP53 than Black people (Figure 1E and Supplementary Figure 1). Surprisingly, we found that the mutations of TP53, ATM, CDK12 showed significant resistance to chemotherapy of pan-cancer cell lines in the GDSC database. For example, TP53 mutation showed significant resistance to paclitaxel, 5-Fluorouracil, doxorubicin and gemcitabine. The details are summarized in Supplementary Tables 1, 2.
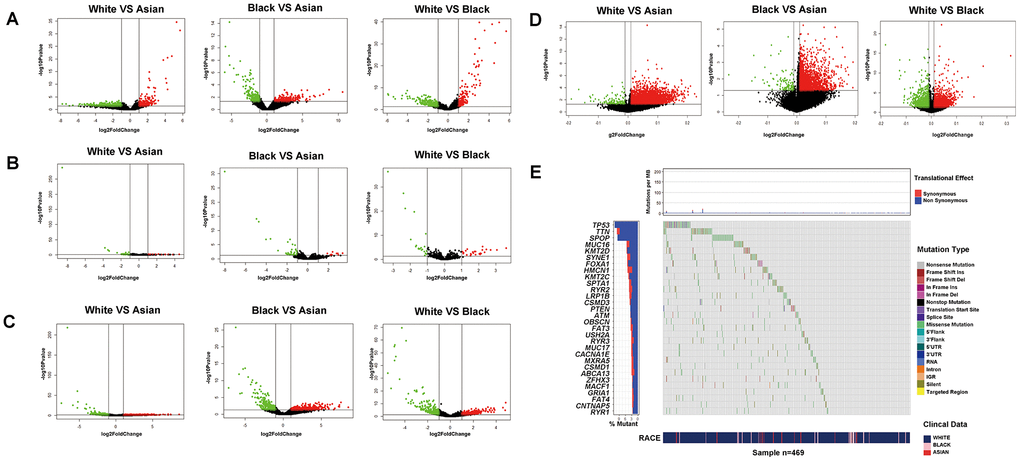
Figure 1. Transcriptomics, epigenome and SNPs difference analysis for PCa of different RACES. mRNA expression (A) miRNA expression (B) lncRNA expression (C) DNA methylation level (D) differential analysis for White people and Asian people, Black people and Asian people, White people and Black people, respectively. (E) SNPs status differential analysis (such as mutation rate, mutation type.ect) for White, Black and Asian people in TCGA patients.
Drug metabolism differences in White, Black and Asian PCa patients
Enrichment analysis was carried out according to the differential genes in transcriptomics, epigenome and SNPs, to identify the differences in metabolism pathway for White, Black and Asian PCa patients. We found significant differences in drug metabolism, cytotoxic therapy, endocrine therapy, molecular targeting treatment, biological response modifiers and radiotherapy amongst the ethnicities. More precisely, Black people were more prominently enriched in DMP (hsa00982: drug metabolism - cytochrome P450, hsa00980: metabolism of xenobiotics by cytochrome P450, hsa00983:drug metabolism), GSEA: pretumor drug resistance, GSEA: docetaxel resistance, GSEA: doxorubicin resistance, GSEA: gemcitabine resistance, GSEA: gefitinib resistance, GSEA: endocrine therapy resistance, GSEA: response to androgens, GSEA: serum and rapamycin sensitive genes in mRNA level, GSEA: endocrine therapy resistance in lncRNA level, DMP, hsa01524:platinum drug resistance, GSEA: pretumor drug resistance in methylation level when compared with Asian people; White people were more prominently enriched in DMP, hsa00983: drug metabolism - other enzymes, GO:0017144 drug metabolic process, GSEA: doxorubicin resistance, GSEA: gemcitabine resistance, GSEA: gefitinib resistance, GSEA: endocrine therapy resistance in mRNA level, hsa01524:platinum resistance, GO:0010332 response to gamma radiation in miRNA level, GSEA: endocrine therapy resistance in lncRNA level, hsa00980: metabolism of xenobiotics by cytochrome P450, hsa01524: platinum drug resistance, GSEA: endocrine therapy resistance, GSEA: response to androgens pathways in methylation level when compared with Asian people; White people were more prominently enriched in DMP, hsa00983: drug metabolism - other enzymes, GO:0017144 drug metabolic process, GO:0042738 exogenous drug catabolic process, GSEA: doxorubicin resistance, GSEA: endocrine therapy resistance, GSEA: response to androgen, GSEA: rapamycin sensitive via tsc1 and tsc2 in mRNA level, GO:0009314 response to radiation pathway in miRNA level, GO:0017144 drug metabolic process, hsa01524:platinum resistance, GO:0009314 response to radiation in methylation level when compared with Black people. (Figure 2, and Supplementary Figure 4, Supplementary Tables 3–6).
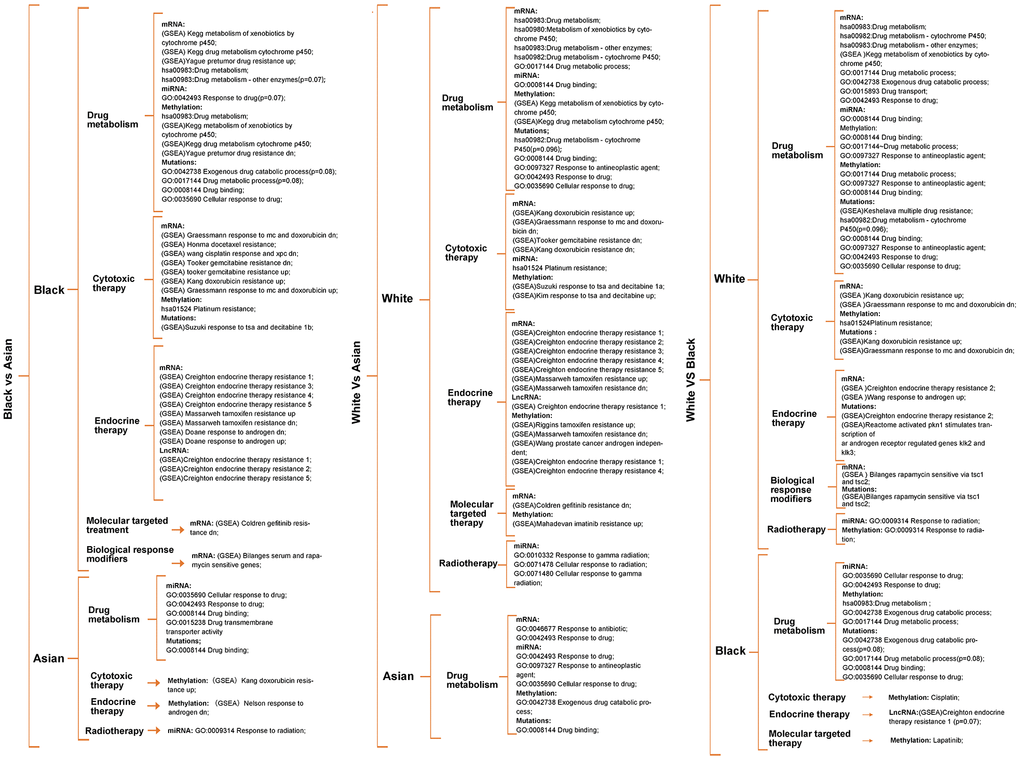
Figure 2. Metabolism pathway difference analysis according to multi-omics for races, of which drug metabolism, cytotoxic therapy, endocrine therapy, radiotherapy, molecular targeted therapy, biological response modifiers therapy differences were the main focus. Unless otherwise specified, all the significance P value < 0.05.
It was worth noting that Black people were also prominently enriched in hsa00983: drug metabolism, GO:0042738 exogenous drug catabolic process in methylation level when compared with White people (Figure 2), that is because parts of methylation level have an uncertain relationship with gene expression. Therefore, we screened methylation drivers genes for each race for further enrichment analysis (Supplementary Figure 2 and Supplementary Table 8), and the results verified that the Black people were more prominently enriched in hsa00982 drug metabolism, GO:0017144 drug metabolic process, GO:0009314 response to radiation when compared with the Asian people; White people were more prominently enriched in hsa00982 drug metabolism, GO:0017144 drug metabolic process, GO:0009314 response to radiation when compared with Asian people; White people were more prominently enriched in molecular targeting treatment when compared with Black people (Supplementary Figure 3 and Supplementary Table 6); Further enrichment analysis of mutated genes of the different races showed that SNPs might relate to hsa00982:drug metabolism - cytochrome P450 (p=0.096), GSEA: multiple drug resistance, GO:0097327 response to antineoplastic agent, GSEA: doxorubicin resistance, GSEA: endocrine therapy resistance, GSEA: response to androgen pathways in White people, GO:0042738 exogenous drug catabolic process(p=0.08), GO:0017144 drug metabolic process(p=0.08), GSEA: response to tsa and decitabine 1b pathways in Black people, GO:0008144 drug binding pathway in Asian people, respectively (Figure 2 and Supplementary Table 7). Unless otherwise specified, all significant P value was < 0.05.
Key functional modules with ethnic differences were identified for each omics
We summarized the important functional modules, including drug metabolism, cytotoxic therapy, endocrine therapy, molecular targeting treatment, biological response modifiers, radiotherapy, and related genes set amongst the different races (Supplementary Table 9). We found that the differences of these important functional modules amongst the different ethnicities were caused by the combination of transcriptomics, epigenome and SNPs. Furthermore, we found that each omics had its own prominent functional module. We defined these prominent functional module as the key functional module for each omics, more precisely, drug metabolism, platinum resistance and antineoplastic agent response, endocrine therapy resistance, molecular targeted therapy, and response to radiation were identified as the key functional modules for mRNA, miRNA, lncRNA, DNA methylation, respectively. It is worth noting that DNA methylation and SNPs also significantly occurred in drug metabolism modules (Table 1 and Supplementary Table 9). What’s more, we preliminarily identified the core genes or target genes in multi-omics key functional modules, and the DNA methylation and SNP genes, which occurred in the drug metabolism functional modules, were also included as the preliminary core genes. After screening, we affirmed 9 core mRNA which were related to drug metabolism, 8 core miRNA which were related to platinum resistance and antineoplastic agent response, 16 core lncRNA which were related to endocrine therapy resistance, 1 core methylation for molecular targeted therapy and 1 core methylation for response to radiation. In addition, 3 methylation and 3 SNPs in the drug metabolism functional module were also included in the core genes of DNA methylation and SNPs. (Table1 and Supplementary Figure 5A–5C). In addition, multi-omics key functional modules core genes showed significant differences amongst White, Black and Asian people, as both single gene or total, the details of which are shown in Table 1 and Figure 3.
Table 1. Comparison of the multi-omics key functional modules and related core genes among RACES.
| Functional modules | Omics | Genes | Comparison | Expression significant | Functional significant |
| Drug metabolism | mRNA | UGT2B17 | Asian VS Black | Black | Black |
| mRNA | UGT1A8 | Asian VS Black | Black | Black | |
| mRNA | UGT2B7 | Asian VS Black | Black | Black | |
| mRNA | UGT1A1 | Black VS White | White | White | |
| mRNA | CYP3A4 | Black VS White | White | White | |
| mRNA | UGT1A10 | Black VS White | White | White | |
| mRNA | UGT1A8 | Black VS White | White | White | |
| mRNA | CYP2B6 | Black VS White | White | White | |
| mRNA | UGT2B11 | Black VS White | White | White | |
| mRNA | UGT1A1 | Asian VS White | White | White | |
| mRNA | UGT2B17 | Asian VS White | White | White | |
| mRNA | UGT1A8 | Asian VS White | White | White | |
| mRNA | CYP1A1 | Asian VS White | White | White | |
| mRNA | UGT2B11 | Asian VS White | White | White | |
| Methylation | CYP2B6 | White VS Asian | White | White | |
| Methylation | CYP3A4 | White VS Asian | White | White | |
| Methylation | CYP2B6 | White VS Black | White | White | |
| Methylation | UGT1A1 | White VS Black | White | White | |
| Mutations | UGT2B7 | —— | White | White | |
| Mutations | CYP2B6 | —— | Black | Black | |
| Mutations | CYP1A1 | —— | Black | Black | |
| Platinum drug resistance | miRNA | hsa-miR-1911-3p | Asian VS White | Asian | White |
| miRNA | hsa-miR-612 | Asian VS White | Asian | White | |
| miRNA | hsa-miR-1237-3p | Asian VS White | Asian | White | |
| miRNA | hsa-miR-5698 | Asian VS White | Asian | White | |
| miRNA | hsa-miR-483-3p | Asian VS White | Asian | White | |
| miRNA | hsa-miR-6783-3p | Asian VS White | Asian | White | |
| Response to antineoplastic agent | miRNA | hsa-miR-3130-3p | Asian VS White | White | Asian |
| miRNA | hsa-miR-519a-3p | Asian VS White | White | Asian | |
| Endocrine therapy resistance | lncRNA | LINC00052 | Black VS Asian | Black | Black |
| lncRNA | LINC01087 | Black VS Asian | Black | Black | |
| lncRNA | JPX | Black VS Asian | Black | Black | |
| lncRNA | CCDC18-AS1 | Black VS Asian | Black | Black | |
| lncRNA | PVT1 | Black VS Asian | Black | Black | |
| lncRNA | SIAH2-AS1 | Black VS Asian | Black | Black | |
| lncRNA | SNHG7 | Black VS Asian | Black | Black | |
| lncRNA | LINC00992 | Black VS Asian | Black | Black | |
| lncRNA | SNHG6 | Black VS Asian | Black | Black | |
| lncRNA | GATA3-AS1 | Black VS Asian | Black | Black | |
| lncRNA | SP2-AS1 | Black VS Asian | Black | Black | |
| lncRNA | GAS5 | Black VS Asian | Black | Black | |
| lncRNA | ELOVL2-AS1 | Black VS Asian | Black | Black | |
| lncRNA | XIST | Black VS Asian | Black | Black | |
| lncRNA | AGAP2-AS1 | Black VS Asian | Black | Black | |
| lncRNA | LINC01087 | White VS Asian | White | White | |
| lncRNA | JPX | White VS Asian | White | White | |
| lncRNA | PVT1 | White VS Asian | White | White | |
| lncRNA | SIAH2-AS1 | White VS Asian | White | White | |
| lncRNA | CCDC18-AS1 | White VS Asian | White | White | |
| lncRNA | SNHG7 | White VS Asian | White | White | |
| lncRNA | SNHG6 | White VS Asian | White | White | |
| lncRNA | LINC00992 | White VS Asian | White | White | |
| lncRNA | GAS5 | White VS Asian | White | White | |
| lncRNA | XIST | White VS Asian | White | White | |
| lncRNA | SP2-AS1 | White VS Asian | White | White | |
| lncRNA | GATA3-AS1 | White VS Asian | White | White | |
| lncRNA | AGAP2-AS1 | White VS Asian | White | White | |
| lncRNA | ELOVL2-AS1 | White VS Black | White | White | |
| lncRNA | LINC00052 | White VS Black | White | White | |
| lncRNA | AC103760.1 | White VS Black | White | White | |
| lncRNA | XIST | White VS Black | White | White | |
| Molecular targeted therapy | Methylation | ORM1 | White VS Asian | Asian | White |
| Methylation | ORM1 | Black VS Asian | Asian | Black | |
| Response to radiation | Methylation | MIR155HG | White VS Asian | Asian | White |
| Methylation | MIR155HG | Black VS Asian | Asian | Black |
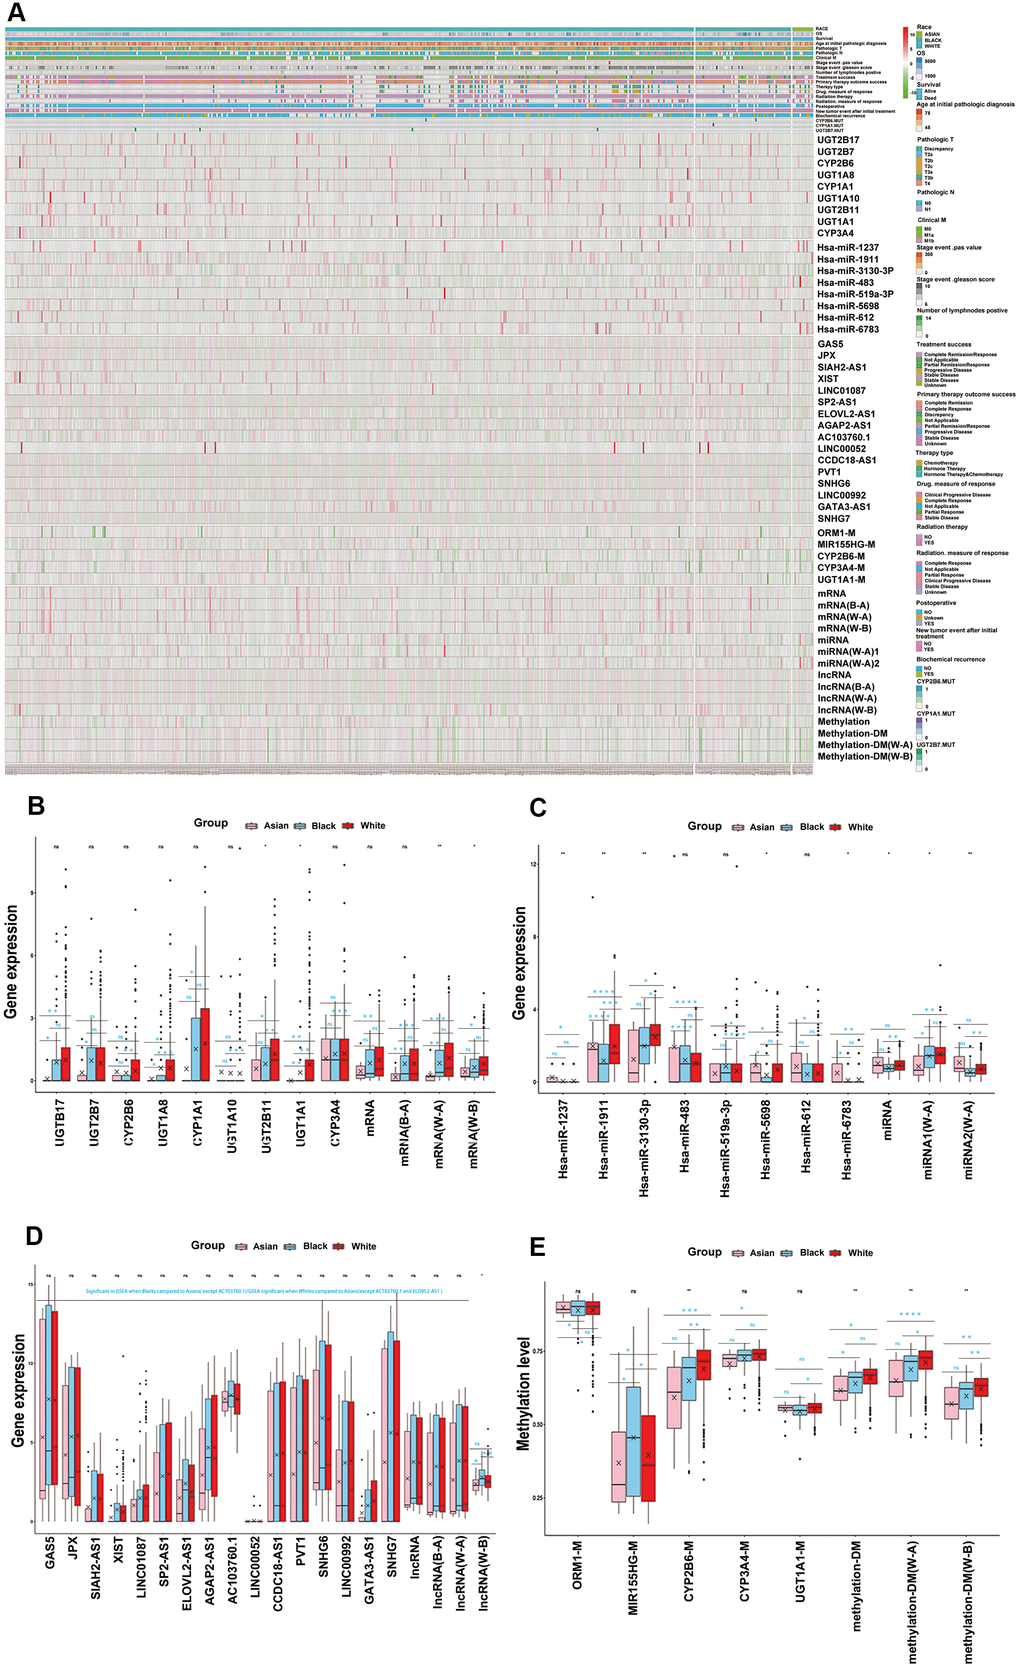
Figure 3. Key functional modules with ethnic differences were identified for each omics. (A) Multi-omics key functional modules core genes differences analysis for races, as both single gene or total, which were shown in hot map. (B) The core genes of mRNA key functional module (drug metabolism) differences analysis for RACES as both single gene or total. (C) The core genes of miRNA key functional module (platinum resistance and antineoplastic agent response) differences analysis for RACES as both single gene or total. (D) The core genes of lncRNA key functional module (endocrine therapy resistance) differences analysis for RACES as both single gene or total. (E) The core genes of methylation key functional modules (drug metabolism, molecular targeted therapy and response to radiation) differences analysis for RACES as both single gene or total. (Notes: mRNA, miRNA, lncRNA, methylation expressed as the mean value of the core genes of each key functional module, methylation-DM expressed as the mean value of drug mentalism-related methylations, miRNA 1 expressed as the mean value of antineoplastic agent response related core miRNAs, miRNA 2 expressed as the mean value of platinum resistance related core miRNAs, B-A, W-A, W-B expressed as the mean value of core genes of each key functional modules which significant in Black people VS Asian people, White people VS Asian people, White people VS Black people, respectively).
Drug resistance differences amongst races might originate from drug metabolism
Firstly, correlation analysis was adopted for multi-omics key functional modules that indicated that the endocrine therapy resistance functional module had a strong positive correlation with the drug metabolism module in this work. Meanwhile, the cytotoxic resistance genes (HMGB1, docetaxel resistance: SKP2, AXL, KDM5D, MDH2, PIM1, SPHK1, LDHA, SOX2, Hsa-mir-143, Hsa-mir-193a, Hsa-mir-195a, Hsa-mir-204, Hsa-mir-216b, Hsa-mir-323a, Hsa-323b, Hsa-mir-34a, Hsa-mir-375, platinum resistance: Hsa-mir-205, HOTAIR, NEAT1), endocrine therapy resistance genes (AR, FHL2, VAV3, LDHA, AKR1C3, KIF4A, KDM4B) reported in the literature also showed strong positive correlations with the drug metabolism functional module. Furthermore, the platinum resistance functional module showed positive correlations with cytotoxic treatment resistance genes reported in the literature, endocrine therapy resistance functional module showed positive correlations with endocrine therapy resistance genes reported in the literature (Figure 4A). These evidences suggested that the cytotoxic treatment resistance and endocrine therapy resistance showed good correlations to drug metabolism in PCa. Next, multi-omics key functional modules core genes or targets in this work, and cytotoxic resistance genes (HMGB1, docetaxel resistance: SKP2, AXL, MDH2, PIM1, SPHK1, LDHA, SOX2), endocrine therapy resistance genes (AR, FHL2, VAV3, LDHA, AKR1C3, KIF4A, KDM4B) reported in literature were taken for regulatory network analysis, which demonstrated that drug metabolism module, cytotoxic treatment resistance module, and endocrine therapy resistance module were well regulated with each other (Figure 4B, and Supplementary Figure 5F, Supplementary Table 10). Therefore, we have reason to think that the differences in cytotoxic treatment resistance, endocrine therapy resistance amongst the different races might have originated from drug metabolism (Figure 4A, 4B and Supplementary Figure 5D–5F). Regulatory network analysis identified that mRNA (UGT2B17, UGT1A8, UGT2B7, UGT1A1, CYP3A4, UGT1A10, CYP2B6, UGT2B11, CYP1A1), miRNA (hsa-miR-1237-3p, hsa-miR-1911-3p, hsa-miR-3130-3p, hsa-miR-612), lncRNA (XIST, CCDC18-AS1, GAS5, JPX, SNHG6, LINC00992), SNPs (UGT2B7, CYP2B6, CYP1A1), methylation (UGT1A1, CYP3A4, CYP2B6) were well regulated to each other, and to cytotoxic resistance genes or endocrine therapy resistance genes reported in literature, and these genes were deemed as drug metabolism-related core genes in further studies (Supplementary Table 11). We also found that drug metabolism-related core genes showed differences in transcriptomics, epigenome and SNPs, as both single gene or total, amongst the different races, which lead to drug metabolism, and drug resistance differences amongst the White, Black and Asian patients. (Figure 4C, 4D and Table 1).
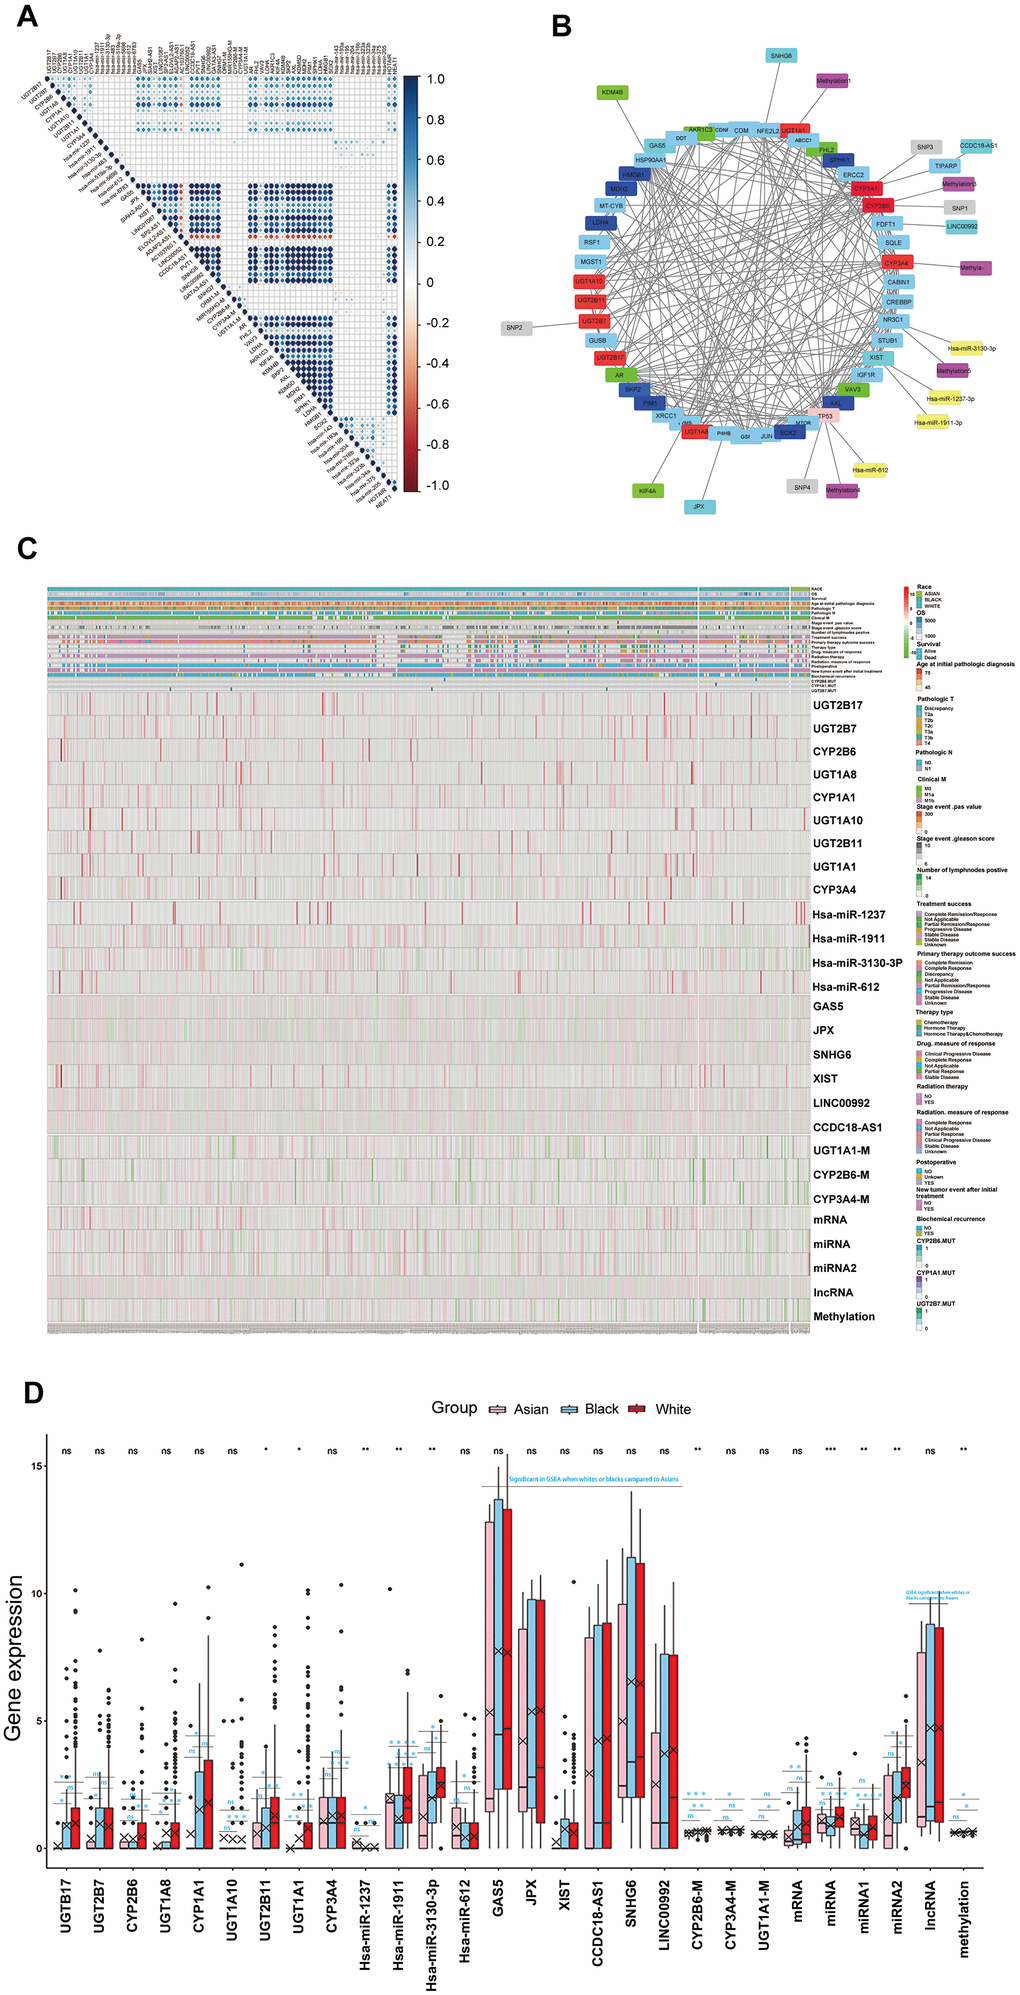
Figure 4. (A) The correlations of the core genes of each key functional modules to each other and the correlations of the core genes of each key functional modules to cytotoxic resistance genes (HMGB1, docetaxel resistance: SKP2, AXL, KDM5D, MDH2, PIM1, SPHK1, LDHA, SOX2, Hsa-mir-143, Hsa-mir-193a, Hsa-mir-195a, Hsa-mir-204, Hsa-mir-216b, Hsa-mir-323a, Hsa-323b, Hsa-mir-34a, Hsa-mir-375, platinum resistance: Hsa-mir-205, HOTAIR, NEAT1), endocrine therapy resistance genes (AR, FHL2, VAV3, LDHA, AKR1C3, KIF4A, KDM4B) reported the in literature. (B) The core genes or targets of each key functional modules in this work and cytotoxic resistance genes (HMGB1, docetaxel resistance: SKP2, AXL, MDH2, PIM1, SPHK1, LDHA, SOX2), endocrine therapy resistance genes (AR, FHL2, VAV3, LDHA, AKR1C3, KIF4A, KDM4B) reported in the literature, were taken for regulatory network analysis, the genes which regulated well from each other in network were identified as drug metabolism-related core genes for further study. (C, D) Drug metabolism-related core genes differences analysis for RACES as both single gene or total, which were shown in the hot map and box plots. (Notes: mRNA, miRNA, lncRNA, methylation expressed as the mean value of the core genes of each key functional modules in network, miRNA 1 expressed as the mean value of antineoplastic agent response related core miRNAs in network, miRNA 2 expressed as the mean value of platinum resistance related core miRNAs in network).
Drug metabolism-related core genes predict drug response and treatment outcomes for PCa patients
Later, we combined CYP1A1, CYP2B6, CYP3A4, UGT1A8, UGT2B11, UGT2B17, UGT2B7, GAS5, XIST, SNHG6, which showed good correlations to chemotherapy or endocrine therapy resistance, to predict drug response and treatment outcomes in 69 PCa patients who have previously received chemotherapy or endocrine therapy. The result of ROC prediction model showed that these genes have a good predictive power of primary treatment outcome success (AUC =0.808, P<0.001, SD=0.059), treatment success (AUC =0.776, P=0.001, SD=0.067), drug response(AUC =0.896, P=0.001, SD=0.066), stage event PSA value (AUC =0.842, P=0.003, SD=0.061), biochemical recurrence (AUC =0.702, P=0.022, SD=0.075), new tumor event after initial treatment (AUC =0.662, P=0.025, SD=0.068), for TCGA PCa patients, after receiving chemotherapy or hormone therapy (Figure 5). These models demonstrate that these genes were potential biomarkers for predicting the drug response and treatment outcomes of prostate cancer. These genes also showed significant racial differences- specifically, CYP1A1, CYP3A4, UGT1A8, UGT2B11, UGT2B17, GAS5, XIST, SNHG6 were more significant in White people in comparison to Asian people, UGT1A8, UGT2B17, UGT2B7, GAS5, XIST, SNHG6 were more significant in Black people in comparison to Asian people, and CYP2B6, UGT1A8, UGT2B11, CYP3A4 were more significant in White people in comparison to Black people (Supplementary Figure 6).
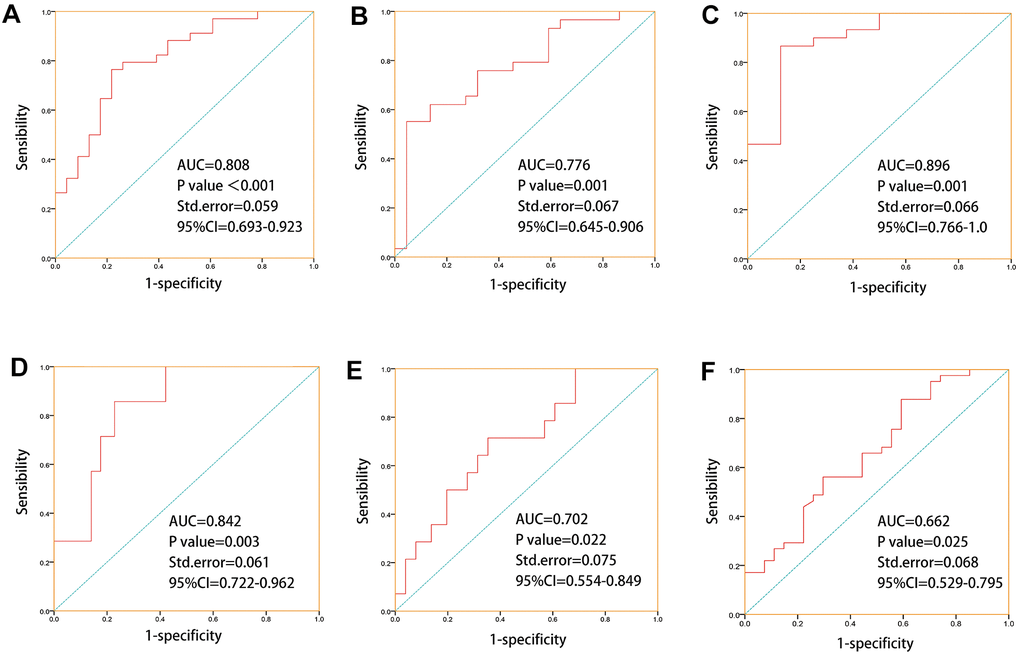
Figure 5. ROC prediction models were established for “primary therapy outcome success, treatment success, drug response, stage event. PSA value, biochemical recurrence, new tumor event after initial treatment” based on drug metabolism-related core genes which with good correlations to chemotherapy or endocrine therapy drugs sensitivities. (A) ROC prediction model for primary treatment outcome success (AUC=0.808, P=0, SD=0.059). (B) ROC prediction model for treatment success (AUC =0.776, P=0.001, SD=0.067). (C) ROC prediction model for drug response (AUC =0.896, P=0.001, SD=0.066). (D) ROC prediction model for stage event. PSA value (AUC =0.842, P=0.003, SD=0.061). (E) ROC prediction model for biochemical recurrence (AUC =0.702, P=0.022, SD=0.075). (F) ROC prediction model for new tumor event after initial treatment(AUC =0.662, P=0.025, SD=0.068).
Discussion
Several studies have shown racial differences in the genetic background of prostate cancer patients. For example, Brandon A Mahal. et al have revealed racial differences in the mutational profiles of 2393 prostate cancer patients, which including 2109 White, 204 Black, and 80 Asian [16], Timothy R Rebbeck. et al have also proposed that individuals of European/Asian ancestry have different risk alleles than individuals of African ancestry in PCa patients [17]. In our study, we provide a more complete and novel finding of racial differences in prostate cancer among White, Black, and Asian men, especially for drug treatment and drug metabolism, based on transcriptome, epigenome and SNPs, and these results may increase the contributions to this field.
Recently, NATURE published the latest results based on whole-genome, whole-transcriptome and DNA methylation data, revealing the genomic changes in Chinese patients were markedly different from those in Western patients (41% FOXA1 mutation in PCa as the most prominent signature in the Chinese population), and emphasized the importance of individualized treatment based on ethnic genetic background [18]. Meanwhile, Mahal BA. et al reported that FOXA1 has the highest mutation frequency in the Asian population when compared with Blacks and Whites in both primary and metastatic prostate cancer patients [16]. These findings further supported our results. We know that FOXA1 has been reported to help shape AR signaling and drives growth and survival of prostate cancer cells [19], Which may be a potential explanation for the differences in prognosis among White, Black, and Asian PCa patients. What’s more, it was reported that ATM, PTEN in metastatic prostate cancer had a higher mutation frequency in Blacks and Whites than in Asians, and TP53, CDK12 in primary prostate cancer had a higher mutation frequency in Whites and Asians than in Blacks [16]. Most of these results are in line with ours, we also found different mutations in ATM, TP53 and CDK12 among White, Black, and Asian PCa populations. It’s reported that TP53, PTEN, ATM and CDK12 were more mutated in metastatic castration-resistant prostate cancer (mCRPC) [20]. And we found that TP53, ATM and CDK12 mutations showed significant resistance to chemotherapy of pan-cancer cell lines. Therefore, the differences in gene mutations may be related to drug sensitivity and prognosis among different ethnic groups.
Several studies have shown that overall survival (OS) of the Black populations is shorter than the White populations in PCa, but the Black OS was almost equal with the White OS after the docetaxel treatment [21], which might be due to the racial differences in drug sensitivities. There were studies that claimed that the differences in survival rates between Black and White people might due to selection bias or a possible biological difference between PCa. In addition, there may be ethnic differences in pharmacological and pharmacokinetic criteria that may affect the performance of therapeutic drugs such as docetaxel. In addition, many genes, including KDM5D, have been shown to modulate docetaxel sensitivity in prostate cancer [22–23]. In our study, many new genes were also found to modulate docetaxel sensitivity, such as CYP1A1, CYP3A4, GAS5, SHN6, etc, and race differences in the expression modulation of these genes may be a potential explanation for these observations. What’s more, we found that these genes contribute well to drug metabolic pathways and differ significantly among ethnic groups, and ethnic differences in resistance to cytotoxic therapy and endocrine therapy might result from the differences in drug metabolism.
Recent research claimed that treatments of prostate cancer reflect unexpected ethnic disparities [24]. Moses et al. showed that African American (AA) men were less likely than Whites to receive treatment for radical prostatectomy, external beam radiation therapy, or brachytherapy [25]. This preference may influence prognosis or outcome for each race. Moreover, a few studies have compared the response effects of chemotherapy or endocrine therapy for prostate cancer of different races, but no consistent and systematic conclusions have been drawn [15]. To this end, we systematically compared the differences of White, Black and Asian people in chemotherapy, endocrine therapy, radiotherapy and molecular targeted therapy. et al, and further found that the differences in drug resistance might originate from drug metabolism among different races.
In order to provide an effective target for the personalized treatment of prostate cancer, we identified drug metabolism-related core genes which related to drug metabolism, drug sensitivities, and related treatment outcomes in multi-omics, such as CYP1A1, CYP2B6, CYP3A4, UGT1A8, UGT2B11, UGT2B17, UGT2B7, GAS5, XIST, SNHG6. et al. Several studies have shown that GAS5, SNH6, UGT1A10, UGT2B17 were well related to clinical prognosis, CYP3A4 related to paclitaxel resistance and therapeutic effects of abiraterone and enzalutamide in PCa [26–32]. Which supported our results, and these findings based on the multi-omics genetic structure of races could better guide the individualized treatment for PCa.
In conclusion, transcriptomics, epigenome and SNPs were significant differences in Whites, Blacks and Asians of PCa, which directly lead to the differences in drug metabolism, drug resistance pathways. What’s more, drug metabolism promoted drug resistance differences among races, which lead to the differences in drug responses and treatment outcomes of PCa. Therefore, these findings can help us to understand the mechanisms of the difference in drug metabolism among prostate cancer patients in different races and help us in making individualized treatment strategies.
Materials and Methods
Data sources
In our study, 485 PCa samples including 415 White people(85.6%), 58 Black people (12.0%) and 12 Asian people (2.5%) were acquired from the TCGA data portal (https://tcga-data.nci.nih.gov/tcga/), of which transcriptomics, epigenome, SNPs data and corresponding clinical information were included. After being matched with clinical data, 479 samples with mRNA count (including 411 White, 56 Black and 12 Asian people), 477 samples with microRNA count (including 407 White, 58 Black and 12 Asian people), 476 samples with lncRNA count (including 408 White, 56 Black and 12 Asian people), 469 samples with SNPs (including 402 White, 55 Black and 12 Asian people), 483 samples with DNA methylation FPKM (including 414 White, 57 Black and 12 Asian people) were contained. In these patients, 69 samples (14.2%) have received hormone therapy or chemotherapy (Figure 4A). Meanwhile, transcriptomics, epigenome, SNPs, half-maximal inhibitory concentration (IC50), and half-maximal effect concentration (EC50) of 24 antineoplastic compounds for 22RV1, DU145 and PC3 were downloads from the CCLE database (https://portals.broadinstitute.org/ccle/data). Transcriptomics, epigenome, SNPs and the area under the dose response curve (AUCs) of 24 antineoplastic compounds for pan-cancer cell lines were acquired from the CTRP database (http://portals.broadinstitute.org/ctrp/?page=#ctd2BodyHome). Transcriptome, the half-maximal inhibitory concentration (IC50), and the area under the dose-response curve (AUCs) of 22 antineoplastic compounds for pan-cancer cell lines were acquired from the GDSC database (https://www.cancerrxgene.org/gdsc1000/GDSC1000_WebResources//Home.html). Authorization was not requested from a local ethics committee, as all data were available on an open-access platform.
Multi-omics difference analysis
Differentially expressed genes of mRNAs, microRNAs, and lncRNAs were identified by the edge R package and differentially expressed DNA methylation genes were identified by the limma package for all races. The setting cutoffs for upregulated and downregulated genes were included in the fold change feature |logFC| > 1 for mRNAs, microRNA and lncRNAs, and |logFC| > 0.01 for DNA methylation, with a significant P value of < 0.05.
Identification of DNA methylation driven genes
The R package MethylMix was applied to identify methylation-driven genes, which are defined as differential DNA methylation genes that negatively correlation to gene expression.
Target gene prediction analysis
Target genes were predicted for miRNA and lncRNA, the targets of miRNA were identified by Mirwalk (http://mirwalk.umm.uni-heidelberg.de/), and the targets of lncRNA were identified by Encori (http://starbase.sysu.edu.cn/index.php).
Enrichment analysis
Enrichment analysis was used to investigate differential functions or signaling pathways for the different races, which was completed by GSEA, DAVID and webgestalt together to increase the credibility of the results. mRNA, lncRNA, DNA methylation, and SNPs were enriched by GSEA (http://www.broadinstitute.org/gsea). mRNA, miRNA target genes, DNA methylation and SNPs were enriched by DAVID (https://david.ncifcrf.gov/summary.jsp) and webgestalt (http://www.webgestalt.org/).
Multi-omics key functional modules and core genes identify
We identified the most significant pathways in each omics as the key functional modules. The results showed that drug metabolism, platinum resistance and antineoplastic agent response, endocrine therapy resistance, molecular targeted therapy, and response to radiation were the most key functional modules for mRNA, miRNA, lncRNA, and DNA methylation respectively. Next, the STRING database (https://string-db.org) was used to identify the core genes or targets of mRNA and miRNA functional modules. The core genes of lncRNA functional module were identified according to GSEA gene set. Additionally, we also included the methylation and SNPs that occurred in drug metabolism functional module as the core genes for DNA methylation and SNPs.
Statistical analysis
Transcriptomics, epigenome data were standardized by log2(x+1) before analysis. Hot map, box plots, volcano map, nomogram and waterfall map and correlation analysis were plotted by R version 3.5.1. Receiver operating characteristic curve(ROC) and all statistical analyses were performed by SPSS 19.0 software (SPSS. Inc., Chicago, IL, USA). In this study, all significant P value was < 0.05.
Data availability statement
The datasets generated and analyzed during the current study are available in the TCGA, https://portal.gdc.cancer.gov/, CCLE, https://portals.broadinstitute.org/ccle/data, CTRP, http://portals.broadinstitute.org/ctrp/?page=#ctd2BodyHome, and GDSC https://www.cancerrxgene.org/gdsc1000/GDSC1000_WebResources//Home.html.
Supplementary Materials
Author Contributions
Ming-Kun Chen and Shan-Chao Zhao designed this study and revised the manuscript. Yang Liu wrote the manuscript. Jian-Kun Yang, De-Ying Liao, Zhi-Jian Liang, Xiao Xie, Qi-Zhao Zhou, Kang-Yi Xue, Wen-Bing Guo, Ming Xia, Jun-Hao Zhou, Ji-Ming Bao, Cheng Yang, Hai-Feng Duan, Hong-Yi Wang, Zhi-Peng Huang collected the data. Yang Liu, Jia-Wei Zhou and Cun-dong Liu analyzed and interpreted the data. All the listed authors have participated actively in the study. All authors read and approved the final manuscript.
Acknowledgments
We are grateful to the TCGA database, CCLE database, GDSC database and CTRP database for their data supports. We are grateful to CAI Lin for her modification of our manuscript.
Conflicts of Interest
The authors declare that they have no conflicts of interest.
Funding
This study was supported by the National Natural Science Foundation of China (NSFC 81602248 to Ming-Kun Chen) and the Natural Science Foundation of Guangdong Province (No. 2017A030313686 to Ming-Kun Chen).
References
- 1. Ferlay J, Soerjomataram I, Dikshit R, Eser S, Mathers C, Rebelo M, Parkin DM, Forman D, Bray F. Cancer incidence and mortality worldwide: sources, methods and major patterns in GLOBOCAN 2012. Int J Cancer. 2015; 136:E359–86. https://doi.org/10.1002/ijc.29210 [PubMed]
- 2. Bray F, Ferlay J, Soerjomataram I, Siegel RL, Torre LA, Jemal A. Global cancer statistics 2018: GLOBOCAN estimates of incidence and mortality worldwide for 36 cancers in 185 countries. CA Cancer J Clin. 2018; 68:394–424. https://doi.org/10.3322/caac.21492 [PubMed]
- 3. Rebbeck TR. Prostate Cancer Disparities by Race and Ethnicity: From Nucleotide to Neighborhood. Cold Spring Harb Perspect Med. 2018; 8:a030387. https://doi.org/10.1101/cshperspect.a030387 [PubMed]
- 4. Siegel RL, Miller KD, Jemal A. Cancer statistics, 2018. CA Cancer J Clin. 2018; 68:7–30. https://doi.org/10.3322/caac.21442 [PubMed]
- 5. Greiman AK, Rosoff JS, Prasad SM. Association of Human Development Index with global bladder, kidney, prostate and testis cancer incidence and mortality. BJU Int. 2017; 120:799–807. https://doi.org/10.1111/bju.13875 [PubMed]
- 6. Zhang C, Zhang C, Wang Q, Li Z, Lin J, Wang H. Differences in Stage of Cancer at Diagnosis, Treatment, and Survival by Race and Ethnicity Among Leading Cancer Types. JAMA Netw Open. 2020; 3:e202950. https://doi.org/10.1001/jamanetworkopen.2020.2950 [PubMed]
- 7. DeSantis CE, Miller KD, Goding Sauer A, Jemal A, Siegel RL. Cancer statistics for African Americans, 2019. CA Cancer J Clin. 2019; 69:211–33. https://doi.org/10.3322/caac.21555 [PubMed]
- 8. Cronin KA, Lake AJ, Scott S, Sherman RL, Noone AM, Howlader N, Henley SJ, Anderson RN, Firth AU, Ma J, Kohler BA, Jemal A. Annual Report to the Nation on the Status of Cancer, part I: National cancer statistics. Cancer. 2018; 124:2785–800. https://doi.org/10.1002/cncr.31551 [PubMed]
- 9. Zhou CK, Check DP, Lortet-Tieulent J, Laversanne M, Jemal A, Ferlay J, Bray F, Cook MB, Devesa SS. Prostate cancer incidence in 43 populations worldwide: An analysis of time trends overall and by age group. Int J Cancer. 2016; 138:1388–400. https://doi.org/10.1002/ijc.29894 [PubMed]
- 10. Dall’Era MA, deVere-White R, Rodriguez D, Cress R. Changing Incidence of Metastatic Prostate Cancer by Race and Age, 1988-2015. Eur Urol Focus. 2019; 5:1014–21. https://doi.org/10.1016/j.euf.2018.04.016 [PubMed]
- 11. Iyengar S, Hall IJ, Sabatino SA. Racial/Ethnic Disparities in Prostate Cancer Incidence, Distant Stage Diagnosis, and Mortality by U.S. Census Region and Age Group, 2012-2015. Cancer Epidemiol Biomarkers Prev. 2020; 29:1357–64. https://doi.org/10.1158/1055-9965.EPI-19-1344 [PubMed]
- 12. Park SY, Haiman CA, Cheng I, Park SL, Wilkens LR, Kolonel LN, Le Marchand L, Henderson BE. Racial/ethnic differences in lifestyle-related factors and prostate cancer risk: the Multiethnic Cohort Study. Cancer Causes Control. 2015; 26:1507–15. https://doi.org/10.1007/s10552-015-0644-y [PubMed]
- 13. Layne TM, Graubard BI, Ma X, Mayne ST, Albanes D. Prostate cancer risk factors in black and white men in the NIH-AARP Diet and Health Study. Prostate Cancer Prostatic Dis. 2019; 22:91–100. https://doi.org/10.1038/s41391-018-0070-9 [PubMed]
- 14. Ateeq B, Bhatia V, Goel S. Molecular Discriminators of Racial Disparities in Prostate Cancer. Trends Cancer. 2016; 2:116–20. https://doi.org/10.1016/j.trecan.2016.01.005 [PubMed]
- 15. Bernard B, Muralidhar V, Chen YH, Sridhar SS, Mitchell EP, Pettaway CA, Carducci MA, Nguyen PL, Sweeney CJ. Impact of ethnicity on the outcome of men with metastatic, hormone-sensitive prostate cancer. Cancer. 2017; 123:1536–44. https://doi.org/10.1002/cncr.30503 [PubMed]
- 16. Mahal BA, Alshalalfa M, Kensler KH, Chowdhury-Paulino I, Kantoff P, Mucci LA, Schaeffer EM, Spratt D, Yamoah K, Nguyen PL, Rebbeck TR. Racial Differences in Genomic Profiling of Prostate Cancer. N Engl J Med. 2020; 383:1083–85. https://doi.org/10.1056/NEJMc2000069 [PubMed]
- 17. Rebbeck TR. Prostate Cancer Genetics: Variation by Race, Ethnicity, and Geography. Semin Radiat Oncol. 2017; 27:3–10. https://doi.org/10.1016/j.semradonc.2016.08.002 [PubMed]
- 18. Li J, Xu C, Lee HJ, Ren S, Zi X, Zhang Z, Wang H, Yu Y, Yang C, Gao X, Hou J, Wang L, Yang B, et al. A genomic and epigenomic atlas of prostate cancer in Asian populations. Nature. 2020; 580:93–99. https://doi.org/10.1038/s41586-020-2135-x [PubMed]
- 19. Teng M, Zhou S, Cai C, Lupien M, He HH. Pioneer of prostate cancer: past, present and the future of FOXA1. Protein Cell. 2021; 12:29–38. https://doi.org/10.1007/s13238-020-00786-8 [PubMed]
- 20. Abida W, Armenia J, Gopalan A, Brennan R, Walsh M, Barron D, Danila D, Rathkopf D, Morris M, Slovin S, McLaughlin B, Curtis K, Hyman DM, et al. Prospective Genomic Profiling of Prostate Cancer Across Disease States Reveals Germline and Somatic Alterations That May Affect Clinical Decision Making. JCO Precis Oncol. 2017; 1:1–16. https://doi.org/10.1200/PO.17.00029 [PubMed]
- 21. Halabi S, Dutta S, Tangen CM, Rosenthal M, Petrylak DP, Thompson IM
Jr , Chi KN, Araujo JC, Logothetis C, Quinn DI, Fizazi K, Morris MJ, Eisenberger MA, et al. Overall Survival of Black and White Men With Metastatic Castration-Resistant Prostate Cancer Treated With Docetaxel. J Clin Oncol. 2019; 37:403–10. https://doi.org/10.1200/JCO.18.01279 [PubMed] - 22. Komura K, Jeong SH, Hinohara K, Qu F, Wang X, Hiraki M, Azuma H, Lee GS, Kantoff PW, Sweeney CJ. Resistance to docetaxel in prostate cancer is associated with androgen receptor activation and loss of KDM5D expression. Proc Natl Acad Sci USA. 2016; 113:6259–64. https://doi.org/10.1073/pnas.1600420113 [PubMed]
- 23. de Morrée ES, Böttcher R, van Soest RJ, Aghai A, de Ridder CM, Gibson AA, Mathijssen RH, Burger H, Wiemer EA, Sparreboom A, de Wit R, van Weerden WM. Loss of SLCO1B3 drives taxane resistance in prostate cancer. Br J Cancer. 2016; 115:674–81. https://doi.org/10.1038/bjc.2016.251 [PubMed]
- 24. Spratt DE, Osborne JR. Disparities in castration-resistant prostate cancer trials. J Clin Oncol. 2015; 33:1101–03. https://doi.org/10.1200/JCO.2014.58.1751 [PubMed]
- 25. Moses KA, Orom H, Brasel A, Gaddy J, Underwood W 3rd. Racial/Ethnic Disparity in Treatment for Prostate Cancer: Does Cancer Severity Matter? Urology. 2017; 99:76–83. https://doi.org/10.1016/j.urology.2016.07.045 [PubMed]
- 26. Deng ZH, Yu GS, Pan B, Feng ZH, Huang Q, Deng JZ, Chen B, Yang SK. Rs145204276 and rs4759314 affect the prognosis of prostate cancer by modulating the GAS5/miR-1284/HMGB1 and HOTAIR/miR-22/HMGB1 signalling pathways. Artif Cells Nanomed Biotechnol. 2020; 48:435–42. https://doi.org/10.1080/21691401.2019.1709859 [PubMed]
- 27. Yan Y, Chen Z, Xiao Y, Wang X, Qian K. Long non-coding RNA SNHG6 is upregulated in prostate cancer and predicts poor prognosis. Mol Biol Rep. 2019; 46:2771–78. https://doi.org/10.1007/s11033-019-04723-9 [PubMed]
- 28. Lévesque E, Labriet A, Hovington H, Allain ÉP, Melo-Garcia L, Rouleau M, Brisson H, Turcotte V, Caron P, Villeneuve L, Leclercq M, Droit A, Audet-Walsh E, et al. Alternative promoters control UGT2B17-dependent androgen catabolism in prostate cancer and its influence on progression. Br J Cancer. 2020; 122:1068–76. https://doi.org/10.1038/s41416-020-0749-2 [PubMed]
- 29. Laverdière I, Flageole C, Audet-Walsh É, Caron P, Fradet Y, Lacombe L, Lévesque É, Guillemette C. The UGT1 locus is a determinant of prostate cancer recurrence after prostatectomy. Endocr Relat Cancer. 2015; 22:77–85. https://doi.org/10.1530/ERC-14-0423 [PubMed]
- 30. Weiss J, Kocher J, Mueller C, Rosenzweig S, Theile D. Impact of enzalutamide and its main metabolite N-desmethyl enzalutamide on pharmacokinetically important drug metabolizing enzymes and drug transporters. Biopharm Drug Dispos. 2017; 38:517–25. https://doi.org/10.1002/bdd.2103 [PubMed]
- 31. Qin S, Liu D, Kohli M, Wang L, Vedell PT, Hillman DW, Niu N, Yu J, Weinshilboum RM, Wang L. TSPYL Family Regulates CYP17A1 and CYP3A4 Expression: Potential Mechanism Contributing to Abiraterone Response in Metastatic Castration-Resistant Prostate Cancer. Clin Pharmacol Ther. 2018; 104:201–10. https://doi.org/10.1002/cpt.907 [PubMed]
- 32. van Eijk M, Boosman RJ, Schinkel AH, Huitema AD, Beijnen JH. Cytochrome P450 3A4, 3A5, and 2C8 expression in breast, prostate, lung, endometrial, and ovarian tumors: relevance for resistance to taxanes. Cancer Chemother Pharmacol. 2019; 84:487–99. https://doi.org/10.1007/s00280-019-03905-3 [PubMed]