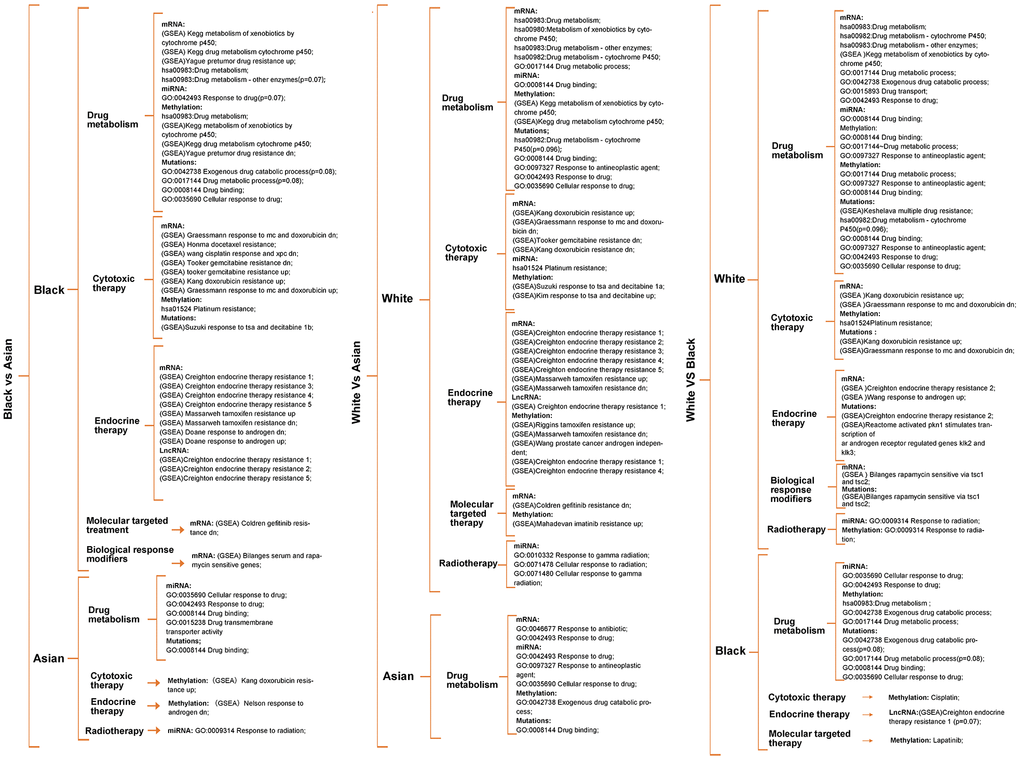
Figure 2.Metabolism pathway difference analysis according to multi-omics for races, of which drug metabolism, cytotoxic therapy, endocrine therapy, radiotherapy, molecular targeted therapy, biological response modifiers therapy differences were the main focus. Unless otherwise specified, all the significance P value < 0.05.