


Introduction
Lung cancer is the leading cause of cancer-related deaths, and its incidence is rapidly increasing [1, 2]. Non-small cell lung cancer (NSCLC) accounts for more than 75% of all lung cancers [3]. Radiation therapy is used to treat malignant tumors, including locally advanced lung cancer [4]. However, the long-term prognosis of lung cancer remains poor, with a 5-year survival rate of 5%-25% as most lung tumors are diagnosed at an advanced stage [5]. Many prognostic biomarkers have been explored in NSCLC, including tumor volume, stage, differentiation, and invasion [6]. With the development of novel treatment technologies and personalized treatment technologies, it is imperative to identify robust prognostic biomarkers at the cellular and molecular levels. Numerous gene polymorphisms are associated with cancer risk and prognosis [7–10]. Therefore, genetic markers may help guide clinical decision-making and improve NSCLC prognosis.
Hypoxia-inducible factor 1 (HIF-1) is a heterodimer composed of a 120-kD subunit (HIF-1α) and a 91-94-kD subunit (HIF-1β). HIF-1 expression and activity are tightly regulated by cellular oxygen levels, and HIF-1 is the master regulator of hypoxia-induced gene expression. HIF-1 plays a key role in tumor angiogenesis, cancer cell growth, proliferation, apoptosis, energy metabolism, and tumor metastasis. Recently, several HIF1 single nucleotide polymorphisms (SNPs) have been shown to increase lung cancer risk. For example, Pura et al. reported that the frequency of the HIF1A C1772T variant was higher in lung cancer patients with p53 mutations and 1p/19q loss of heterozygosity [11]. Additionally, HIF-1α 1772 C/T (P582S) and 1790 G/A (A588T) polymorphisms are associated with NSCLC risk [12]. A recent meta-analysis showed that HIF-1α rs11549465 and rs11549467 polymorphisms increased the lung cancer risk in Asian populations [13]. Mounting evidence suggests that the C2028T polymorphism in HIF1 exon 12 and the dinucleotide repeat polymorphism in intron 13 influence HIF-1 expression in lung cancer; thus, functional HIF1 polymorphisms may significantly affect lung cancer development by causing genomic instability. In a small cohort study, the 1772T>C polymorphism has been demonstrated to influence lung cancer prognosis and chemotherapy response [14]. The study also indicated that the expression levels of HIF-1α were associated with lymph node metastasis in breast cancer [15] and with disease-free survival and overall survival (OS) in rectal cancer [16]. In this study, we aimed to identify the HIF1A SNPs associated with the survival of patients with advanced NSCLC undergoing radiation therapy.
Results
Patient characteristics
The study cohort consisted of 512 NSCLC patients receiving radiation therapy. Complete clinical characteristics and follow-up data were obtained for all patients. The median follow-up time was 25.02 months (range, 4.05-102.39 months). A total of 284 (55.5%) patients died, and the disease progressed in 192 patients for a median of 17.3 months. The mean patient age was 57.8 ± 8.6 years. The cohort consisted of 279 (54.5%) men and 233 (45.5%) women, with 188 patients being overweight (BMI ≥24). Smokers and drinkers represented 57.2% (n=293) and 48.8% (n=250) of the cohort, respectively, and 263 patients had a Karnofsky performance status (KPS) of <80. Squamous cell carcinoma (SCC) was diagnosed in 192 patients, and adenocarcinoma (ADC) or other types were diagnosed in 320 patients. Among all patients, 44.3% (n=227) and 55.7% (n=285) had stage IIIA and stage IIIB tumors, respectively. Chemotherapy was combined with radiotherapy for 207 (40.4%) patients. For radiotherapy, 263 (51.4%) patients underwent IMRT, and 249 (48.6%) received 3D-CRT.
The association between clinical characteristics and prognosis
The association between clinical characteristics and NSCLC patient survival (OS and PFS) are shown in Table 1. We found that age was not associated with PFS (P=0.643) or OS (P=0.660). Although gender was not associated with PFS, men had slightly worse OS compared to women (HR=1.27, 95% CI: 1.00-1.60, P=0.048). Smoking was associated with PFS and OS. Notably, smokers had worse PFS (HR=2.48, 95% CI: 1.79-3.42, P<0.001) and OS (HR=1.55, 95% CI: 1.21-1.98, P<0.001) than non-smokers. The TNM (Tumor Node Metastasis) stage was also associated with NSCLC prognosis. Patients with stage IIIB disease had a shorter duration of PFS (HR=2.17, 95% CI:1.59-2.95, P<0.001) and OS (HR=1.72, 95% CI:1.35-2.21, P<0.001) than patients with stage IIIA disease. Furthermore, patients receiving a radiation dose of <70 Gy had a poorer PFS (HR=1.74, 95% CI:1.31-2.32, P<0.001) and OS (HR=1.31, 95% CI:1.04-1.66, P=0.022) than patients receiving a dose of ≥70 Gy. Drinking (P=0.595 for PFS, P=0.992 for OS), KPS (P=0.873 for PFS, P=0.249 for OS), histological type (P=0.5780 for PFS, P=0.227 for OS), and chemotherapy (P=0.132 for PFS, P=0.074 for OS) did not affect patient survival.
Table 1. Association between clinical characteristics and progression-free survival and overall survival in patients with NSCLC.
| Parameters | Category | Progression-free survival | Overall survival | ||||||||||||||||||||||||||||||||||||||||||||||||||||||||||||||||||||||||||||||||||||||||||||||||
| MST | Event/Total | HR (95%CI) | Pa | MST | Event/Total | HR (95%CI) | Pa | ||||||||||||||||||||||||||||||||||||||||||||||||||||||||||||||||||||||||||||||||||||||||||||
| Age | <60 | 58.5 | 70/193 | 1.00 | 46.3 | 105/193 | 1.00 | ||||||||||||||||||||||||||||||||||||||||||||||||||||||||||||||||||||||||||||||||||||||||||||
| ≥60 | 53.3 | 122/319 | 1.07(0.80-1.44) | 0.643 | 48.2 | 179/319 | 1.06(0.83-1.34) | 0.660 | |||||||||||||||||||||||||||||||||||||||||||||||||||||||||||||||||||||||||||||||||||||||||||
| Sex | Female | 56.2 | 90/233 | 1.00 | 49.9 | 122/233 | 1.00 | ||||||||||||||||||||||||||||||||||||||||||||||||||||||||||||||||||||||||||||||||||||||||||||
| Male | 54.2 | 102/279 | 1.01(0.76-1.34) | 0.957 | 44.7 | 162/319 | 1.27(1.00-1.60) | 0.048 | |||||||||||||||||||||||||||||||||||||||||||||||||||||||||||||||||||||||||||||||||||||||||||
| Body mass index | <24 | 54.4 | 127/324 | 1.00 | 45.2 | 181/324 | 1.00 | ||||||||||||||||||||||||||||||||||||||||||||||||||||||||||||||||||||||||||||||||||||||||||||
| ≥24 | 54.6 | 65/188 | 0.85(0.63-1.15) | 0.289 | 49.7 | 103/188 | 0.93(0.73-1.19) | 0.930 | |||||||||||||||||||||||||||||||||||||||||||||||||||||||||||||||||||||||||||||||||||||||||||
| Smoking | No | 70.0 | 49/219 | 1.00 | 56.3 | 95/219 | 1.00 | ||||||||||||||||||||||||||||||||||||||||||||||||||||||||||||||||||||||||||||||||||||||||||||
| Yes | 43.7 | 143/293 | 2.48(1.79-3.42) | <0.001 | 40.9 | 189/293 | 1.55(1.21-1.98) | 0.001 | |||||||||||||||||||||||||||||||||||||||||||||||||||||||||||||||||||||||||||||||||||||||||||
| Drinking | No | 55.6 | 95/262 | 1.00 | 47.7 | 143/262 | 1.00 | ||||||||||||||||||||||||||||||||||||||||||||||||||||||||||||||||||||||||||||||||||||||||||||
| Yes | 54.9 | 97/250 | 1.08(0.81-1.43) | 0.595 | 46.3 | 141/250 | 0.99(0.79-1.25) | 0.992 | |||||||||||||||||||||||||||||||||||||||||||||||||||||||||||||||||||||||||||||||||||||||||||
| KPS | ≥80 | 55.8 | 95/249 | 1.00 | 47.9 | 130/249 | 1.00 | ||||||||||||||||||||||||||||||||||||||||||||||||||||||||||||||||||||||||||||||||||||||||||||
| <80 | 54.6 | 97/263 | 1.02(0.77-1.36) | 0.873 | 46.2 | 154/263 | 1.15(0.91-1.45) | 0.249 | |||||||||||||||||||||||||||||||||||||||||||||||||||||||||||||||||||||||||||||||||||||||||||
| Histology | SCC | 54.8 | 73/192 | 1.00 | 44.1 | 114/192 | 1.00 | ||||||||||||||||||||||||||||||||||||||||||||||||||||||||||||||||||||||||||||||||||||||||||||
| ADC and other | 55.0 | 119/320 | 0.96(0.72-1.28) | 0.780 | 47.8 | 170/320 | 0.86(0.68-1.10) | 0.227 | |||||||||||||||||||||||||||||||||||||||||||||||||||||||||||||||||||||||||||||||||||||||||||
| TNM stage | IIIA | 64.1 | 58/227 | 1.00 | 58.7 | 93/227 | 1.00 | ||||||||||||||||||||||||||||||||||||||||||||||||||||||||||||||||||||||||||||||||||||||||||||
| IIIB | 48.3 | 134/285 | 2.17(1.59-2.95) | <0.001 | 39.9 | 191/285 | 1.72(1.35-2.21) | <0.001 | |||||||||||||||||||||||||||||||||||||||||||||||||||||||||||||||||||||||||||||||||||||||||||
| Chemotherapy | No | 57.8 | 108/305 | 1.00 | 48.0 | 161/305 | 1.00 | ||||||||||||||||||||||||||||||||||||||||||||||||||||||||||||||||||||||||||||||||||||||||||||
| Yes | 48.6 | 84/207 | 1.25(0.94-1.66) | 0.132 | 44.9 | 123/207 | 1.24(0.98-1.57) | 0.074 | |||||||||||||||||||||||||||||||||||||||||||||||||||||||||||||||||||||||||||||||||||||||||||
| Radiation technique | IMRT | 53.0 | 99/263 | 1.00 | 47.9 | 145/263 | 1.00 | ||||||||||||||||||||||||||||||||||||||||||||||||||||||||||||||||||||||||||||||||||||||||||||
| CRT and other | 55.1 | 93/249 | 0.96(0.73-1.28) | 0.799 | 46.2 | 139/249 | 0.95(0.75-1.19) | 0.634 | |||||||||||||||||||||||||||||||||||||||||||||||||||||||||||||||||||||||||||||||||||||||||||
| Dose | ≥70Gy | 63.2 | 80/269 | 1.00 | 49.6 | 134/269 | 1.00 | ||||||||||||||||||||||||||||||||||||||||||||||||||||||||||||||||||||||||||||||||||||||||||||
| <70Gy | 44.3 | 112/243 | 1.74(1.31-2.32) | <0.001 | 44.1 | 150/243 | 1.31(1.04-1.66) | 0.022 | |||||||||||||||||||||||||||||||||||||||||||||||||||||||||||||||||||||||||||||||||||||||||||
| Pa: P value for univariate cox regression; MST: mean survival time; KPS: Karnofsky Performance Status; SCC, squamous cell carcinoma; ADC, adenocarcinoma; IMRT, Intensity Modulated Radiation Therapy; CRT, three-dimensional conformal radiotherapy. | |||||||||||||||||||||||||||||||||||||||||||||||||||||||||||||||||||||||||||||||||||||||||||||||||||
The association between HIF1A gene polymorphisms and survival of NSCLC patients receiving radiation therapy
The association between HIF1A gene polymorphisms and NSCLC patient survival (PFS and OS) were assessed using Kaplan-Meier analysis and multivariate Cox regression analysis (Table 2). Of the four SNPs (rs11549465, rs11549467, rs2057482, and rs10873142), two (rs11549467 and rs10873142) were not associated with patient survival. Interestingly, rs11549465 was associated with NSCLC prognosis. Patients with CT (median survival time [MST]: 56.2 months) and TT (MST: 27.4 months) genotypes had a shorter duration of PFS (P<0.001, Figure 1A) and OS (MST: 47.7 for CC, 52.1 for CT, 29.3 for TT, P<0.001) compared to patients with CC genotypes (MST: 60.8, Figure 1B). After adjusting for potential confounding factors, multivariate cox regression indicated that TT genotype was associated with poorer PFS (HR=2.07, 95% CI: 1.42-3.01, P<0.001) and OS (HR=1.63, 95% CI: 1.18-2.24, P=0.003). Patients with CT or TT polymorphisms had shorter median PFS compared to those with CC polymorphisms (47.7 vs. 60.8, P=0.003, Figure 1C). The median OS was similar between patients with CT+TT and CC polymorphisms (44.8 vs. 47.7, P=0.077, Figure 1D). Patients with CT+TT alleles had a lower PFS (HR=1.39, 95% CI: 1.03-1.86, P=0.029) than those with a CC genotype, although the OS was similar between the 2 groups (HR=1.16, 95% CI: 0.91-1.47, P=0.239). Patients with the TT genotype had a poorer PFS (MST: 27.4 vs. 59.7, P<0.001, Figure 1E) and OS (MST: 29.3 vs. 51.4, P<0.001, Figure 1F) compared to those with the CC+CT genotype. The TT genotype was associated with an increased risk of adverse outcomes (PFS: HR=2.01, 95% CI: 1.14-2.85, P<0.001; OS: HR=1.66, 95% CI: 1.22-2.24, P=0.001). For rs11549467, there were no significant differences in PFS (GG vs. GA vs. AA: 52.7 vs. 58.4 vs. 51.7, P=0.111, Figure 2A) or OS (GG vs. GA vs. AA: 45.0 vs. 44.6 vs. 55.4, P=0.633, Figure 2B) compared with the other three genotypes. Moreover, we found no differences in PFS (P=0.076, Figure 2C) or OS (P=0.478, Figure 2D) between the GA+AA and GG groups. Multivariate Cox regression analyses confirmed similar results for AA vs. GG+GA (PFS: P=0.728, Figure 2E; OS: P=0.385, Figure 2F).
Table 2. Associations of HIF1-alpha gene with PFS and OS in patients with NSCLC.
| SNP | Progression-free survival | Overall survival | |||||||||||||||||||||||||||||||||||||||||||||||||||||||||||||||||||||||||||||||||||||||||||||||||
| Event/No. | MST | Pa* | Adjusted HR (95%CI) | Pb* | Event/No. | MST | Pa* | Adjusted HR (95%CI) | Pb* | ||||||||||||||||||||||||||||||||||||||||||||||||||||||||||||||||||||||||||||||||||||||||||
| rs11549465 | |||||||||||||||||||||||||||||||||||||||||||||||||||||||||||||||||||||||||||||||||||||||||||||||||||
| CC | 96/298 | 60.8 | 1.00 | 151/298 | 47.7 | 1.00 | |||||||||||||||||||||||||||||||||||||||||||||||||||||||||||||||||||||||||||||||||||||||||||||
| CT | 52/146 | 56.2 | 1.09(0.77-1.54) | 0.621 | 76/146 | 52.1 | 0.95(0.72-1.26) | 0.726 | |||||||||||||||||||||||||||||||||||||||||||||||||||||||||||||||||||||||||||||||||||||||||||
| TT | 44/68 | 27.4 | <0.001 | 2.07(1.42-3.01) | <0.001 | 57/68 | 29.3 | <0.001 | 1.63(1.18-2.24) | 0.003 | |||||||||||||||||||||||||||||||||||||||||||||||||||||||||||||||||||||||||||||||||||||||||
| Trend# | |||||||||||||||||||||||||||||||||||||||||||||||||||||||||||||||||||||||||||||||||||||||||||||||||||
| CC | 96/298 | 60.8 | 1.00 | 151/298 | 47.7 | 1.00 | |||||||||||||||||||||||||||||||||||||||||||||||||||||||||||||||||||||||||||||||||||||||||||||
| CT+TT | 96/214 | 47.7 | 0.003 | 1.39(1.03-1.86) | 0.029 | 133/214 | 44.8 | 0.077 | 1.16(0.91-1.47) | 0.239 | |||||||||||||||||||||||||||||||||||||||||||||||||||||||||||||||||||||||||||||||||||||||||
| CC+CT | 148/444 | 59.7 | 1.00 | 227/444 | 51.4 | 1.00 | |||||||||||||||||||||||||||||||||||||||||||||||||||||||||||||||||||||||||||||||||||||||||||||
| TT | 44/68 | 27.4 | <0.001 | 2.01(1.41-2.85) | <0.001 | 57/68 | 29.3 | <0.001 | 1.66(1.22-2.24) | 0.001 | |||||||||||||||||||||||||||||||||||||||||||||||||||||||||||||||||||||||||||||||||||||||||
| rs11549467 | |||||||||||||||||||||||||||||||||||||||||||||||||||||||||||||||||||||||||||||||||||||||||||||||||||
| GG | 124/311 | 52.7 | 1.00 | 171/311 | 45.0 | 1.00 | |||||||||||||||||||||||||||||||||||||||||||||||||||||||||||||||||||||||||||||||||||||||||||||
| GA | 48/152 | 58.4 | 0.76(0.54-1.06) | 0.110 | 89/152 | 44.6 | 1.02(0.79-1.33) | 0.856 | |||||||||||||||||||||||||||||||||||||||||||||||||||||||||||||||||||||||||||||||||||||||||||
| AA | 20/49 | 51.7 | 0.111 | 1.15(0.71-1.87) | 0.565 | 24/49 | 55.4 | 0.633 | 0.92(0.59-)1.42 | 0.697 | |||||||||||||||||||||||||||||||||||||||||||||||||||||||||||||||||||||||||||||||||||||||||
| Trend# | |||||||||||||||||||||||||||||||||||||||||||||||||||||||||||||||||||||||||||||||||||||||||||||||||||
| GG | 124/311 | 52.7 | 1.00 | 171/311 | 45.0 | 1.00 | |||||||||||||||||||||||||||||||||||||||||||||||||||||||||||||||||||||||||||||||||||||||||||||
| GA+AA | 68/201 | 56.6 | 0.076 | 0.84(0.62-1.14) | 0.264 | 113/201 | 49.8 | 0.478 | 1.00(0.78-1.28) | 0.999 | |||||||||||||||||||||||||||||||||||||||||||||||||||||||||||||||||||||||||||||||||||||||||
| GG+GA | 172/463 | 55.8 | 1.00 | 260/463 | 45.3 | 1.00 | |||||||||||||||||||||||||||||||||||||||||||||||||||||||||||||||||||||||||||||||||||||||||||||
| AA | 20/49 | 51.7 | 0.728 | 1.26(0.78-2.02) | 0.340 | 24/49 | 55.4 | 0.385 | 0.91(0.59-1.39) | 0.909 | |||||||||||||||||||||||||||||||||||||||||||||||||||||||||||||||||||||||||||||||||||||||||
| rs2057482 | |||||||||||||||||||||||||||||||||||||||||||||||||||||||||||||||||||||||||||||||||||||||||||||||||||
| CC | 100/314 | 61.3 | 1.00 | 161/314 | 48.4 | 1.00 | |||||||||||||||||||||||||||||||||||||||||||||||||||||||||||||||||||||||||||||||||||||||||||||
| CT | 68/161 | 48.9 | 1.32(0.97-1.81) | 0.078 | 90/161 | 49.3 | 1.03(0.79-1.33) | 0.855 | |||||||||||||||||||||||||||||||||||||||||||||||||||||||||||||||||||||||||||||||||||||||||||
| TT | 24/37 | 19.8 | <0.001 | 2.05(1.30-3.23) | 0.002 | 33/37 | 28.5 | 0.002 | 1.71(1.16-2.51) | 0.007 | |||||||||||||||||||||||||||||||||||||||||||||||||||||||||||||||||||||||||||||||||||||||||
| Trend# | |||||||||||||||||||||||||||||||||||||||||||||||||||||||||||||||||||||||||||||||||||||||||||||||||||
| CC | 100/314 | 61.3 | 1.000 | 161/314 | 48.4 | 1.00 | |||||||||||||||||||||||||||||||||||||||||||||||||||||||||||||||||||||||||||||||||||||||||||||
| CT+TT | 92/198 | 44.7 | 0.005 | 1.46(1.09-1.94) | 0.010 | 123/198 | 44.2 | 0.254 | 1.14(0.90-1.45) | 0.270 | |||||||||||||||||||||||||||||||||||||||||||||||||||||||||||||||||||||||||||||||||||||||||
| CC+CT | 168/475 | 58.0 | 1.00 | 251/475 | 50.4 | 1.00 | |||||||||||||||||||||||||||||||||||||||||||||||||||||||||||||||||||||||||||||||||||||||||||||
| TT | 24/37 | 19.8 | <0.001 | 1.84(1.19-2.86) | 0.007 | 33/37 | 28.5 | <0.001 | 1.69(1.16-2.46) | 0.006 | |||||||||||||||||||||||||||||||||||||||||||||||||||||||||||||||||||||||||||||||||||||||||
| rs10873142 | |||||||||||||||||||||||||||||||||||||||||||||||||||||||||||||||||||||||||||||||||||||||||||||||||||
| TT | 119/288 | 52.0 | 1.00 | 177/288 | 44.6 | 1.00 | |||||||||||||||||||||||||||||||||||||||||||||||||||||||||||||||||||||||||||||||||||||||||||||
| TC | 61/172 | 57.5 | 0.80(0.59-1.10) | 0.167 | 83/172 | 49.5 | 0.82(0.63-1.06) | 0.130 | |||||||||||||||||||||||||||||||||||||||||||||||||||||||||||||||||||||||||||||||||||||||||||
| CC | 12/52 | 57.1 | 0.076 | 0.53(0.29-)0.96 | 0.037 | 24/52 | 51.8 | 0.081 | 0.68(0.44-1.04) | 0.078 | |||||||||||||||||||||||||||||||||||||||||||||||||||||||||||||||||||||||||||||||||||||||||
| Trend# | |||||||||||||||||||||||||||||||||||||||||||||||||||||||||||||||||||||||||||||||||||||||||||||||||||
| TT | 119/288 | 52.0 | 1.00 | 177/288 | 44.6 | 1.00 | |||||||||||||||||||||||||||||||||||||||||||||||||||||||||||||||||||||||||||||||||||||||||||||
| TC+CC | 73/224 | 59.7 | 0.080 | 0.74(0.55-1.02) | 0.054 | 107/224 | 50.9 | 0.038 | 0.78(0.61-1.00) | 0.045 | |||||||||||||||||||||||||||||||||||||||||||||||||||||||||||||||||||||||||||||||||||||||||
| TT+TC | 180/460 | 54.5 | 1.00 | 260/460 | 47.1 | 1.00 | |||||||||||||||||||||||||||||||||||||||||||||||||||||||||||||||||||||||||||||||||||||||||||||
| CC | 12/52 | 57.1 | 0.044 | 0.57(0.31-1.03) | 0.063 | 24/52 | 51.8 | 0.102 | 0.73(0.45-1.11) | 0.139 | |||||||||||||||||||||||||||||||||||||||||||||||||||||||||||||||||||||||||||||||||||||||||
| *Pa, Log-rank P; Pb, multivariate Cox regression; MST, mean survival time. | |||||||||||||||||||||||||||||||||||||||||||||||||||||||||||||||||||||||||||||||||||||||||||||||||||
| #Trend: the prognosis showed an increased or decreased changed with the number of risk allele. | |||||||||||||||||||||||||||||||||||||||||||||||||||||||||||||||||||||||||||||||||||||||||||||||||||
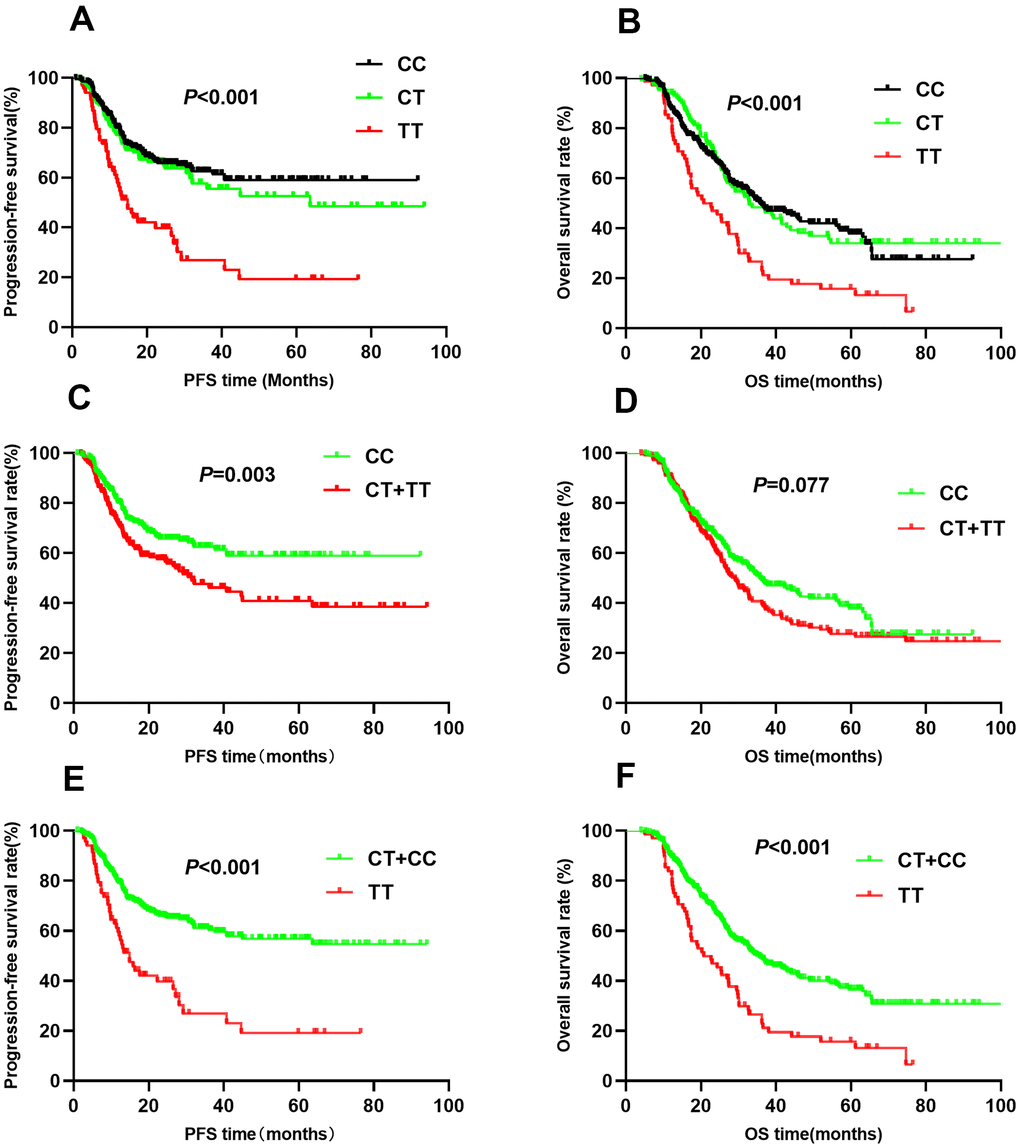
Figure 1. Kaplan-Meier survival curve analysis showing progression-free survival ((A) CC vs CT vs TT, (C) CT+TT vs CC, (E) TT vs CT+CC) and overall survival ((B) CC vs CT vs TT, (D) CT+TT vs CC, (F) TT vs CT+CC) of NSCLC patients with HIF1-alpha rs11549465.
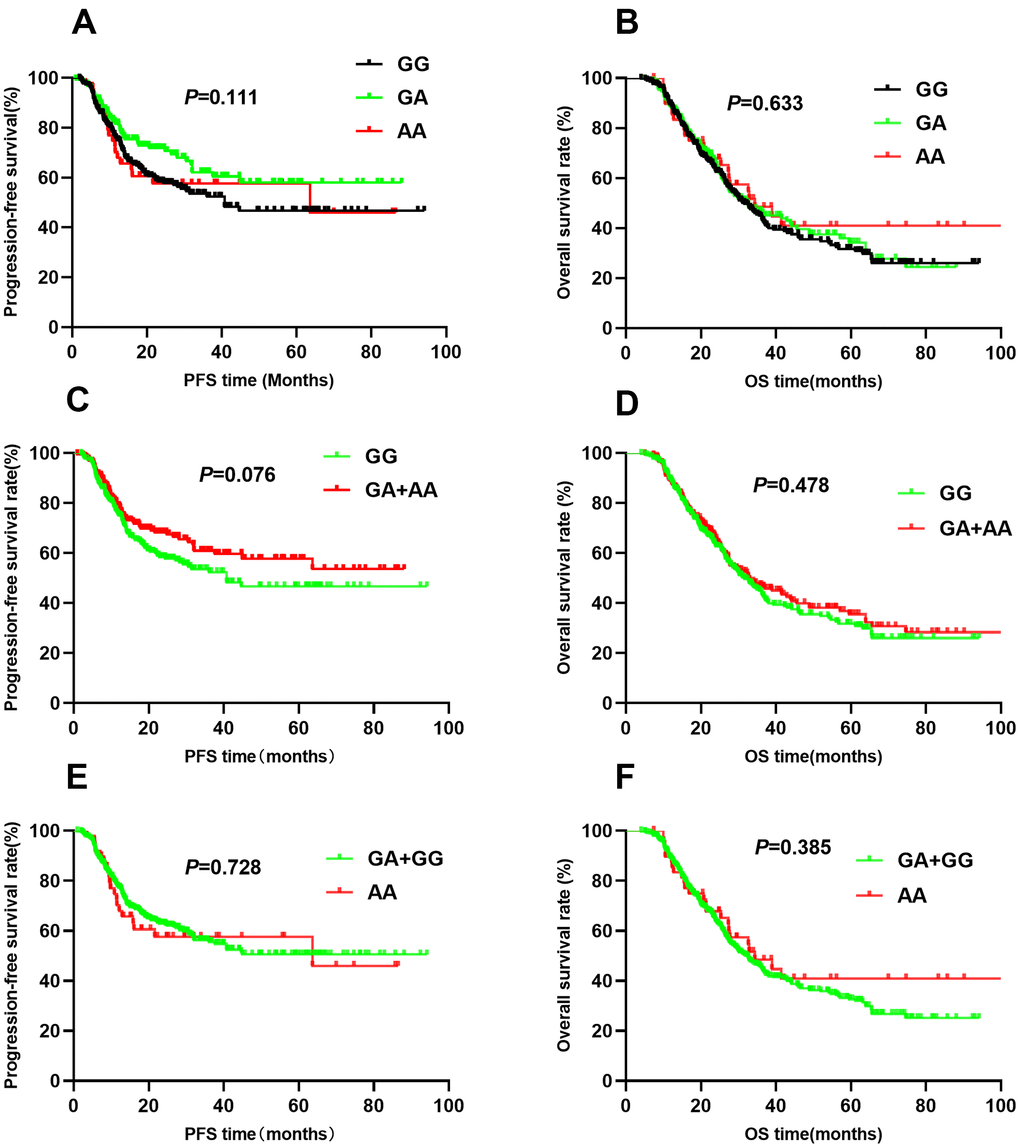
Figure 2. Kaplan-Meier survival curve analysis showing progression-free survival ((A) GG vs GA vs AA, (C) GA+AA vs GG, (E) AA vs GA+GG) and overall survival (B) GG vs GA vs AA, (D) GA+AA vs GG, (F) AA vs GA+GG) of NSCLC patients with HIF1-alpha rs11549467.
The rs2057482 SNP was associated with poor NSCLC patient survival. Compared to patients with CC genotypes, those with CT and TT genotypes had a shorter median PFS (CC vs. CT vs. TT: 61.3 vs. 48.9 vs. 19.8, P<0.001, Figure 3A) and OS (CC vs. CT vs. TT: 48.4 vs. 49.3 vs. 28.5, P<0.001, Figure 3B). Multivariate Cox regression analyses indicated that the TT genotype was associated with a poor PFS (HR=2.05, 95% CI: 1.30-3.23, P=0.002) and OS (HR=1.71, 95% CI: 1.16-2.51, P=0.007). Trend analysis indicated that the domain effect model (CT+TT) was associated with a shorter median PFS (44.7 vs. 61.3, P=0.005, Figure 3C), whereas the median OS was similar between the CT+TT and CC groups (44.2 vs. 48.4, P=0.254, Figure 3D). Patients with CT+TT genotypes had worse PFS (HR=1.46, 95% CI: 1.09-1.94, P=0.010) than those with the CC genotype; However, the OS was similar (HR=1.14, 95% CI: 0.90-1.45, P=0.70). Kaplan-Meier analysis indicated that patients with the TT genotype had worse PFS (MST: 19.8 vs. 58.0, P<0.001, Figure 3E) and OS (MST: 28.5 vs. 50.4, P<0.001, Figure 3F) than those with the CC+CT genotypes. Cox regression analyses confirmed that the TT genotype increased the risk of adverse outcomes (PFS: HR=1.84, 95% CI: 1.19-2.86, P=0.007; OS: HR=1.69, 95% CI: 1.16-2.46, P=0.006).
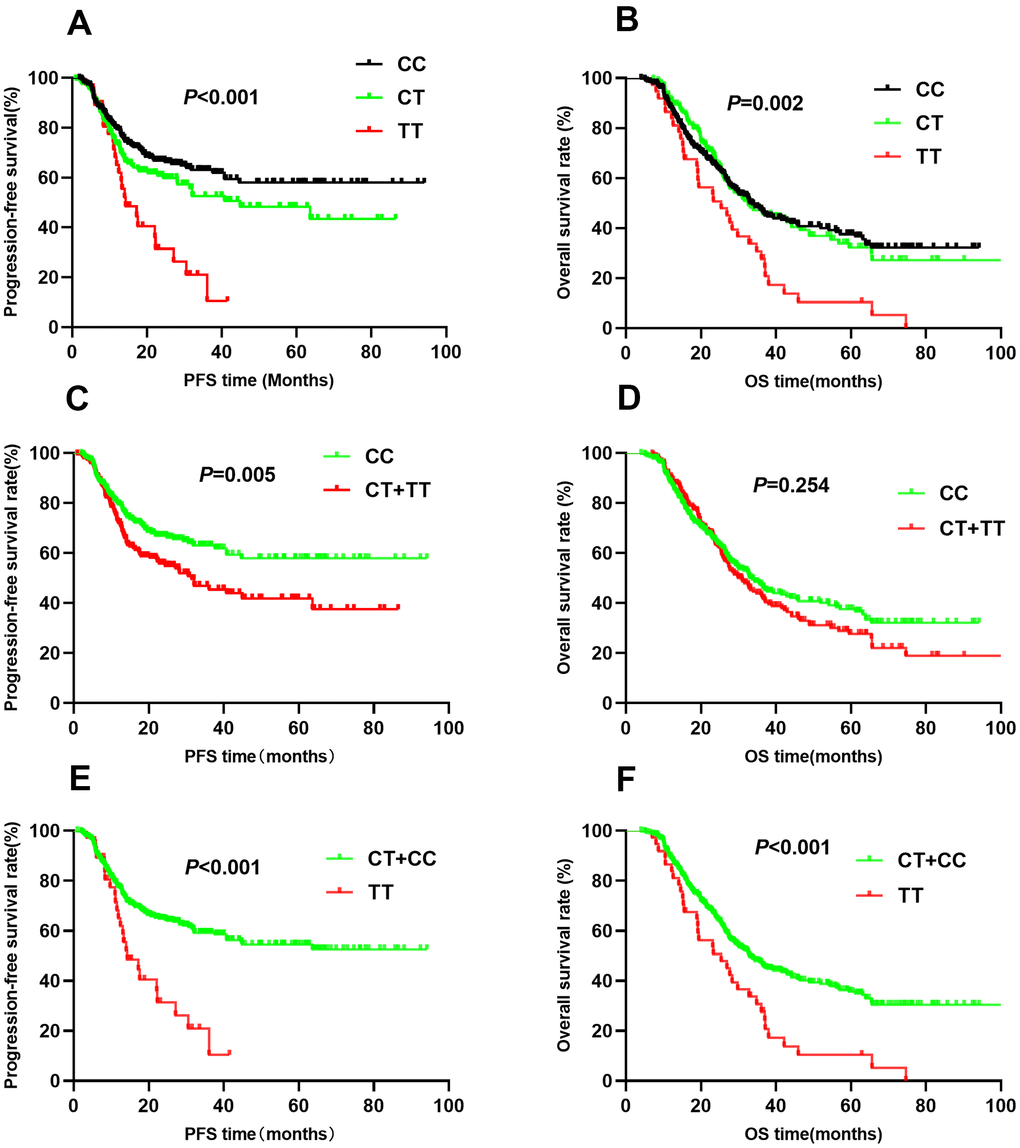
Figure 3. Kaplan-Meier survival curve analysis showing progression-free survival ((A) CC vs CT vs TT, (C) CT+TT vs CC, (E) TT vs CT+CC) and overall survival ((B) CC vs CT vs TT, (D) CT+TT vs CC, (F) TT vs CT+CC) of NSCLC patients with HIF1-alpha rs2057482.
For rs10873142, no differences were observed in PFS (TT vs. TC vs. CC: 52.0 vs. 57.5 vs. 57.1, P=0.076, Figure 4A) or OS (TT vs. TC vs. CC: 44.6 vs. 59.5 vs. 51.8, P=0.081, Figure 4B) among the different genotypes. Patients with TC+CC genotypes had a similar PFS as those with the TT genotype (P=0.080, Figure 4C). Trend analysis indicated a weak association between the TC+CC genotypes and OS (P=0.038, Figure 4D). Additionally, the CC genotype was associated with PFS (P=0.044, Figure 4E) but not OS (P=0.102, Figure 4F). Multivariate Cox regression analyses showed that genotypes were associated with PFS. However, the TC+CC genotype was weakly associated with OS (HR=0.78, 95% CI: 0.61-1.00, P=0.045). To correct for multiple comparisons, we calculated the false-positive probability with a prior probability of 0.01 to detect an HR of 1.2 or 0.83. These results are presented in Table 3. The associations of all four SNPs remained significant with a prior FPRP of 0.1.
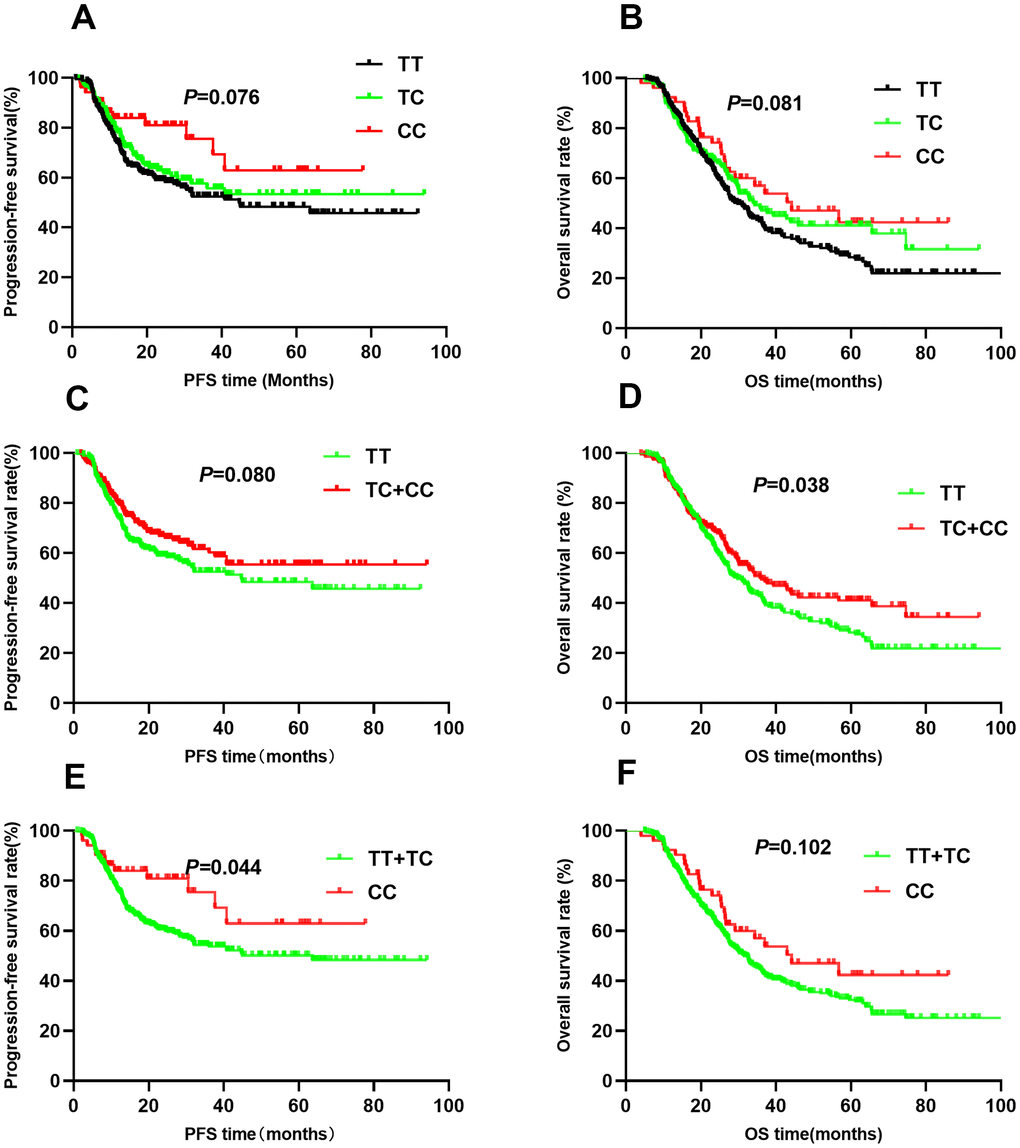
Figure 4. Kaplan-Meier survival curve analysis showing progression-free survival ((A) CC vs CT vs TT, (C) CT+TT vs CC, (E) TT vs CT+CC) and overall survival ((B) CC vs CT vs TT, (D) CT+TT vs CC, (F) TT vs CT+CC) of NSCLC patients with HIF1-alpha rs10873142.
Table 3. False-positive reports probability values for associations between gene and survival outcomes.
| SNP | Progression-free survival | Overall survival | |||||||||||||||||||||||||||||||||||||||||||||||||||||||||||||||||||||||||||||||||||||||||||||||||
| HR (95%CI) | Pa | Prior probability | HR (95%CI) | Pa | Prior probability | ||||||||||||||||||||||||||||||||||||||||||||||||||||||||||||||||||||||||||||||||||||||||||||||
| 0.2 | 0.1 | 0.01 | 0.2 | 0.1 | 0.01 | ||||||||||||||||||||||||||||||||||||||||||||||||||||||||||||||||||||||||||||||||||||||||||||||
| rs11549465 | |||||||||||||||||||||||||||||||||||||||||||||||||||||||||||||||||||||||||||||||||||||||||||||||||||
| CT vs. CC | 1.09(0.77-1.54) | 0.621 | 0.090 | 0.182 | 0.710 | 0.95(0.72-1.26) | 0.726 | 0.041 | 0.087 | 0.513 | |||||||||||||||||||||||||||||||||||||||||||||||||||||||||||||||||||||||||||||||||||||||||
| TT vs. CC | 2.07(1.42-3.01) | <0.001 | 0.118 | 0.231 | 0.768 | 1.63(1.18-2.24) | 0.003 | 0.066 | 0.137 | 0.636 | |||||||||||||||||||||||||||||||||||||||||||||||||||||||||||||||||||||||||||||||||||||||||
| CT/TT vs.CC | 1.39(1.03-1.86) | 0.029 | 0.046 | 0.099 | 0.547 | 1.16(0.91-1.47) | 0.239 | 0.018 | 0.040 | 0.313 | |||||||||||||||||||||||||||||||||||||||||||||||||||||||||||||||||||||||||||||||||||||||||
| rs11549467 | |||||||||||||||||||||||||||||||||||||||||||||||||||||||||||||||||||||||||||||||||||||||||||||||||||
| GA vs.GG | 0.76(0.54-1.06) | 0.110 | 0.078 | 0.161 | 0.678 | 1.02(0.79-1.33) | 0.856 | 0.031 | 0.067 | 0.442 | |||||||||||||||||||||||||||||||||||||||||||||||||||||||||||||||||||||||||||||||||||||||||
| AA vs.GG | 1.15(0.71-1.87) | 0.565 | 0.241 | 0.416 | 0.887 | 0.92(0.59-)1.42 | 0.697 | 0.182 | 0.334 | 0.846 | |||||||||||||||||||||||||||||||||||||||||||||||||||||||||||||||||||||||||||||||||||||||||
| GA/AA vs.GG | 0.84(0.62-1.14) | 0.264 | 0.056 | 0.119 | 0.597 | 1.00(0.78-1.28) | 0.999 | 0.022 | 0.048 | 0.359 | |||||||||||||||||||||||||||||||||||||||||||||||||||||||||||||||||||||||||||||||||||||||||
| rs2057482 | |||||||||||||||||||||||||||||||||||||||||||||||||||||||||||||||||||||||||||||||||||||||||||||||||||
| CT vs. CC | 1.32(0.97-1.81) | 0.078 | 0.064 | 0.134 | 0.630 | 1.03(0.79-1.33) | 0.855 | 0.026 | 0.057 | 0.399 | |||||||||||||||||||||||||||||||||||||||||||||||||||||||||||||||||||||||||||||||||||||||||
| TT vs. CC | 2.05(1.30-3.23) | 0.002 | 0.205 | 0.368 | 0.865 | 1.71(1.16-2.51) | 0.007 | 0.128 | 0.248 | 0.784 | |||||||||||||||||||||||||||||||||||||||||||||||||||||||||||||||||||||||||||||||||||||||||
| CT/GTT vs. CC | 1.46(1.09-1.94) | 0.010 | 0.042 | 0.090 | 0.520 | 1.14(0.90-1.45) | 0.270 | 0.02 | 0.043 | 0.330 | |||||||||||||||||||||||||||||||||||||||||||||||||||||||||||||||||||||||||||||||||||||||||
| rs10873142 | |||||||||||||||||||||||||||||||||||||||||||||||||||||||||||||||||||||||||||||||||||||||||||||||||||
| TC vs. TT | 0.80(0.59-1.10) | 0.167 | 0.066 | 0.138 | 0.638 | 0.82(0.63-1.06) | 0.130 | 0.024 | 0.053 | 0.379 | |||||||||||||||||||||||||||||||||||||||||||||||||||||||||||||||||||||||||||||||||||||||||
| CC vs. TT | 0.53(0.29-)0.96 | 0.037 | 0.061 | 0.128 | 0.617 | 0.68(0.44-1.04) | 0.078 | 0.162 | 0.303 | 0.827 | |||||||||||||||||||||||||||||||||||||||||||||||||||||||||||||||||||||||||||||||||||||||||
| TC/CC vs. TT | 0.74(0.55-0.99) | 0.044 | 0.042 | 0.090 | 0.522 | 0.78(0.61-1.00) | 0.045 | 0.021 | 0.045 | 0.342 | |||||||||||||||||||||||||||||||||||||||||||||||||||||||||||||||||||||||||||||||||||||||||
| Pa, P value for multivariate Cox regression. | |||||||||||||||||||||||||||||||||||||||||||||||||||||||||||||||||||||||||||||||||||||||||||||||||||
Stratified analysis of HIF1A genotype effects on NSCLC prognosis
To explore the relationship between clinical characteristics, HIF1A polymorphisms (rs11549465 and rs2057482), and survival outcomes, we conducted stratified analyses (Tables 4, 5). Among smokers, patients with the rs11549465 TT genotype had a worse PFS than patients with the CC genotype (20.4 vs. 42.1, P=0.004). Multivariate Cox regression analyses confirmed the association of the TT genotype with PFS (HR=1.91, 95% CI: 1.23-2.95, P=0.004) and OS (HR=1.84, 95% CI: 1.25-2.70, P=0.002). Among non-smokers, the TT genotype was associated with PFS (39.9 vs. 74.9; HR=2.31, 95% CI: 1.08-4.97, P=0.032) but not OS (adjusted P=0.3737). The association between rs11549465 polymorphisms and PFS was not affected by the histological type (P<0.05). Although TT was not associated with OS (P=0.165) in SCC patients, it was associated with OS in patients with ADC or other lung cancer types (P=0.002). The TT genotype was associated with poor prognosis (PFS and OS) in patients with stage IIIA disease and those treated with chemotherapy, but not associated with OS in patients with stage IIIB disease (P=0.063) or those receiving chemotherapy (P=0.318). The radiation dose also influenced the association between rs11549465 polymorphisms and NSCLC prognosis. Among patients receiving a dose of ≥70 Gy, the TT genotype increased the risk of poor PFS (P<0.001) and OS (P=0.006). For patients receiving a dose of <70 Gy, the TT genotype was associated with PFS (HR=1.83, 95% CI: 1.09-3.04, P=0.021) but not OS (HR=1.47, 95% CI: 0.92-2.35, P=0.107).
Table 4. Stratified analysis of clinical parameters for rs11549465 and survival outcomes.
| Parameters | Subgroup | Genotype | Progression-free survival | Overall survival | |||||||||||||||||||||||||||||||||||||||||||||||||||||||||||||||||||||||||||||||||||||||||||||||
| Event/No. | MST | Pa | HR*(95%CI) | Pb | Event/No. | MST | Pa | HR*(95%CI) | Pb | ||||||||||||||||||||||||||||||||||||||||||||||||||||||||||||||||||||||||||||||||||||||||||
| rs11549465 | |||||||||||||||||||||||||||||||||||||||||||||||||||||||||||||||||||||||||||||||||||||||||||||||||||
| Smoking | Yes | CC | 72/165 | 42.1 | 1.00 | 99/165 | 40.7 | 1.00 | |||||||||||||||||||||||||||||||||||||||||||||||||||||||||||||||||||||||||||||||||||||||||||
| CT | 37/81 | 47.0 | 0.311 | 0.94(0.62-1.42) | 0.775 | 48/81 | 46.3 | 0.618 | 0.84(0.58-1.21) | 0.343 | |||||||||||||||||||||||||||||||||||||||||||||||||||||||||||||||||||||||||||||||||||||||||
| TT | 34/47 | 20.4 | 0.004 | 1.91(1.23-2.95) | 0.004 | 42/47 | 24.5 | 0.068 | 1.84(1.25-2.70) | 0.002 | |||||||||||||||||||||||||||||||||||||||||||||||||||||||||||||||||||||||||||||||||||||||||
| CT+TT | 71/128 | 38.6 | 0.046 | 1.24(0.88-1.75) | 0.226 | 90/128 | 38.6 | 0.215 | 1.13(0.83-1.53) | 0.442 | |||||||||||||||||||||||||||||||||||||||||||||||||||||||||||||||||||||||||||||||||||||||||
| No | CC | 24/133 | 74.9 | 1.00 | 52/133 | 56.3 | 1.00 | ||||||||||||||||||||||||||||||||||||||||||||||||||||||||||||||||||||||||||||||||||||||||||||
| CT | 15/65 | 66.3 | 0.900 | 1.41(0.73-)2.73 | 0.310 | 28/65 | 56.6 | 0.463 | 1.05(0.65-1.68) | 0.852 | |||||||||||||||||||||||||||||||||||||||||||||||||||||||||||||||||||||||||||||||||||||||||
| TT | 10/21 | 39.9 | <0.001 | 2.31(1.08-4.97) | 0.032 | 15/21 | 38.6 | <0.001 | 1.31(0.72-2.38) | 0.373 | |||||||||||||||||||||||||||||||||||||||||||||||||||||||||||||||||||||||||||||||||||||||||
| CT+TT | 25/86 | 60.2 | 0.046 | 1.67(0.94-2.97) | 0.082 | 43/86 | 51.8 | 0.247 | 1.13(0.74-1.71) | 0.582 | |||||||||||||||||||||||||||||||||||||||||||||||||||||||||||||||||||||||||||||||||||||||||
| Histology | SCC | CC | 28/100 | 57.3 | 1.00 | 51/100 | 43.1 | 1.00 | |||||||||||||||||||||||||||||||||||||||||||||||||||||||||||||||||||||||||||||||||||||||||||
| CT | 23/61 | 51.7 | 0.206 | 1.47(0.83-2.61) | 0.191 | 38/61 | 44.7 | 0.489 | 1.18(0.76-1.83) | 0.453 | |||||||||||||||||||||||||||||||||||||||||||||||||||||||||||||||||||||||||||||||||||||||||
| TT | 22/31 | 24.0 | <0.001 | 2.41(1.30-4.48) | 0.006 | 25/31 | 31.1 | 0.030 | 1.43(0.86-2.37) | 0.165 | |||||||||||||||||||||||||||||||||||||||||||||||||||||||||||||||||||||||||||||||||||||||||
| CT+TT | 45/92 | 43.4 | 0.005 | 1.79(1.09-2.94) | 0.023 | 63/92 | 41.0 | 0.130 | 1.27(0.86-1.86) | 0.228 | |||||||||||||||||||||||||||||||||||||||||||||||||||||||||||||||||||||||||||||||||||||||||
| ADC and other | CC | 68/198 | 58.1 | 1.00 | 100/198 | 49.1 | 1.00 | ||||||||||||||||||||||||||||||||||||||||||||||||||||||||||||||||||||||||||||||||||||||||||||
| CT | 29/85 | 54.9 | 0.952 | 0.93(0.59-1.46) | 0.754 | 38/85 | 53.8 | 0.321 | 0.80(0.54-1.18) | 0.252 | |||||||||||||||||||||||||||||||||||||||||||||||||||||||||||||||||||||||||||||||||||||||||
| TT | 22/37 | 28.4 | 0.001 | 2.08(1.27-3.42) | 0.004 | 32/37 | 27.6 | <0.001 | 1.96(1.29-2.97) | 0.002 | |||||||||||||||||||||||||||||||||||||||||||||||||||||||||||||||||||||||||||||||||||||||||
| CT+TT | 51/122 | 47.6 | 0.120 | 1.24(0.85-1.80) | 0.272 | 70/122 | 45.2 | 0.357 | 1.10(0.80-1.51) | 0.222 | |||||||||||||||||||||||||||||||||||||||||||||||||||||||||||||||||||||||||||||||||||||||||
| Stage | IIIA | CC | 28/143 | 71.7 | 1.00 | 52/143 | 57.2 | 1.00 | |||||||||||||||||||||||||||||||||||||||||||||||||||||||||||||||||||||||||||||||||||||||||||
| CT | 21/65 | 51.7 | 0.066 | 1.79(1.00-3.20) | 0.051 | 27/65 | 60.2 | 0.851 | 1.09(0.67-1.75) | 0.734 | |||||||||||||||||||||||||||||||||||||||||||||||||||||||||||||||||||||||||||||||||||||||||
| TT | 9/19 | 37.7 | 0.002 | 3.76(1.65-8.57) | 0.002 | 14/19 | 31.4 | 0.001 | 2.95(1.53-5.70) | 0.001 | |||||||||||||||||||||||||||||||||||||||||||||||||||||||||||||||||||||||||||||||||||||||||
| CT+TT | 30/84 | 51.7 | 0.009 | 2.08(1.21-3.55) | 0.008 | 41/84 | 54.3 | 0.171 | 1.35(0.88-2.07) | 0.172 | |||||||||||||||||||||||||||||||||||||||||||||||||||||||||||||||||||||||||||||||||||||||||
| IIIB | CC | 68/155 | 44.6 | 1.00 | 99/155 | 38.8 | 1.00 | ||||||||||||||||||||||||||||||||||||||||||||||||||||||||||||||||||||||||||||||||||||||||||||
| CT | 31/81 | 55.8 | 0.586 | 0.82(0.53-1.27) | 0.368 | 49/81 | 43.9 | 0.583 | 0.89(0.62-1.27) | 0.507 | |||||||||||||||||||||||||||||||||||||||||||||||||||||||||||||||||||||||||||||||||||||||||
| TT | 35/49 | 22.6 | 0.001 | 1.73(1.14-2.65) | 0.011 | 43/49 | 29.0 | 0.023 | 1.42(0.98-2.05) | 0.063 | |||||||||||||||||||||||||||||||||||||||||||||||||||||||||||||||||||||||||||||||||||||||||
| CT+TT | 66/130 | 43.6 | 0.182 | 1.14(0.80-1.63) | 0.455 | 92/130 | 38.2 | 0.447 | 1.08(0.81-1.46) | 0.593 | |||||||||||||||||||||||||||||||||||||||||||||||||||||||||||||||||||||||||||||||||||||||||
| Chemotherapy | No | CC | 54/187 | 63.4 | 1.00 | 90/187 | 50.5 | 1.00 | |||||||||||||||||||||||||||||||||||||||||||||||||||||||||||||||||||||||||||||||||||||||||||
| CT | 29/79 | 56.9 | 0.137 | 1.55(0.98-2.46) | 0.063 | 38/79 | 52.4 | 0.994 | 1.06(0.72-)1.57 | 0.767 | |||||||||||||||||||||||||||||||||||||||||||||||||||||||||||||||||||||||||||||||||||||||||
| TT | 25/39 | 23.7 | <0.001 | 2.94(1.78-4.87) | <0.001 | 33/39 | 27.9 | <0.001 | 2.07(1.35-3.17) | 0.001 | |||||||||||||||||||||||||||||||||||||||||||||||||||||||||||||||||||||||||||||||||||||||||
| CT+TT | 54/118 | 47.7 | 0.001 | 1.97(1.34-2.91) | 0.001 | 71/118 | 43.5 | 0.047 | 1.37(0.99-1.88) | 0.057 | |||||||||||||||||||||||||||||||||||||||||||||||||||||||||||||||||||||||||||||||||||||||||
| Yes | CC | 42/111 | 48.1 | 1.00 | 61/111 | 39.8 | 1.00 | ||||||||||||||||||||||||||||||||||||||||||||||||||||||||||||||||||||||||||||||||||||||||||||
| CT | 23/67 | 51.9 | 0.479 | 0.72(0.42-1.22) | 0.223 | 38/67 | 48.1 | 0.530 | 0.79(0.51-1.20) | 0.264 | |||||||||||||||||||||||||||||||||||||||||||||||||||||||||||||||||||||||||||||||||||||||||
| TT | 19/29 | 30.0 | 0.038 | 1.22(0.69-2.17) | 0.492 | 24/29 | 30.8 | 0.132 | 1.29(0.79-2.11) | 0. 318 | |||||||||||||||||||||||||||||||||||||||||||||||||||||||||||||||||||||||||||||||||||||||||
| CT+TT | 42/96 | 44.9 | 0.670 | 0.88(0.56-1.39) | 0.591 | 62/96 | 43.7 | 0.858 | 0.93(0.64-1.34) | 0.684 | |||||||||||||||||||||||||||||||||||||||||||||||||||||||||||||||||||||||||||||||||||||||||
| Dose | ≥70Gy | CC | 34/150 | 69.7 | 1.00 | 65/150 | 53.0 | 1.00 | |||||||||||||||||||||||||||||||||||||||||||||||||||||||||||||||||||||||||||||||||||||||||||
| CT | 26/85 | 63.0 | 0.136 | 1.36(0.80-2.32) | 0.252 | 39/85 | 53.1 | 0.954 | 0.94(0.62-1.42) | 0.938 | |||||||||||||||||||||||||||||||||||||||||||||||||||||||||||||||||||||||||||||||||||||||||
| TT | 20/34 | 24.8 | <0.001 | 3.01(1.67-5.41) | <0.001 | 30/34 | 28.8 | <0.001 | 1.91(1.20-3.01) | 0.006 | |||||||||||||||||||||||||||||||||||||||||||||||||||||||||||||||||||||||||||||||||||||||||
| CT+TT | 46/119 | 53.7 | 0.002 | 1.77(1.11-2.83) | 0.016 | 69/119 | 44.8 | 0.088 | 1.19(0.84-1.71) | 0.331 | |||||||||||||||||||||||||||||||||||||||||||||||||||||||||||||||||||||||||||||||||||||||||
| <70Gy | CC | 62/148 | 42.5 | 1.00 | 86/148 | 39.2 | 1.00 | ||||||||||||||||||||||||||||||||||||||||||||||||||||||||||||||||||||||||||||||||||||||||||||
| CT | 26/61 | 44.5 | 0.995 | 0.98(0.61-1.58) | 0.983 | 37/61 | 46.8 | 0.906 | 0.99(0.66-1.47) | 0.944 | |||||||||||||||||||||||||||||||||||||||||||||||||||||||||||||||||||||||||||||||||||||||||
| TT | 24/34 | 26.9 | 0.003 | 1.83(1.09-3.04) | 0.021 | 27/34 | 29.6 | 0.030 | 1.47(0.92-2.35) | 0.107 | |||||||||||||||||||||||||||||||||||||||||||||||||||||||||||||||||||||||||||||||||||||||||
| CT+TT | 50/95 | 39.0 | 0.141 | 1.25(0.85-1.84) | 0.265 | 64/95 | 42.3 | 0.323 | 1.14(0.81-1.60) | 0.461 | |||||||||||||||||||||||||||||||||||||||||||||||||||||||||||||||||||||||||||||||||||||||||
| *Pa, Log-rank P; Pb, cox regression; SCC, squamous cell carcinoma; ADC, adenocarcinoma; MST, mean survival time. | |||||||||||||||||||||||||||||||||||||||||||||||||||||||||||||||||||||||||||||||||||||||||||||||||||
Table 5. Stratified analysis of clinical parameters for rs2057482 and survival outcomes.
| Parameters | Subgroup | Genotype | Progression-free survival | Overall survival | |||||||||||||||||||||||||||||||||||||||||||||||||||||||||||||||||||||||||||||||||||||||||||||||
| Event/No. | MST | Pa | HR*(95%CI) | Pb | Event/No. | MST | Pa | HR*(95%CI) | Pb | ||||||||||||||||||||||||||||||||||||||||||||||||||||||||||||||||||||||||||||||||||||||||||
| rs2057482 | |||||||||||||||||||||||||||||||||||||||||||||||||||||||||||||||||||||||||||||||||||||||||||||||||||
| Smoking | Yes | CC | 75/178 | 48.9 | 1.00 | 107/178 | 43.4 | 1.00 | |||||||||||||||||||||||||||||||||||||||||||||||||||||||||||||||||||||||||||||||||||||||||||
| CT | 53/93 | 36.6 | 0.062 | 1.31(0.91-1.87) | 0.147 | 61/93 | 39.2 | 0.916 | 1.00(0.72-1.38) | 0.998 | |||||||||||||||||||||||||||||||||||||||||||||||||||||||||||||||||||||||||||||||||||||||||
| TT | 15/22 | 20.1 | 0.023 | 1.48(0.84-2.62) | 0.173 | 21/22 | 26.6 | 0.027 | 1.55(0.96-2.52) | 0.075 | |||||||||||||||||||||||||||||||||||||||||||||||||||||||||||||||||||||||||||||||||||||||||
| CT+TT | 68/115 | 35.0 | 0.018 | 1.34(0.96-1.88) | 0.087 | 82/118 | 36.6 | 0.390 | 1.10(0.82-1.48) | 0.541 | |||||||||||||||||||||||||||||||||||||||||||||||||||||||||||||||||||||||||||||||||||||||||
| No | CC | 25/136 | 75.0 | 1.00 | 54/136 | 43.4 | 1.00 | ||||||||||||||||||||||||||||||||||||||||||||||||||||||||||||||||||||||||||||||||||||||||||||
| CT | 15/68 | 65.2 | 0.710 | 1.31(0.67-2.54) | 0.434 | 29/68 | 39.2 | 0.900 | 1.08(0.67-1.73) | 0.763 | |||||||||||||||||||||||||||||||||||||||||||||||||||||||||||||||||||||||||||||||||||||||||
| TT | 9/15 | 19.0 | <0.001 | 4.65(1.99-10.89) | <0.001 | 12/15 | 26.6 | 0.009 | 2.40(1.22-4.73) | 0.012 | |||||||||||||||||||||||||||||||||||||||||||||||||||||||||||||||||||||||||||||||||||||||||
| CT+TT | 24/83 | 57.9 | 0.131 | 1.77(0.98-3.18) | 0.058 | 41/83 | 52.9 | 0.455 | 1.29(0.84-1.97) | 0.247 | |||||||||||||||||||||||||||||||||||||||||||||||||||||||||||||||||||||||||||||||||||||||||
| Histology | SCC | CC | 29/111 | 68.2 | 1.00 | 59/111 | 46.7 | 1.00 | |||||||||||||||||||||||||||||||||||||||||||||||||||||||||||||||||||||||||||||||||||||||||||
| CT | 32/64 | 36.3 | 0.002 | 2.43(1.43-4.13) | 0.001 | 39/64 | 43.5 | 0.390 | 1.31(0.86-1.99) | 0.206 | |||||||||||||||||||||||||||||||||||||||||||||||||||||||||||||||||||||||||||||||||||||||||
| TT | 12/17 | 14.9 | <0.001 | 4.09(1.99-8.43) | <0.001 | 16/17 | 23.1 | <0.001 | 2.71(1.49-4.93) | 0.001 | |||||||||||||||||||||||||||||||||||||||||||||||||||||||||||||||||||||||||||||||||||||||||
| CT+TT | 44/81 | 33.1 | <0.001 | 2.71(1.65-4.46) | <0.001 | 55/81 | 38.4 | 0.059 | 1.53(1.04-2.24) | 0.032 | |||||||||||||||||||||||||||||||||||||||||||||||||||||||||||||||||||||||||||||||||||||||||
| ADC and other | CC | 71/203 | 56.3 | 1.00 | 102/203 | 48.9 | 1.00 | ||||||||||||||||||||||||||||||||||||||||||||||||||||||||||||||||||||||||||||||||||||||||||||
| CT | 36/97 | 54.5 | 0.875 | 0.90(0.60-1.36) | 0.624 | 51/97 | 19.2 | 0.534 | 0.89(0.63-1.25) | 0.505 | |||||||||||||||||||||||||||||||||||||||||||||||||||||||||||||||||||||||||||||||||||||||||
| TT | 12/20 | 22.7 | 0.045 | 1.47(0.78-2.76) | 0.237 | 17/20 | 33.4 | 0.100 | 1.29(0.76-2.19) | 0.354 | |||||||||||||||||||||||||||||||||||||||||||||||||||||||||||||||||||||||||||||||||||||||||
| CT+TT | 48/117 | 50.4 | 0.633 | 1.00(0.69-1.45) | 0.992 | 68/117 | 45.6 | 0.990 | 0.97(0.71-1.32) | 0.822 | |||||||||||||||||||||||||||||||||||||||||||||||||||||||||||||||||||||||||||||||||||||||||
| Stage | IIIA | CC | 28/132 | 68.1 | 1.00 | 47/132 | 58.6 | 1.00 | |||||||||||||||||||||||||||||||||||||||||||||||||||||||||||||||||||||||||||||||||||||||||||
| CT | 21/79 | 54.2 | 0.492 | 1.19(0.67-2.11) | 0.561 | 32/79 | 59.4 | 0.974 | 0.93(0.59-1.47) | 0.757 | |||||||||||||||||||||||||||||||||||||||||||||||||||||||||||||||||||||||||||||||||||||||||
| TT | 9/16 | 21.6 | <0.001 | 4.45(1.93-10.22) | <0.001 | 14/16 | 27.0 | <0.001 | 2.56(1.34-4.88) | 0.004 | |||||||||||||||||||||||||||||||||||||||||||||||||||||||||||||||||||||||||||||||||||||||||
| CT+TT | 30/95 | 50.1 | 0.094 | 1.52(0.90-2.58) | 0.118 | 46/95 | 53.2 | 0.251 | 1.15(0.76-1.75) | 0.512 | |||||||||||||||||||||||||||||||||||||||||||||||||||||||||||||||||||||||||||||||||||||||||
| IIIB | CC | 72/182 | 55.6 | 1.00 | 114/182 | 42.2 | 1.00 | ||||||||||||||||||||||||||||||||||||||||||||||||||||||||||||||||||||||||||||||||||||||||||||
| CT | 47/82 | 37.9 | 0.033 | 1.34(0.92-1.96) | 0.131 | 58/82 | 38.9 | 0.559 | 1.07(0.77-1.48) | 0.688 | |||||||||||||||||||||||||||||||||||||||||||||||||||||||||||||||||||||||||||||||||||||||||
| TT | 15/21 | 18.6 | 0.028 | 1.56(0.88-2.75) | 0.127 | 19/21 | 29.7 | 0.170 | 1.35(0.82-2.23) | 0.239 | |||||||||||||||||||||||||||||||||||||||||||||||||||||||||||||||||||||||||||||||||||||||||
| CT+TT | 62/103 | 35.2 | 0.009 | 1.39(0.98-1.97) | 0.065 | 77/103 | 36.5 | 0.317 | 1.13(0.84-1.52) | 0.430 | |||||||||||||||||||||||||||||||||||||||||||||||||||||||||||||||||||||||||||||||||||||||||
| Chemotherapy | No | CC | 62/194 | 60.6 | 1.00 | 97/194 | 49.1 | 1.00 | |||||||||||||||||||||||||||||||||||||||||||||||||||||||||||||||||||||||||||||||||||||||||||
| CT | 38/95 | 51.4 | 0.363 | 1.22(0.81-1.84) | 0.350 | 49/95 | 49.9 | 0.593 | 1.00(0.70-1.42) | 0.997 | |||||||||||||||||||||||||||||||||||||||||||||||||||||||||||||||||||||||||||||||||||||||||
| TT | 8/16 | 18.9 | 0.032 | 1.70(0.80-3.62) | 0.170 | 15/16 | 25.8 | 0.001 | 2.28(1.31-3.98) | 0.004 | |||||||||||||||||||||||||||||||||||||||||||||||||||||||||||||||||||||||||||||||||||||||||
| CT+TT | 46/111 | 49.6 | 0.165 | 1.28(0.87-1.89) | 0.214 | 64/111 | 45.6 | 0.684 | 1.16(0.84-1.60) | 0.380 | |||||||||||||||||||||||||||||||||||||||||||||||||||||||||||||||||||||||||||||||||||||||||
| Yes | CC | 38/120 | 57.0 | 1.00 | 64/120 | 46.7 | 1.00 | ||||||||||||||||||||||||||||||||||||||||||||||||||||||||||||||||||||||||||||||||||||||||||||
| CT | 30/66 | 43.6 | 0.105 | 1.37(0.83-2.25) | 0.217 | 41/66 | 42.2 | 0.580 | 1.05(0.70-1.58) | 0.804 | |||||||||||||||||||||||||||||||||||||||||||||||||||||||||||||||||||||||||||||||||||||||||
| TT | 16/21 | 19.4 | 0.001 | 2.41(1.31-4.42) | 0.005 | 18/21 | 30.7 | 0.126 | 1.43(0.83-2.48) | 0.197 | |||||||||||||||||||||||||||||||||||||||||||||||||||||||||||||||||||||||||||||||||||||||||
| CT+TT | 46/87 | 37.2 | 0.011 | 1.62(1.04-2.53) | 0.032 | 59/87 | 38.6 | 0.269 | 1.14(0.79-1.65) | 0.480 | |||||||||||||||||||||||||||||||||||||||||||||||||||||||||||||||||||||||||||||||||||||||||
| Dose | ≥70Gy | CC | 42/169 | 67.3 | 1.00 | 72/169 | 54.6 | 1.00 | |||||||||||||||||||||||||||||||||||||||||||||||||||||||||||||||||||||||||||||||||||||||||||
| CT | 30/86 | 56.5 | 0.106 | 1.53(0.95-2.48) | 0.080 | 49/86 | 45.2 | 0.142 | 1.51(1.04-)2.19 | 0.029 | |||||||||||||||||||||||||||||||||||||||||||||||||||||||||||||||||||||||||||||||||||||||||
| TT | 8/14 | 21.4 | 0.003 | 2.70(1.22-5.98) | 0.014 | 13/14 | 29.1 | 0.001 | 2.61(1.42-4.93) | 0.002 | |||||||||||||||||||||||||||||||||||||||||||||||||||||||||||||||||||||||||||||||||||||||||
| CT+TT | 38/100 | 52.6 | 0.026 | 1.68(1.07-2.63) | 0.025 | 62/100 | 41.4 | 0.025 | 1.65(1.17-)2.34 | 0.004 | |||||||||||||||||||||||||||||||||||||||||||||||||||||||||||||||||||||||||||||||||||||||||
| <70Gy | CC | 58/145 | 50.1 | 1.00 | 89/145 | 39.6 | 1.00 | ||||||||||||||||||||||||||||||||||||||||||||||||||||||||||||||||||||||||||||||||||||||||||||
| CT | 38/75 | 41.1 | 0.448 | 1.17(0.77-1.78) | 0.467 | 41/75 | 50.9 | 0.119 | 0.69(0.47-1.01) | 0.059 | |||||||||||||||||||||||||||||||||||||||||||||||||||||||||||||||||||||||||||||||||||||||||
| TT | 16/23 | 18.4 | 0.016 | 1.75(0.99-3.10) | 0.054 | 20/23 | 27.5 | 0.153 | 1.38(0.83-2.30) | 0.215 | |||||||||||||||||||||||||||||||||||||||||||||||||||||||||||||||||||||||||||||||||||||||||
| CT+TT | 54/98 | 37.2 | 0.131 | 1.30(0.89-1.90) | 0.169 | 61/98 | 45.4 | 0.443 | 0.83(0.59-1.16) | 0.273 | |||||||||||||||||||||||||||||||||||||||||||||||||||||||||||||||||||||||||||||||||||||||||
| *Pa, Log-rank P; Pb, multivariate Cox regression; SCC, squamous cell carcinoma; ADC, adenocarcinoma; MST, mean survival time; MST, mean survival time. | |||||||||||||||||||||||||||||||||||||||||||||||||||||||||||||||||||||||||||||||||||||||||||||||||||
Smoking did not influence the association between rs2057482 polymorphisms and survival outcomes (PFS and OS). The TT genotype was associated with PFS and OS in both smokers and non-smokers. In SCC patients, the TT genotype was associated with a poor PFS (HR=1.09, 95% CI:1.99-8.43, P<0.001) and OS (HR=2.71, 95% CI:1.49-4.93, P=0.001). These associations were not significant in patients with other histological types. The disease stage also affected the association between rs2057482 polymorphisms and prognosis. For instance, patients with stage IIIA disease had the TT genotype associated with PFS (P<0.001) and OS (P=0.004); These associations were not significant in patients with stage IIIB disease. Patients that did not receive chemotherapy had a poorer OS (HR=2.28, 95% CI: 1.31-3.98, P=0.004) compared to those receiving chemotherapy. In contrast, patients receiving chemotherapy had a worse PFS (HR=2.41, 95% CI: 1.31-4.42, P=0.005). For patients receiving a dose of ≥70 Gy, the TT genotype was associated with a poor PFS (HR=2.70, 95% CI: 1.22-5.98, P=0.014) and OS (HR=2.61, 95% CI: 1.42-4.93, P=0.002). For patients receiving a dose of<70Gy, t However, none of genotypes were associated with survival.
The association between the SNPs and HIF1A mRNA levels
We used the GTEx database to assess the relationships between the rs2057482 and rs11549465 SNPs and HIF1A mRNA levels. There were significant differences in mRNA expression among the three genotypes. HIF1A mRNA levels were elevated in lung tissues harboring the rs2057482 (Figure 5A) or rs11549465 T allele (Figure 5B). By contrast, the C allele was associated with HIF1A downregulation.
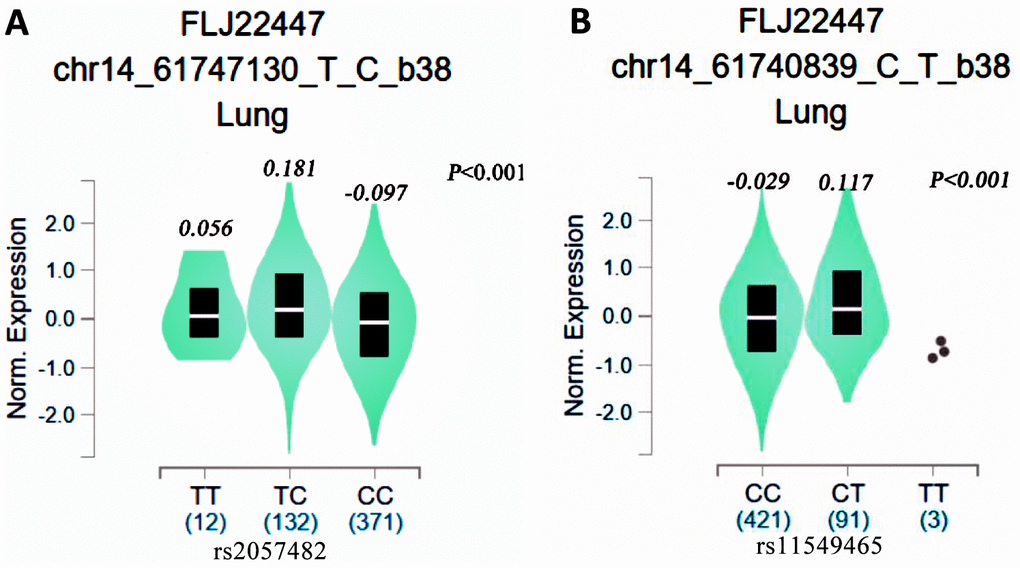
Figure 5. eQTL analysis of HIF1-alpha SNPs from the GTEx database (A: rs2057482, B: 11549465).
Discussion
We identified two HIF1A SNPs (rs11549465 and rs2057482) that were associated with the survival of NSCLC patients undergoing radiotherapy. Individuals with the rs11549465 and rs2057482 T alleles had a worse PFS and OS than patients with the corresponding C allele. Stratified analyses indicated that smoking, histological type, TNM stage, chemotherapy, and radiation dose were factors affecting the association between HIF1A SNPs and OS in NSCLC patients. However, these factors had no effect on the relationship between HIF1A SNPs and PFS. We also found that the T alleles of rs11549465 and rs2057482 were associated with elevated HIF1A mRNA levels. To the best of our knowledge, this is the first study to show an association between HIF1A polymorphisms and the prognosis of locally advanced NSCLC in patients undergoing radiation therapy.
The human HIF1 gene is located on chromosome 14 (14q21-24). The 3,720-bp sequence of HIF1A encodes 826 amino acids. Under hypoxic conditions, HIF-1 accumulates in the cells upon prolyl-hydroxylation failure at positions 402 and 564. Subsequently, the transcriptionally active HIF-1 complex binds to DNA sequences of downstream target genes, including vascular endothelial growth factor (VEGF), erythropoietin, inducible nitric oxide synthase, heme oxygenase 1, and glycosylase [17]. Expression of these genes has been linked to lung cancer development, progression, and metastasis. Elevated HIF-1α levels have also been associated with lung cancer development and progression [18]. Previous studies have shown that the rs2057482 T allele plays a protective role in cervical cancer. Notably, individuals with the CC genotype were shown to have a 1.44-fold higher risk of lung cancer than those with CT/TT genotypes [19]. The rs2057482 T allele has also increases the risk of prostate cancer in the Chinese Han population [20]. He et al. found that the TT genotype of HIF1A was common in small cell carcinoma (OR=1.73, 95% CI: 1.05-2.84) and that among passive smokers, rs2057482 TT carriers were 2.195 times more likely to develop lung cancer compared to CC carriers (95% CI: 1.038-4.463). Guo et al. found that hepatocellular carcinoma patients with the HIF1A rs2057482 TT genotype had a worse prognosis compared to those with the CC genotype [21], which contradicts our findings. These discrepancies suggest that the polymorphisms effects on patient survival may be tumor type-specific. Additionally, each HIF1A SNP may have a different effect on prognosis. For instance, the rs2057482 TT genotype could play a protective role in hepatocellular carcinoma but lead to a poor prognosis in lung cancer. Wu et al. investigated the effects of HIF1A genetic variants and A mRNA levels on chemotherapy response and patient survival. They found that the C1772T (P582S) CC genotype was associated with a chemotherapy response and that patients with the TT genotype had a poor OS and PFS [14], consistent with our findings. Our results also suggest that the T alleles of rs2057482 and rs11549465 are risk factors associated with poor NSCLC prognosis.
Radiation therapy is one of the most common treatments for locally advanced tumors. Radiation can induce HIF-1 activity in tumor cells, which causes an upregulation of VEGF and b fibroblast growth factor. These cytokines reduce the endothelial cell sensitivity to radiation, thereby promoting radiotherapy resistance in tumors. Thus, elevated HIF-1 levels may enhance radiation resistance in tumors [22]. Sensitivity to radiotherapy may be restored by inhibiting HIF-1 expression or activity. For instance, Kessler et al. used short-interfering RNAs (siRNAs) to suppress HIF-1 expression in human glioma cells (U251 and U343) and found that under hypoxic conditions the radiation resistance of glioma cells was alleviated [23]. In refractory ovarian cancer, siRNAs were used to downregulate HIF-1 and its downstream gene VEGF. Inhibition of HIF-1 and VEGF expression reduced tumor cell proliferation rate [24]. HIF-1 also regulates microRNAs expressions. For example, under hypoxic conditions, HIF-1 induces the expression of mir-210, mir-155, mir-372/373, and mir-10b, as well as downregulates the expression of mir-20b and mir-200b. In hypoxic human liver cancer cells (SMMC-7721, HepG2, and HuH7), downregulation of mir-210 inhibited cancer cell proliferation, induced cell apoptosis, and enhanced radiation sensitivity [25].
HIF-1α inhibits cancer cell apoptosis by promoting the expression of VEGF, glucose transporter 1, and other anti-apoptotic agents [26]. Additionally, HIF-1 enhances the expression of VEGFR2, TGFβ, and endothelin-1, all of which induce neovascularization and increase vascular permeability [27]. Under hypoxic conditions, lung cancer cells produce most of their ATP through glycolysis [28]. Here, we showed significant differences in HIF1A mRNA levels among patients with different genotypes. Polymorphisms may affect the transcription of HIF1A and thereby regulate HIF-1 protein levels and activity. Future studies are needed to confirm the functional roles of HIF1A polymorphisms. Given the crucial role of HIF-1 in angiogenesis, metabolism, and DNA repair, polymorphisms affecting HIF1A may provide an advantage to tumor cells by resisting the cytotoxic effects of radiation.
In the stratified analysis, we noted that the gene polymorphisms affected the prognosis of patients with smoking status, histology, stage, chemotherapy, and radiation dose. Broadly speaking, smoking, histology, stage, and dose did not change the effect of rs11549465 polymorphism on lung cancer prognosis. However, patients without chemotherapy and rs11549465 TT had a worse prognosis. This suggests that interactions exist between the genes and chemotherapy. Similar results were not found for rs2057482. Taken together, these findings indicate that the prognosis was affected by gene factors and the environment.
This study has several limitations. First, it was a single-center study, and selection bias could have affected our findings. Future multi-center studies are required to confirm the findings presented here. Second, we found that the rs11873142 C allele was weakly associated with poor OS. The FPRP analysis produced a P-value of <0.2, possibly reflecting the low statistical power of this analysis. The associations also need to be verified in a s larger cohort size. Third, we selected SNPs that are common among the Asian population. Thus, the functional roles of other SNPs should be investigated. Additionally, although the results showed an expression trend that was caused by different genotypes, the data from eQTL needs to be verified using a larger sample size. Finally, our analyses were limited to a single gene, and future studies should determine the association of multiple genes with survival outcomes in NSCLC patients.
In conclusion, we identified HIF1A SNPs rs11549465 and rs2057482 as associated with survival in NSCLC patients undergoing radiation therapy. These associations were affected by different clinical characteristics. Hence, these two SNPs can be independent prognostic biomarkers in NSCLC patients undergoing radiation therapy. However, the prognostic value of these SNPs should be validated in large-cohort, prospective studies.
Materials and Methods
Study population
This was a single-center follow-up study. All patients were newly diagnosed with NSCLC as confirmed by pathological examination and treated with radiotherapy or chemoradiotherapy. The tumor stage was determined from the American Joint Committee on Cancer/Union for International Cancer Control (AJCC/UICC 7th edition) guidelines [29]. The histological grade was determined by the World Health Organization classification system for NSCLC. Patients that had other tumors, a cancer history of, underwent surgery or stereotactic ablative radiotherapy, were excluded from the study. Patients with severe immune diseases, inflammatory diseases, severe organ failure, cardiovascular diseases, or a life expectancy of less than one month were also excluded. The study was approved by the Ethics Committee of the Second Affiliated Hospital of Zhengzhou University.
SNP identification and genotyping
To identify HIF1A SNPs, we searched the dbSNP database (https://www.ncbi.nlm.nih.gov/snp/) for the HIF1A gene with the minor allele frequency set to >3%. Subsequently, we analyzed the linkage disequilibrium of the identified SNPs using the 1000 Genomes Project database. We searched PubMed and the Chinese China National Knowledge Infrastructure to identify studies of the association between HIF1 gene polymorphisms and lung cancer risk among Chinese populations. We analyzed the search results for overlaps inrs2057482, rs11549465, rs10873142, rs11549467, rs2301113, rs41508050, rs10645014, rs41492849, rs34005929; and identified the following four SNPs: rs11549465, rs11549467, rs2057482, rs10873142.
To genotype the SNPs, we extracted the genomic DNA from patients using 5 ml of venous blood. SNPs were genotyped using the polymerase chain reaction (PCR)-based restriction fragment length polymorphism method and the TaqMan SNP Genotyping Assays Kit (Thermo Fisher Scientific, USA). DNA samples were stored at −20° C, and DNA amplification was performed separately for the four variants using predesigned reverse and forward primers (Supplementary Table 1). Amplification of the exon 12 region (rs11549465, rs11549467) of HIF1A was performed in a final volume of 50 μl containing 50 ng of genomic DNA, 2.5 mM MgCl2, 100 mM dNTP, 50 pmol/μl of each primer, and 1.0 U/ml of Taq DNA polymerase. For rs2057482 and rs10873142, the 50-μl reaction mixture contained 50 ng of template DNA, 2.5 mM MgCl2, 100 pmol/μl of each primer, 100 mM dNTP, and 1 U/μl Taq DNA polymerase. Amplification was performed at 95° C for 10 min, followed by 40 cycles of 95° C for 15 sec and 60° C for 1 min. The final extension was performed at 72° C for 10 min. PCR products were resolved by 2% agarose gel electrophoresis, and the results were analyzed using TYPER 4.0. For the rs11549465 polymorphism, the C allele yielded 128-bp and 19-bp products, and the T allele yielded a 147-bp product. For the rs11549467 polymorphism, the G allele yielded 143-bp and 114-bp products, and the A allele yielded a 255-bp product. For the rs2057482 polymorphism, the restriction fragments were 191 bp and 145 bp. For the rs10873142 polymorphism, the restriction fragments were 864 bp for the T allele and 707 bp and 157 bp for the C allele.
Data collection
The clinical characteristics of patients were obtained from medical records. Data was collected for gender, age, body mass index (BMI), smoking status, drinking status, KPS), histological type, TNM stage, chemotherapy, radiation technology, and radiation dose. Current smokers or individuals with a history of daily smoking were regarded as smokers. Drinkers were those who consumed alcohol more than twice a month [30]. Individuals with a BMI >24 were considered as overweight. Patients older than >60 years were considered elderly [31, 32].
Patients were treated with routine 3-dimensional conformal radiotherapy (3D-CRT) or intensity-modulated radiotherapy (IMRT). Conventional radiotherapy targeted the primary site, ipsilateral hilum, and mediastinal drainage area. Computed tomography (CT) simulation-based positioning was performed for 3D-CRT or IMRT patients. CT and positron emission tomography (PET)/CT examination were used to assess the presence of mediastinal lymph node metastasis, and lung lesions in the lung tissue window were recorded as the gross target volume. The clinical target volume (CTV) included the ipsilateral hilum and high-risk lymph drainage area. To account for positioning errors, organ movements, and other errors, we defined the planning target volume as 5RAM around the CTV. Radiation therapy was adjusted according to the diagnosis, treatment capabilities of the radiotherapy department, and the patient’s physical strength, age, lung function, pulmonary complications, and tolerance. The treatment plan was reviewed and approved by a physician; A Varian linear accelerator was used for all treatments.
The primary outcomes were progression-free survival (PFS) and OS. PFS was defined as the period from treatment completion to death or disease progression; OS was defined as the period from treatment completion to death regardless of the cause [33]. Patient follow-up was performed through phone calls and outpatient records every three months for the first two years and every six months thereafter. CT, PET/CT, and other examinations were performed when necessary during the follow-up period.
Expression quantitative trait loci analysis
We assessed the correlation between HIF1A SNPs and mRNA levels from the GTEx portal database (https://www.gtexportal.org/home/), and the results are presented as violin plots.
Statistical analysis
Patient age and radiation doses were transformed into categorical variables. The Kaplan-Meier method and log-rank test were used to compare the PFS and OS of patients with different genotypes. Univariate and multivariate Cox regression analyses were conducted to calculate hazard risks (HRs) and 95% confidence intervals (CIs) to assess the association between clinical parameters, genotypes, and survival outcomes. The multivariate Cox regression model was adjusted for the following variables: sex (male vs. female), age (≥60 vs. <60), BMI (overweight vs. normal), smoking (yes vs. no), drinking (yes vs. no), KPS (≥80 vs. <80), histological type (squamous cell carcinoma [SSC], adenocarcinoma [ADC], or other), radiation technology (IMRT vs. CRT or other), and radiation dose (≥70 vs. <70). Multiple comparisons were corrected using false-positive report probability (FPRP) analysis with a prior probability of 0.01 to detect an HR of 1.2. Stratified analyses were performed for histological type, radiation technology, smoking, radiation dose, TNM stage, and chemotherapy. All analyses were conducted using SPSS 23.0 and GraphPad Prism 8.0 software. A value of P<0.05 was considered significant unless specified otherwise.
Data accessibility
The original data is available from the corresponding authors upon request.
Supplementary Materials
Author Contributions
LZZ conceived and designed the study, obtained funds, and critically reviewed the final draft of the manuscript. LZZ performed statistical analyses, and edited the manuscript. ZY and WJ collected the samples, measured data, and reviewed the paper. ZY, WJ, and LZZ inspected the figures and tables. All authors approved the final draft of the manuscript submitted for review and publication.
Conflicts of Interest
The authors declare no conflicts of interest.
Funding
This study was supported by the Henan Provincial Medical Science and Technique Project (NO:2018020148).
References
- 1. Fidler MM, Bray F, Soerjomataram I. The global cancer burden and human development: a review. Scand J Public Health. 2018; 46:27–36. https://doi.org/10.1177/1403494817715400 [PubMed]
- 2. Wood R, Taylor-Stokes G, Smith F, Chaib C. The humanistic burden of advanced non-small cell lung cancer (NSCLC) in Europe: a real-world survey linking patient clinical factors to patient and caregiver burden. Qual Life Res. 2019; 28:1849–61. https://doi.org/10.1007/s11136-019-02152-6 [PubMed]
- 3. Gridelli C, Rossi A, Carbone DP, Guarize J, Karachaliou N, Mok T, Petrella F, Spaggiari L, Rosell R. Non-small-cell lung cancer. Nat Rev Dis Primers. 2015; 1:15009. https://doi.org/10.1038/nrdp.2015.9 [PubMed]
- 4. Zhang C, Leighl NB, Wu YL, Zhong WZ. Emerging therapies for non-small cell lung cancer. J Hematol Oncol. 2019; 12:45. https://doi.org/10.1186/s13045-019-0731-8 [PubMed]
- 5. Warth A. [Diagnosis, prognosis, and prediction of non-small cell lung cancer. Importance of morphology, immunohistochemistry and molecular pathology]. Pathologe. 2015 (Suppl 2); 36:194–200. https://doi.org/10.1007/s00292-015-0085-0 [PubMed]
- 6. Sudhindra A, Ochoa R, Santos ES. Biomarkers, prediction, and prognosis in non-small-cell lung cancer: a platform for personalized treatment. Clin Lung Cancer. 2011; 12:360–68. https://doi.org/10.1016/j.cllc.2011.02.003 [PubMed]
- 7. Inoue A, Nukiwa T. Gene mutations in lung cancer: promising predictive factors for the success of molecular therapy. PLoS Med. 2005; 2:e13. https://doi.org/10.1371/journal.pmed.0020013 [PubMed]
- 8. Yu ZH, Chen M, Zhang QQ, Hu X. The association of Vitamin D receptor gene polymorphism with lung cancer risk: an update meta-analysis. Comb Chem High Throughput Screen. 2018; 21:704–10. https://doi.org/10.2174/1386207322666190125150557 [PubMed]
- 9. Wang N, Yang D, Ji B, Li J. Angiotensin-converting enzyme insertion/deletion gene polymorphism and lung cancer risk: a meta-analysis. J Renin Angiotensin Aldosterone Syst. 2015; 16:189–94. https://doi.org/10.1177/1470320314552310 [PubMed]
- 10. Feng X, Qin JJ, Zheng BS, Huang LL, Xie XY, Zhou HF. Association of epidermal growth factor receptor (EGFR) gene polymorphism with lung cancer risk: a systematic review. J Recept Signal Transduct Res. 2014; 34:333–34. https://doi.org/10.3109/10799893.2014.885052 [PubMed]
- 11. Konac E, Dogan I, Onen HI, Yurdakul AS, Ozturk C, Varol A, Ekmecki A. Genetic variations in the hypoxia-inducible factor-1alpha gene and lung cancer. Exp Biol Med (Maywood). 2009; 234:1109–16. https://doi.org/10.3181/0902-RM-49 [PubMed]
- 12. Kuo WH, Shih CM, Lin CW, Cheng WE, Chen SC, Chen W, Lee YL. Association of hypoxia inducible factor-1α polymorphisms with susceptibility to non-small-cell lung cancer. Transl Res. 2012; 159:42–50. https://doi.org/10.1016/j.trsl.2011.09.003 [PubMed]
- 13. Xu S, Ying K. Association between HIF-1α gene polymorphisms and lung cancer: a meta-analysis. Medicine (Baltimore). 2020; 99:e20610. https://doi.org/10.1097/MD.0000000000020610 [PubMed]
- 14. Wu F, Zhang J, Liu Y, Zheng Y, Hu N. HIF1α genetic variants and protein expressions determine the response to platinum based chemotherapy and clinical outcome in patients with advanced NSCLC. Cell Physiol Biochem. 2013; 32:1566–76. https://doi.org/10.1159/000356593 [PubMed]
- 15. Kim HO, Jo YH, Lee J, Lee SS, Yoon KS. The C1772T genetic polymorphism in human HIF-1alpha gene associates with expression of HIF-1alpha protein in breast cancer. Oncol Rep. 2008; 20:1181–87. [PubMed]
- 16. Lin S, Lai H, Qin Y, Chen J, Lin Y. Thymidine phosphorylase and hypoxia-inducible factor 1-α expression in clinical stage II/III rectal cancer: association with response to neoadjuvant chemoradiation therapy and prognosis. Int J Clin Exp Pathol. 2015; 8:10680–88. [PubMed]
- 17. Balamurugan K. HIF-1 at the crossroads of hypoxia, inflammation, and cancer. Int J Cancer. 2016; 138:1058–66. https://doi.org/10.1002/ijc.29519 [PubMed]
- 18. Gao ZJ, Wang Y, Yuan WD, Yuan JQ, Yuan K. HIF-2α not HIF-1α overexpression confers poor prognosis in non-small cell lung cancer. Tumour Biol. 2017; 39:1010428317709637. https://doi.org/10.1177/1010428317709637 [PubMed]
- 19. Fu SL, Miao J, Ding B, Wang XL, Cheng WJ, Dai HH, Han SP. A polymorphism in the 3’ untranslated region of hypoxia-inducible factor-1 alpha confers an increased risk of cervical cancer in a Chinese population. Neoplasma. 2014; 61:63–69. [PubMed]
- 20. Li HY, Zhou T, Lin W, Lin S, Zhong H. Association of hypoxia-inducible factor-1α (HIF1α) 1790G/A gene polymorphism with renal cell carcinoma and prostate cancer susceptibility: a meta-analysis. BMC Med Genet. 2019; 20:141. https://doi.org/10.1186/s12881-019-0874-z [PubMed]
- 21. Guo X, Li D, Chen Y, An J, Wang K, Xu Z, Chen Z, Xing J. SNP rs2057482 in HIF1A gene predicts clinical outcome of aggressive hepatocellular carcinoma patients after surgery. Sci Rep. 2015; 5:11846. https://doi.org/10.1038/srep11846 [PubMed]
- 22. Moeller BJ, Cao Y, Li CY, Dewhirst MW. Radiation activates HIF-1 to regulate vascular radiosensitivity in tumors: role of reoxygenation, free radicals, and stress granules. Cancer Cell. 2004; 5:429–41. https://doi.org/10.1016/s1535-6108(04)00115-1 [PubMed]
- 23. Kessler J, Hahnel A, Wichmann H, Rot S, Kappler M, Bache M, Vordermark D. HIF-1α inhibition by siRNA or chetomin in human Malignant glioma cells: effects on hypoxic radioresistance and monitoring via CA9 expression. BMC Cancer. 2010; 10:605. https://doi.org/10.1186/1471-2407-10-605 [PubMed]
- 24. Fujita M, Yasuda M, Kitatani K, Miyazawa M, Hirabayashi K, Takekoshi S, Iida T, Hirasawa T, Murakami M, Mikami M, Ishiwata I, Shimizu M, Osamura RY. An up-to-date anti-cancer treatment strategy focusing on HIF-1alpha suppression: its application for refractory ovarian cancer. Acta Histochem Cytochem. 2007; 40:139–42. https://doi.org/10.1267/ahc.07024 [PubMed]
- 25. Shen G, Li X, Jia YF, Piazza GA, Xi Y. Hypoxia-regulated microRNAs in human cancer. Acta Pharmacol Sin. 2013; 34:336–41. https://doi.org/10.1038/aps.2012.195 [PubMed]
- 26. Fan LF, Diao LM, Chen DJ, Liu MQ, Zhu LQ, Li HG, Tang ZJ, Xia D, Liu X, Chen HL. [Expression of HIF-1 alpha and its relationship to apoptosis and proliferation in lung cancer]. Ai Zheng. 2002; 21:254–58. [PubMed]
- 27. Huang Y, Wang Y, Wu C, Tian W. Elevated expression of hypoxia-inducible factor-2alpha regulated catabolic factors during intervertebral disc degeneration. Life Sci. 2019; 232:116565. https://doi.org/10.1016/j.lfs.2019.116565 [PubMed]
- 28. Jiang S, Wang R, Yan H, Jin L, Dou X, Chen D. MicroRNA-21 modulates radiation resistance through upregulation of hypoxia-inducible factor-1α-promoted glycolysis in non-small cell lung cancer cells. Mol Med Rep. 2016; 13:4101–07. https://doi.org/10.3892/mmr.2016.5010 [PubMed]
- 29. Inada M, Nishimura Y, Ishikawa K, Nakamatsu K, Wada Y, Uehara T, Fukuda K, Anami S, Doi H, Kanamori S. Comparing the 7th and 8th editions of the American joint committee on cancer/union for International cancer control TNM staging system for esophageal squamous cell carcinoma treated by definitive radiotherapy. Esophagus. 2019; 16:371–76. https://doi.org/10.1007/s10388-019-00675-y [PubMed]
- 30. Song J, Zhang H, Zhou H, Li T, Deng Y. [Association between polymorphism of ATP2B1 gene, its interaction with smoking and essential hypertension -a case-control study]. Zhonghua Liu Xing Bing Xue Za Zhi. 2014; 35:588–92. [PubMed]
- 31. Wang Y, Xue H, Sun M, Zhu X, Zhao L, Yang Y. Prevention and control of obesity in China. Lancet Glob Health. 2019; 7:e1166–67. https://doi.org/10.1016/S2214-109X(19)30276-1 [PubMed]
- 32. Luo H, Ren X, Li J, Wu K, Wang Y, Chen Q, Li N. Association between obesity status and successful aging among older people in China: evidence from CHARLS. BMC Public Health. 2020; 20:767. https://doi.org/10.1186/s12889-020-08899-9 [PubMed]
- 33. Li Z, Li N, Shen L. MAP2K6 is associated with radiation resistance and adverse prognosis for locally advanced nasopharyngeal carcinoma patients. Cancer Manag Res. 2018; 10:6905–12. https://doi.org/10.2147/CMAR.S184689 [PubMed]