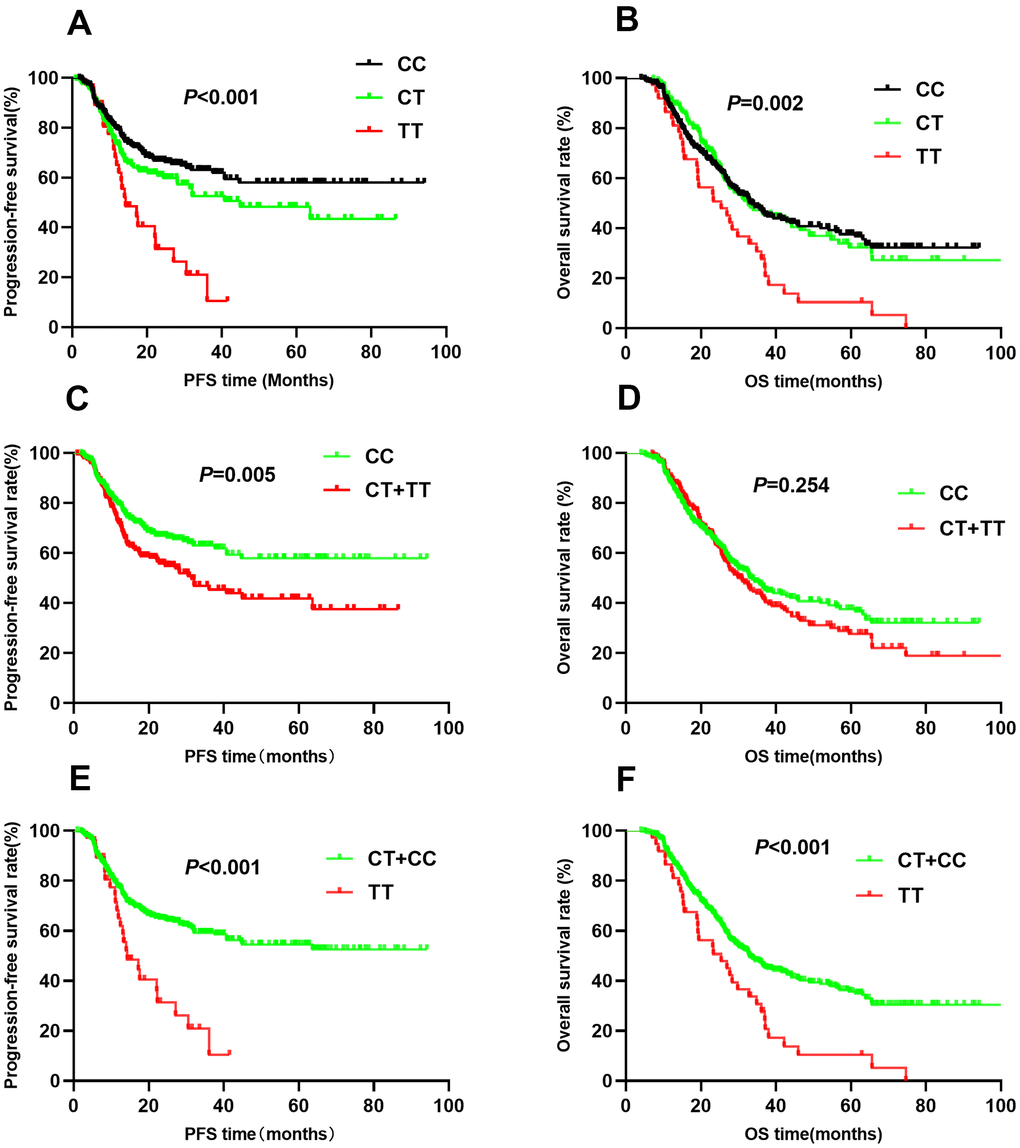
Figure 3.Kaplan-Meier survival curve analysis showing progression-free survival ((A) CC vs CT vs TT, (C) CT+TT vs CC, (E) TT vs CT+CC) and overall survival ((B) CC vs CT vs TT, (D) CT+TT vs CC, (F) TT vs CT+CC) of NSCLC patients with HIF1-alpha rs2057482.