


Introduction
Lumican (LUM) is a member of the small leucine-rich proteoglycan (SLRP) family, which is a component of the extracellular matrix. [1]. Its central region contains 10 leucine-rich repeats, which is one of the characteristics of the keratan sulfate subfamily [2]. LUM is associated with corneal disease and high myopia [3–11], cardiovascular disease [12–14], bone disease [15–18], polycystic ovary syndrome [19], and systemic lupus erythematosus [20]. There have been recent reports associating LUM with cancer. LUM may behave as an oncogene or tumor suppressor gene in several types of cancer, depending on the cellular context. For example, several studies demonstrated that high LUM expression is related to the unfavorable prognosis of breast cancer and pancreatic carcinoma [21, 22]. Further studies investigated the role of LUM in promoting epithelial-to-mesenchymal transition (EMT) in breast cancer [23, 24], and the depletion of LUM inhibited the proliferation and migration of bladder cancer cells by inactivating MAPK signaling [25]. High LUM expression was observed in drug-resistant ovarian cancer cell lines, suggesting its role in drug resistance [26]. Several experiments have shown that an increase of lumican expression in melanoma will reduce its growth and invasion [27]. Another study on melanoma showed that lumican was expressed in metastatic melanoma cells rather than normal melanocytes [28]. More recently, several studies confirmed that lumican was synthesized by dermal fibroblasts in malignant melanoma, and the decreased expression of lumican at the tumor margin may promote the proliferation of melanoma cells [29].
Colorectal cancer (CRC) is the third leading cause of global cancer mortality and is a serious threat to human health. According to the American Joint Committee on Cancer (AJCC), the five-year survival rate is almost 65% in Australia, Canada, the USA, and several European countries, but has remained < 50% in Asian and African countries [30–32]. Colorectal adenocarcinoma (COAD) accounts for more than 90% of CRC and is the predominant pathological type [33]. Over the past several years, only a few studies have focused on LUM in colon cancer. Immunohistochemistry studies showed that LUM was strongly expressed in colon cancer tumor cells, adjacent fibroblasts, and epithelial cells [34]. LUM expression had an unfavorable prognostic effect in patients with nodal metastasis [35]. LUM also increased during colorectal adenoma-to-carcinoma progression [36]. Functional experiments in vitro confirmed that LUM could enhance the migration of colon cancer cells [37]. However, the role of LUM in the COAD tumor microenvironment remains unclear.
In this study, we found that LUM expression was an independent negative prognostic factor of COAD by COX regression analysis. Furthermore, we studied the co-expression network of LUM and found that LUM could promote tumor metastasis and invasion. Through analysis of the immune microenvironment in the Tumor Immune Estimation Resource (TIMER) website, we found that LUM may prompt tumor immune escape. These results suggest that LUM is a potential novel target for COAD prognosis and treatment.
Results
Elevated LUM expression in COAD
We initially evaluated LUM transcription in different databases to gain a relatively reliable result. According to the results of the Oncomine database, the mRNA expression of LUM was significantly higher in COAD tissues than in adjacent normal tissues for several studies (Figure 1A). The UALCAN database showed a similar result (Figure 1B). We also investigated whether LUM expression was correlated with different clinico-pathological characteristics. We found that LUM expression was higher in mucinous adenocarcinoma than in adenocarcinoma (P value < 0.05, Figure 1C). Our analysis of the UALCAN database indicated that LUM was downregulated for the 61-80 years age group, and upregulated in the 21-40 years and 81-100 years age groups compared to the 41-60 years age group (P < 0.05, Figure 1D). There was no statistically significant correlation between other clinical parameters (race, sex, weight, and lymph node metastasis status) and LUM expression in COAD patients (Supplementary Figure 1). As for the cancer stages, although LUM expression was higher in stage 3 compared to the stage 1 of COAD in the UALCAN database (P < 0.05), there was no significant difference in LUM expression between the different pathological stages of COAD in the GEPIA website (Supplementary Figure 2).
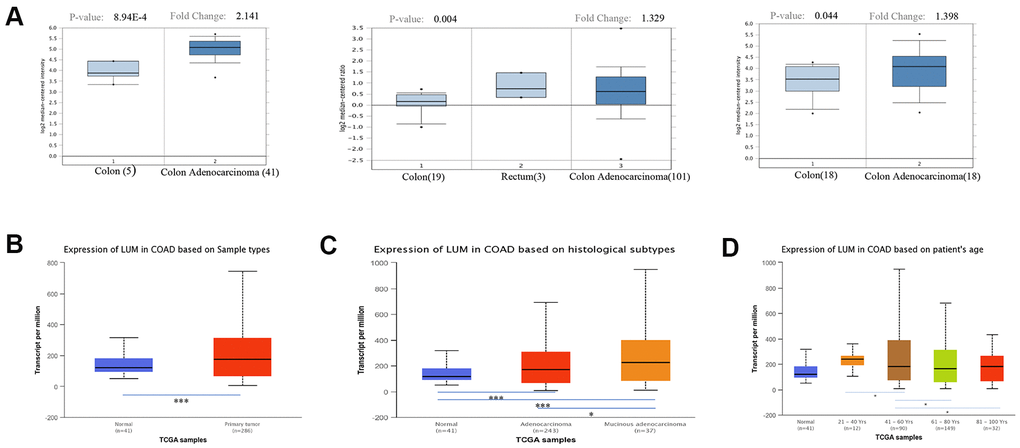
Figure 1. Expression of LUM in cancer and paracancerous tissues of COAD in the Oncomine and UALCAN databases. (A) mRNA expression of LUM in cancer tissues and paracancerous tissues in different microchips from the Oncomine database. Expression of LUM in (B) cancerous and paracancerous tissues, (C) cancer subtypes, and (D) by patient age. *P < 0.05, **P < 0.01, ***P < 0.001.
The prognosis model of COAD
We then used the Prognoscan website to obtain cohorts of COAD patients from the Gene Expression Omnibus (GEO) database (Supplementary Table 1). We excluded the cohorts with a small sample size or incomplete clinical information, and screened out a cohort (GSE17536). Baseline characteristics (age, sex, stage, grade, overall and disease-specific survival times) of 177 COAD patients are shown in Table 1. There were five cases with missing values. We performed a survival analysis using the Kaplan-Meier method and univariate COX regression based on LUM expression. Generally, high LUM expression was associated with poor overall survival (OS) (log-rank test, P = 0.024; univariate COX regression, P = 0.022) and disease-specific survival (DSS, log-rank test, P = 0.004; univariate COX regression, P = 0.003, Figure 2A, 2B). Besides LUM, other clinicopathologic characteristics such as age, gender, stage, and grade were independent but complementary prognostic factors. Moreover, multivariate analysis using the Cox proportional hazards model was performed to confirm the prognostic value of LUM mRNA expression. Prognostic factors after the univariate analysis were forwarded into the subsequent multivariate analysis and the five factors: LUM, age, gender, stage, and grade were included (Supplementary Table 2). Finally, three variables were included in the multivariate COX analysis. Only the LUM (HR = 1.887, 95% confidence interval (CI) [1.062–3.351], P = 0.030), age (HR = 1.025, 95% CI [1.005–1.046], P = 0.015), and stage (HR = 3.183, 95% CI [2.292–4.421], P-value < 0.001) were significantly associated with prognosis in multivariate analysis (Tables 2–3). These results indicate that LUM mRNA expression is an independent prognostic factor and increased LUM mRNA levels were associated with poor OS.
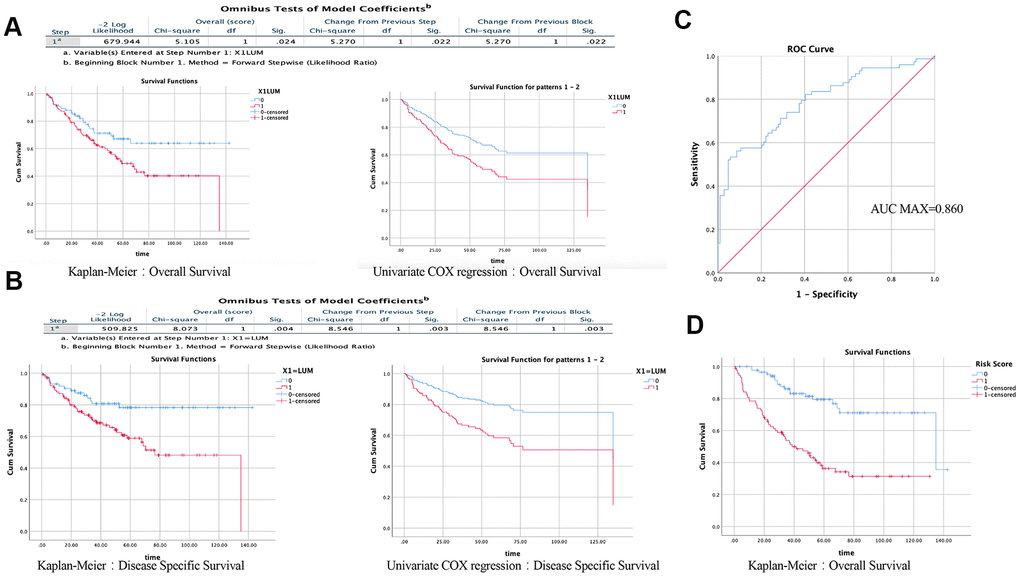
Figure 2. Results of univariate and multivariate COX regression analysis in SPSS (GSE17536). Effect of LUM on the prognosis of OS (A) and DSS (B) using the KM method and Univariate COX regression. (C) ROC analysis of the sensitivity and specificity of the risk score in predicting overall survival. (D) Effect of risk score on the prognosis of OS using the KM method.
Table 1. Clinical parameter of GSE17536.
| Stage | I | II | III | IV | |||||||||||||||||||||||||||||||||||||||||||||||||||||||||||||||||||||||||||||||||||||||||||||||
| N | 24 | 57 | 57 | 39 | |||||||||||||||||||||||||||||||||||||||||||||||||||||||||||||||||||||||||||||||||||||||||||||||
| Grade | 1 | 2 | 3 | ||||||||||||||||||||||||||||||||||||||||||||||||||||||||||||||||||||||||||||||||||||||||||||||||
| N | 16 | 134 | 27 | ||||||||||||||||||||||||||||||||||||||||||||||||||||||||||||||||||||||||||||||||||||||||||||||||
| Gender | 0 | 1 | |||||||||||||||||||||||||||||||||||||||||||||||||||||||||||||||||||||||||||||||||||||||||||||||||
| N | 81 | 96 | |||||||||||||||||||||||||||||||||||||||||||||||||||||||||||||||||||||||||||||||||||||||||||||||||
| Age | <65 | >=65 | |||||||||||||||||||||||||||||||||||||||||||||||||||||||||||||||||||||||||||||||||||||||||||||||||
| N | 78 | 99 | |||||||||||||||||||||||||||||||||||||||||||||||||||||||||||||||||||||||||||||||||||||||||||||||||
| OS-Status | 0 | 1 | |||||||||||||||||||||||||||||||||||||||||||||||||||||||||||||||||||||||||||||||||||||||||||||||||
| N | 104 | 73 | |||||||||||||||||||||||||||||||||||||||||||||||||||||||||||||||||||||||||||||||||||||||||||||||||
| DSS-Status | 0 | 1 | |||||||||||||||||||||||||||||||||||||||||||||||||||||||||||||||||||||||||||||||||||||||||||||||||
| N | 122 | 55 | |||||||||||||||||||||||||||||||||||||||||||||||||||||||||||||||||||||||||||||||||||||||||||||||||
| N=number; Age is divided into two groups according to the average; Status (0) = survival, status (1) = dead. | |||||||||||||||||||||||||||||||||||||||||||||||||||||||||||||||||||||||||||||||||||||||||||||||||||
Table 2. Results of multivariate regression analysis: results of variable analysis included in the model.
| Variables in the equation | |||||||||
| 95.0%CI for exp(B) | |||||||||
| B | SE | Wald | df | Sig. | Exp(B) | Lower | Upper | ||
| Step 1 | X4=Stage | 1.049 | 0.154 | 46.482 | 1 | 0.000 | 2.854 | 2.111 | 3.859 |
| Step 2 | X2=Age | 0.020 | 0.010 | 4.113 | 1 | 0.043 | 1.021 | 1.001 | 1.041 |
| X4=Stage | 1.097 | 0.155 | 49.917 | 1 | 0.000 | 2.996 | 2.210 | 4.062 | |
| Step3 | X1=LUM | 0.635 | 0.293 | 4.691 | 1 | 0.030 | 1.887 | 1.062 | 3.351 |
| X2=Age | 0.025 | 0.010 | 5.889 | 1 | 0.015 | 1.025 | 1.005 | 1.046 | |
| X4=Stage | 1.158 | 0.168 | 47.692 | 1 | 0.000 | 3.183 | 2.292 | 4.421 | |
Table 3. Results of multivariate regression analysis: results of omnibus tests about model coefficients.
| Omnibus tests of model coefficientsd | |||||||||||||||||||||||||||||||||||||||||||||||||||||||||||||||||||||||||||||||||||||||||||||||||||
| Overall (score) | Change from previous step | Change from previous block | |||||||||||||||||||||||||||||||||||||||||||||||||||||||||||||||||||||||||||||||||||||||||||||||||
| Step | -2Log Likelihood | Chi-square | df | Sig. | Chi-square | df | Sig. | Chi-square | df | Sig. | |||||||||||||||||||||||||||||||||||||||||||||||||||||||||||||||||||||||||||||||||||||||||
| 1a | 630.754 | 51.546 | 1 | 0.000 | 54.459 | 1 | 0.000 | 54.459 | 1 | 0.000 | |||||||||||||||||||||||||||||||||||||||||||||||||||||||||||||||||||||||||||||||||||||||||
| 2b | 626.462 | 56.197 | 2 | 0.000 | 4.292 | 1 | 0.038 | 58.751 | 2 | 0.000 | |||||||||||||||||||||||||||||||||||||||||||||||||||||||||||||||||||||||||||||||||||||||||
| 3c | 621.475 | 57.306 | 3 | 0.000 | 4.988 | 1 | 0.026 | 63.739 | 3 | 0.000 | |||||||||||||||||||||||||||||||||||||||||||||||||||||||||||||||||||||||||||||||||||||||||
| a. Variable(s) Entered at Step Number 1:X4=Stage. | |||||||||||||||||||||||||||||||||||||||||||||||||||||||||||||||||||||||||||||||||||||||||||||||||||
| b. Variable(s) Entered at Step Number 2:X2=Age. | |||||||||||||||||||||||||||||||||||||||||||||||||||||||||||||||||||||||||||||||||||||||||||||||||||
| c. Variable(s) Entered at Step Number 3:X1=LUM. | |||||||||||||||||||||||||||||||||||||||||||||||||||||||||||||||||||||||||||||||||||||||||||||||||||
| d. Beginning Block Number 1. Method =Forward Stepwise(Likedlihood Ratio). | |||||||||||||||||||||||||||||||||||||||||||||||||||||||||||||||||||||||||||||||||||||||||||||||||||
Therefore, to accurately evaluate the prognosis of COAD patients, a prognostic prediction model is needed. According to the results of the multivariate Cox regression analysis, the formula is: Risk Score = [mRNA level of LUM*0.635] + [age*0.02)] + [stage*1.158]. To assess the reliability of the formula established herein, the receiver operating characteristic (ROC) curve was generated, and the AUC was calculated (AUC = 0.790; AUC max = 0.860; P < 0.001, Figure 2C). The area under the ROC curve (i.e., overall ability of LUM to discriminate between controls and patients) was 0.790 (95% CI [0.721–0.860]; z test P < 0.001). The results showed that this formula could predict the prognosis of patients with COAD. To determine the performance of the Risk Score in predicting clinical outcomes, the Kaplan-Meier survival curve was plotted to analyze different survival times between high- and low-risk groups. The results showed that the prognosis of patients in the high-risk group was worse than that in the low-risk group (log rank P value < 0.001, Figure 2D). These findings indicate that the Risk Score based on LUM has potential for predicting COAD survival.
LUM co-expression networks in COAD
To further explore the LUM-related molecules functioning in COAD, we used the LinkedOmics database to analyze mRNA /miRNA sequencing and clinical data from 105 COAD patients in the clinical proteomic tumor analysis consortium (CPTAC) database. As shown in the volcano plot, there are 2,427 and 2,011 significant positive and negative correlation genes (red and green dots), respectively, with LUM by the LinkFinder module (false discovery rate (FDR) < 0.01, Figure 3A). The total genes co-expressed with LUM are shown in Supplementary Table 3. The first 50 significant genes with positive and negative correlation with LUM in COAD (FDR < 0.05) are shown in the heat map in Figure 3B. Significantly enriched GO annotations were analyzed by Gene set enrichment analysis (GSEA) in the linkInterpreter module. The genes associated with LUM were mainly located in biological processes that are involved with protein activation cascades, humoral immune response, cellular defense response, protein alkylation, RNA polyadenylation, and protein dealkylation (Figure 3C). The molecular function was involved in extracellular matrix (ECM) structural constituents, immunoglobulin binding, nucleotide receptor activity, demethylase activity, structural constituents of nuclear pores, and p53 binding (Figure 3C). KEGG pathway analysis revealed enrichment in immune response, cell adhesion pathways, and lysine degradation (Figure 3D). Thus, we analyzed the correlation between LUM and immune score, and found that there was a significant correlation between LUM and immunity (P < 0.001, Figure 4A).
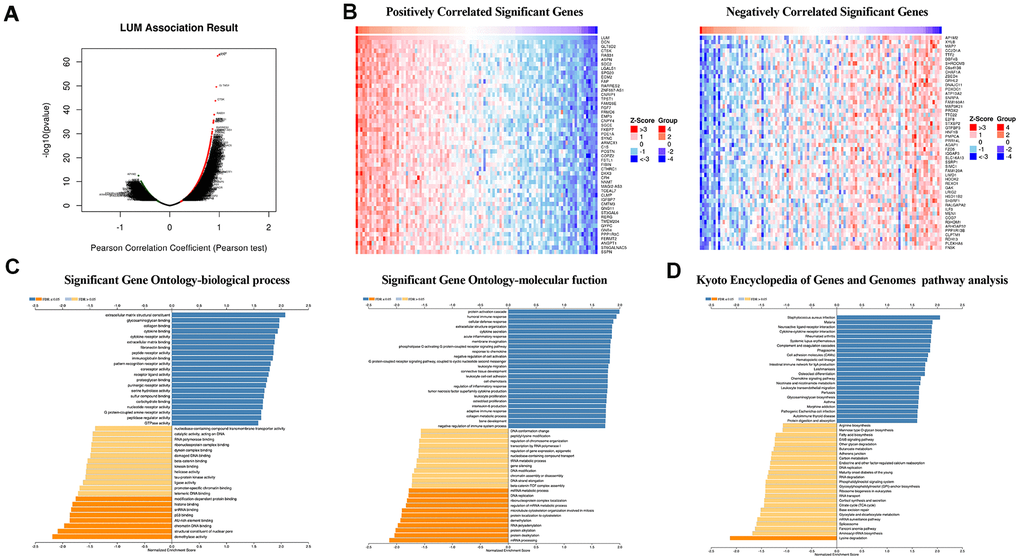
Figure 3. LUM co-expression networks in COAD (LinkedOmics). (A) Volcanic diagrams of positively and negatively correlated genes. (B) Heat map of positively and negatively correlated TOP50 genes. (C) GO and (D) KEGG pathway analysis of related genes.
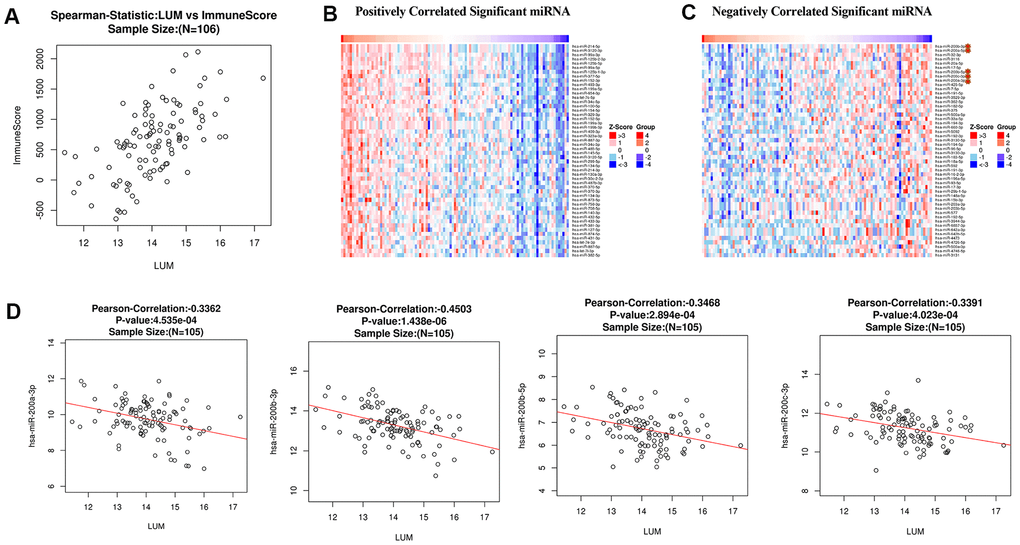
Figure 4. Analysis of LUM in COAD. (A) Analysis of the correlation between LUM and immunity (ImmuneScore = 0.6042, P < 0.001, and FDR = 1e-08). Heat map of miRNA (B) positively and (C) negatively related to LUM (TOP50). (D) Scatter diagram of the relationship between LUM and the miR200 Family.
MicroRNAs regulate gene expression at the post-transcriptional level by binding to mRNA and inducing translational repression. Many dysregulated miRNA in human cancer have carcinogenic or tumor suppressive activity [38–40]. To further build the co-expression networks, we analyzed the positively and negatively correlated miRNAs (TOP50) of LUM in COAD by LinkedOmics (Figure 4B, 4C). All relevant miRNAs are listed in Supplementary Table 4. Then, we analyzed the TOP10 miRNAs that were positively or negatively correlated with LUM. The miR125b family (including miR125b-2-3p, miR125b-5p, miR125b-1-3p) was positively correlated with LUM expression (Supplementary Figure 3). There are papers regarding miR125b in human colon cancer, but they play different roles for different situations [41, 42]. Therefore, we did no further analysis of it. The miR200 family (including miR200a-3p, miR200b-3p, miR200b-5p, miR200c-3p) was the most significantly negatively correlated miRNA family (Figure 4D). The miR200 family has a central role in EMT and potential for both prognostic and therapeutic management of CRC [43]. Therefore, we needed to further study the relationship between the miR200 family and LUM to explore the role of LUM in EMT.
LUM expression is correlated with immune infiltration level in COAD
Tumor-infiltrating lymphocytes are an independent predictor of sentinel lymph node status and cancer survival [44–46]. Therefore, we investigated whether LUM expression was correlated with immune infiltration levels in COAD. First, we evaluated the correlation between LUM expression and the level of COAD immune infiltration from the TIMER website. The analysis showed that LUM expression in COAD was positively correlated with the infiltration level of B cells (r = 0.122, P=0.0140), CD8+ T cells (r = 0.308, P < 0.001), CD4+ T cells (r = 0.314, P < 0.001), macrophages (r = 0.577, P < 0.001), neutrophils (r = 0.482, P < 0.001), and dendritic cells (DCs, r = 0.475, P < 0.001, Supplementary Figure 4). After purity correlation adjustments, the results revealed that LUM expression was significantly correlated with most immune marker sets of various immune and T cells. Moreover, we found that most of the marker sets of monocytes, tumor-associated macrophages (TAM), M2 macrophages, and DC markers were strongly correlated with the LUM expression in COAD. Table 4 shows that the expression of CCL-2 and IL10 in TAMs [47], CD86 and CD115 in monocytes, HLA-DPB1, BDCA-1, BDCA-4, and CD11c in DCs [41]; CD163, VSIG4, and MS4A4A in M2 macrophages [42–44]; and CCR8, TGFB1, and STAT5B in regulatory T cells (Treg) [48, 49] are significantly correlated with LUM in COAD (P < 0.001). We further analyzed the correlation between LUM expression and the above markers in the GEPIA database. We found that there was a significant correlation between LUM and the expression of these immune infiltrating cell markers in COAD (Figure 5), such as HLA-DPB1,BDCA-1, BDCA-4, and CD11c. These results suggest that LUM regulates macrophage polarization in COAD. In addition to Treg cells, LUM was positively correlated with FOXP3, CCR8, and TGFB1 in COAD. FOXP3 plays an critical role in Treg cells, allowing acquisition of full suppressive function and stability for the Treg lineage, thus inhibiting cytotoxic T cells attacks on tumor cells [50]. DCs can promote tumor metastasis by increasing the cytotoxicity of Treg cells while reducing the cytotoxicity of CD8+ T cells [32]. There was also a significant correlation between LUM and T cell depletion genes, such as PD-1, CTLA4, LAG3, and TIM-3 in COAD (Table 4). These results indicate that the high LUM expression plays a crucial role in T cell depletion. Recently, TAMs have been subdivided into subsets called C1QC + and SPP1+ by single cell sequencing [51]. We found that LUM is more related to SPP1+ than C1QC + TAMs (Figure 5F), implying that LUM may exert more effects on the SPP1+ subset. In summary, these results imply that LUM plays a crucial role in immune escape within the colon cancer microenvironment.
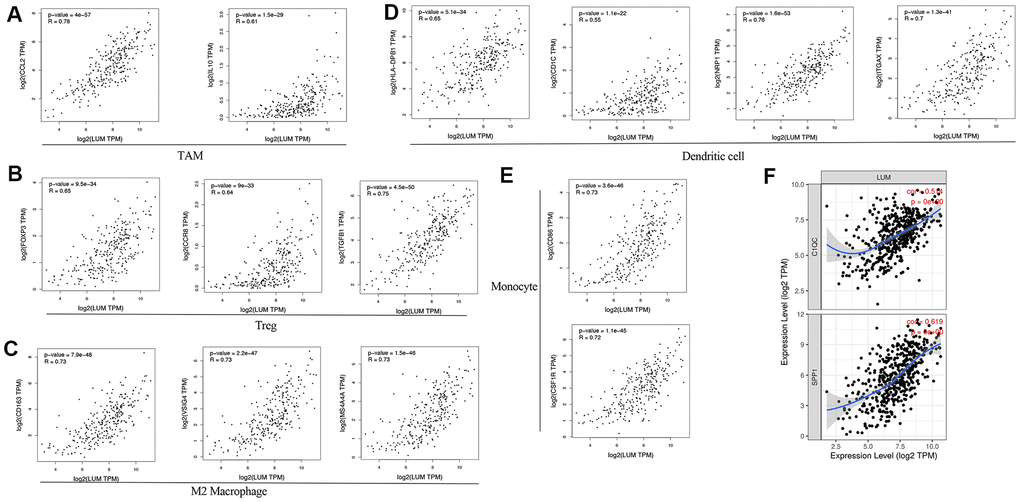
Figure 5. LUM expression correlated with macrophage polarization in COAD. Markers include (A) CCL2 and IL10 of TAMs (tumor-associated macrophages); (B) FOXP3, CCR8, and TGFB1 of Tregs; (C) CD163, VSIG4, and MS4A4A of M2 macrophages; (D) HLA-DPB1, CD1C, NRP1, and ITGAX of DCs; (E) CD86 and CSF1R of monocytes; (F) C1QC and SPP1 of TAM subtypes.
Table 4. Correlation analysis between LUM and relate genes and markers of immune cells in TIMER.
| Description | Gene markers | COAD | |||||||||||||||||||||||||||||||||||||||||||||||||||||||||||||||||||||||||||||||||||||||||||||||||
| None | Purity | ||||||||||||||||||||||||||||||||||||||||||||||||||||||||||||||||||||||||||||||||||||||||||||||||||
| cor | P | cor | P | ||||||||||||||||||||||||||||||||||||||||||||||||||||||||||||||||||||||||||||||||||||||||||||||||
| B cell | CD19 | 0.213 | *** | 0.107 | 3.12E-02 | ||||||||||||||||||||||||||||||||||||||||||||||||||||||||||||||||||||||||||||||||||||||||||||||
| CD79A | 0.335 | *** | 0.215 | *** | |||||||||||||||||||||||||||||||||||||||||||||||||||||||||||||||||||||||||||||||||||||||||||||||
| Tcell(general) | CD3D | 0.261 | *** | 0.142 | * | ||||||||||||||||||||||||||||||||||||||||||||||||||||||||||||||||||||||||||||||||||||||||||||||
| CD3E | 0.334 | *** | 0.22 | *** | |||||||||||||||||||||||||||||||||||||||||||||||||||||||||||||||||||||||||||||||||||||||||||||||
| CD2 | 0.381 | *** | 0.298 | *** | |||||||||||||||||||||||||||||||||||||||||||||||||||||||||||||||||||||||||||||||||||||||||||||||
| CD8+T cell | CD8A | 0.291 | *** | 0.18 | ** | ||||||||||||||||||||||||||||||||||||||||||||||||||||||||||||||||||||||||||||||||||||||||||||||
| CD8B | 0.167 | ** | 0.11 | 2.60E-02 | |||||||||||||||||||||||||||||||||||||||||||||||||||||||||||||||||||||||||||||||||||||||||||||||
| Monocyte | CD86 | 0.671 | *** | 0.63 | *** | ||||||||||||||||||||||||||||||||||||||||||||||||||||||||||||||||||||||||||||||||||||||||||||||
| CD115(CSF1R) | 0.567 | *** | 0.491 | *** | |||||||||||||||||||||||||||||||||||||||||||||||||||||||||||||||||||||||||||||||||||||||||||||||
| TAM | CCL2 | 0.736 | *** | 0.684 | *** | ||||||||||||||||||||||||||||||||||||||||||||||||||||||||||||||||||||||||||||||||||||||||||||||
| CD68 | 0.381 | *** | 0.315 | *** | |||||||||||||||||||||||||||||||||||||||||||||||||||||||||||||||||||||||||||||||||||||||||||||||
| IL10 | 0.523 | *** | 0.488 | *** | |||||||||||||||||||||||||||||||||||||||||||||||||||||||||||||||||||||||||||||||||||||||||||||||
| M1 Macrophage | INOS (NOS2) | -0.212 | *** | -0.26 | *** | ||||||||||||||||||||||||||||||||||||||||||||||||||||||||||||||||||||||||||||||||||||||||||||||
| IRF5 | 0.231 | *** | 0.232 | *** | |||||||||||||||||||||||||||||||||||||||||||||||||||||||||||||||||||||||||||||||||||||||||||||||
| COX2(PTGS2) | 0.291 | *** | 0.226 | *** | |||||||||||||||||||||||||||||||||||||||||||||||||||||||||||||||||||||||||||||||||||||||||||||||
| M2 Macrophage | CD163 | 0.636 | *** | 0.577 | *** | ||||||||||||||||||||||||||||||||||||||||||||||||||||||||||||||||||||||||||||||||||||||||||||||
| VSIG4 | 0.613 | *** | 0.552 | *** | |||||||||||||||||||||||||||||||||||||||||||||||||||||||||||||||||||||||||||||||||||||||||||||||
| MS4A4A | 0.638 | *** | 0.591 | *** | |||||||||||||||||||||||||||||||||||||||||||||||||||||||||||||||||||||||||||||||||||||||||||||||
| Neutrophils | CD66b (CEACAM8) | -0.156 | ** | -0.14 | * | ||||||||||||||||||||||||||||||||||||||||||||||||||||||||||||||||||||||||||||||||||||||||||||||
| CD11b (ITGAM) | 0.629 | *** | 0.571 | *** | |||||||||||||||||||||||||||||||||||||||||||||||||||||||||||||||||||||||||||||||||||||||||||||||
| CCR7 | 0.331 | *** | 0.22 | *** | |||||||||||||||||||||||||||||||||||||||||||||||||||||||||||||||||||||||||||||||||||||||||||||||
| Natural killer cell | KIR2DL4 | 0.1 | 3.33E-02 | 0.004 | 9.33E-01 | ||||||||||||||||||||||||||||||||||||||||||||||||||||||||||||||||||||||||||||||||||||||||||||||
| KIR2DL3 | 0.081 | 8.50E-02 | 0.03 | 5.43E-01 | |||||||||||||||||||||||||||||||||||||||||||||||||||||||||||||||||||||||||||||||||||||||||||||||
| KIR3DL3 | -0.026 | 5.80E-01 | -0.035 | 4.81E-01 | |||||||||||||||||||||||||||||||||||||||||||||||||||||||||||||||||||||||||||||||||||||||||||||||
| KIR3DL2 | 0.152 | * | 0.066 | 1.84E-01 | |||||||||||||||||||||||||||||||||||||||||||||||||||||||||||||||||||||||||||||||||||||||||||||||
| KIR2DS4 | 0.143 | * | 0.104 | 3.71E-02 | |||||||||||||||||||||||||||||||||||||||||||||||||||||||||||||||||||||||||||||||||||||||||||||||
| KIR2DL1 | 0.139 | * | 0.086 | 8.47E-02 | |||||||||||||||||||||||||||||||||||||||||||||||||||||||||||||||||||||||||||||||||||||||||||||||
| KIR3DL1 | 0.154 | ** | 0.092 | 6.48E-02 | |||||||||||||||||||||||||||||||||||||||||||||||||||||||||||||||||||||||||||||||||||||||||||||||
| Dendritic cell | HLA-DPB1 | 0.462 | *** | 0.375 | *** | ||||||||||||||||||||||||||||||||||||||||||||||||||||||||||||||||||||||||||||||||||||||||||||||
| HLA-DQB1 | 0.288 | *** | 0.199 | *** | |||||||||||||||||||||||||||||||||||||||||||||||||||||||||||||||||||||||||||||||||||||||||||||||
| HLA-DRA | 0.479 | *** | 0.395 | *** | |||||||||||||||||||||||||||||||||||||||||||||||||||||||||||||||||||||||||||||||||||||||||||||||
| HLA-DPA1 | 0.486 | *** | 0.403 | *** | |||||||||||||||||||||||||||||||||||||||||||||||||||||||||||||||||||||||||||||||||||||||||||||||
| BDCA-1(CD1C) | 0.448 | *** | 0.368 | *** | |||||||||||||||||||||||||||||||||||||||||||||||||||||||||||||||||||||||||||||||||||||||||||||||
| BDCA-4(NRP1) | 0.732 | *** | 0.698 | *** | |||||||||||||||||||||||||||||||||||||||||||||||||||||||||||||||||||||||||||||||||||||||||||||||
| CD11c (ITGAX) | 0.599 | *** | 0.54 | *** | |||||||||||||||||||||||||||||||||||||||||||||||||||||||||||||||||||||||||||||||||||||||||||||||
| Th1 | T-bet (TBX21) | 0.303 | *** | 0.220 | *** | ||||||||||||||||||||||||||||||||||||||||||||||||||||||||||||||||||||||||||||||||||||||||||||||
| STAT4 | 0.383 | *** | 0.299 | *** | |||||||||||||||||||||||||||||||||||||||||||||||||||||||||||||||||||||||||||||||||||||||||||||||
| STAT1 | 0.388 | *** | 0.339 | *** | |||||||||||||||||||||||||||||||||||||||||||||||||||||||||||||||||||||||||||||||||||||||||||||||
| IFN-γ (IFNG) | 0.203 | *** | 0.162 | 1.01E-02 | |||||||||||||||||||||||||||||||||||||||||||||||||||||||||||||||||||||||||||||||||||||||||||||||
| TNF-α (TNF) | 0.336 | *** | 0.288 | *** | |||||||||||||||||||||||||||||||||||||||||||||||||||||||||||||||||||||||||||||||||||||||||||||||
| Th2 | GATA3 | 0.375 | *** | 0.313 | *** | ||||||||||||||||||||||||||||||||||||||||||||||||||||||||||||||||||||||||||||||||||||||||||||||
| STAT6 | -0.229 | *** | -0.246 | *** | |||||||||||||||||||||||||||||||||||||||||||||||||||||||||||||||||||||||||||||||||||||||||||||||
| IL13 | 0.312 | *** | 0.245 | *** | |||||||||||||||||||||||||||||||||||||||||||||||||||||||||||||||||||||||||||||||||||||||||||||||
| STAT5A | 0.124 | * | 0.09 | 0.0714 | |||||||||||||||||||||||||||||||||||||||||||||||||||||||||||||||||||||||||||||||||||||||||||||||
| Tfh | BCL6 | 0.381 | *** | 0.296 | *** | ||||||||||||||||||||||||||||||||||||||||||||||||||||||||||||||||||||||||||||||||||||||||||||||
| IL21 | 0.229 | *** | 0.196 | *** | |||||||||||||||||||||||||||||||||||||||||||||||||||||||||||||||||||||||||||||||||||||||||||||||
| Th17 | STAT3 | 0.223 | *** | 0.161 | * | ||||||||||||||||||||||||||||||||||||||||||||||||||||||||||||||||||||||||||||||||||||||||||||||
| IL17A | -0.117 | 1.25E-02 | -0.127 | 1.02E-02 | |||||||||||||||||||||||||||||||||||||||||||||||||||||||||||||||||||||||||||||||||||||||||||||||
| Treg | FOXP3 | 0.494 | *** | 0.413 | *** | ||||||||||||||||||||||||||||||||||||||||||||||||||||||||||||||||||||||||||||||||||||||||||||||
| CCR8 | 0.548 | *** | 0.491 | *** | |||||||||||||||||||||||||||||||||||||||||||||||||||||||||||||||||||||||||||||||||||||||||||||||
| TGFβ (TGFB1) | 0.563 | *** | 0.488 | *** | |||||||||||||||||||||||||||||||||||||||||||||||||||||||||||||||||||||||||||||||||||||||||||||||
| STAT5B | 0.171 | ** | 0.182 | * | |||||||||||||||||||||||||||||||||||||||||||||||||||||||||||||||||||||||||||||||||||||||||||||||
| T cell exhaustion | PD-1 (PDCD1) | 0.261 | *** | 0.153 | * | ||||||||||||||||||||||||||||||||||||||||||||||||||||||||||||||||||||||||||||||||||||||||||||||
| CTLA4 | 0.382 | *** | 0.301 | *** | |||||||||||||||||||||||||||||||||||||||||||||||||||||||||||||||||||||||||||||||||||||||||||||||
| LAG3 | 0.243 | *** | 0.141 | * | |||||||||||||||||||||||||||||||||||||||||||||||||||||||||||||||||||||||||||||||||||||||||||||||
| TIM-3 (HAVCR2) | 0.667 | *** | 0.631 | *** | |||||||||||||||||||||||||||||||||||||||||||||||||||||||||||||||||||||||||||||||||||||||||||||||
| GZMB | 0.070 | 1.33E-01 | 0.046 | 3.55E-01 | |||||||||||||||||||||||||||||||||||||||||||||||||||||||||||||||||||||||||||||||||||||||||||||||
| P>0.05:gray color; P<0.05:*; P<0.01:**;P<0.001:***. | |||||||||||||||||||||||||||||||||||||||||||||||||||||||||||||||||||||||||||||||||||||||||||||||||||
LUM targets the miR200 family and its downstream signaling pathways
To further explore the targets of LUM in COAD, we found a significant negative correlation between the expression of miR200 family and LUM through LinkedOmics. There was a significant positive correlation between LUM and immunity (Figure 4). The scatter plot results show that the miR200 family had no significant relation with immunity in COAD (Figure 6). Therefore, it is not possible for miR200 to regulate signaling pathways upstream of LUM. According to the negative correlation between them, miR200 can be targeted for LUM. Thus, we detected the relationship between LUM and miR200's downstream genes. Previous studies had confirmed that the miR200 family regulated EMT to enhance tumor migration and invasion [43, 52, 53]. It has been demonstrated that the miR200 family suppresses EMT through the transcriptional repressors ZEB1 and ZEB2 [54, 55]. The miR200 family also affects cell proliferation by regulating RASSF2 expression, a negative regulator of KRAS, then subsequently enhancing the KRAS/MAPK/ERK signaling pathways [56–58]. Accordingly, we used the TIMER website to analyze the correlation between LUM and miR200's downstream genes, including ZEB1, ZEB2, RASSF2, and KRAS. ILK is a marker EMT signaling pathway activation in CRC [59]. We found that LUM had a strong positive correlation with ZEB1 (cor = 0.822, P < 0.001), ZEB2 (cor = 0.855, P = 0e+00), and RASSF2 (cor = 0.749, P = 0e+00, Figure 7A, 7B). There was a statistically significant positive correlation between KARS (cor = 0.29, P < 0.001), ILK (cor = 0.41, P = 0e+00), and LUM (Figure 7C, 7D). This result is consistent with the negative regulation of these genes by the miR200 family. Therefore, we inferred that LUM promotes tumor invasion and migration by targeting the miR200 family and regulating its downstream signaling pathways (Figure 7E).
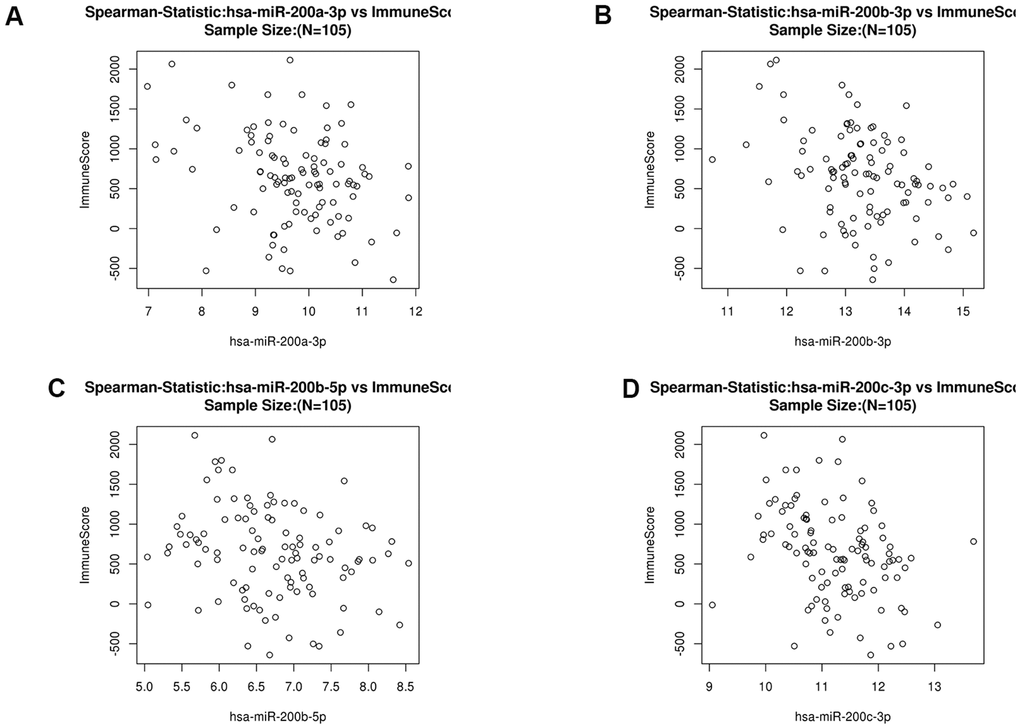
Figure 6. Scatter diagram of the relationship between immune score and the miR200 family (hsa-miR-200a-3p (A), hsa-miR200b-3p (B), hsa-miR200b-5p (C) and hsa-miR-200c-3p (D) in COAD.
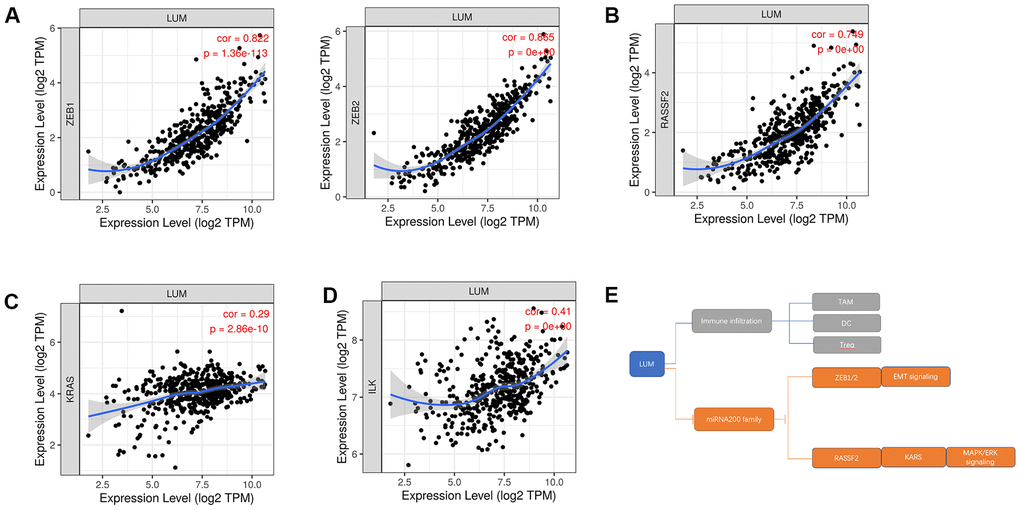
Figure 7. The relationship between LUM and downstream genes of the miR200 family in COAD. Scatter diagrams of the relationship between LUM and (A) ZEB1, ZEB2; (B) PASSF2; (C) KRAS; (D) ILK. (E) Pattern diagram of targeting the miR200 family and its downstream pathways for LUM.
Discussion
Although a few studies have maintained that LUM is associated with unfavorable colon cancer progression, its potential functions and regulatory network in COAD has not been analyzed. According to the TNM classification system of the AJCC and the International Union for Cancer Control (UICC), the prognosis of patients with resectable CRC depends on the histopathological criteria of tumor invasion and the characteristics of tumor cell differentiation [60, 61]. However, this system is useful but incomplete for prognostic information [62]. Therefore, a novel prognostic and predictive marker is required for COAD. In this study, we combined public database resources with different analysis methods to investigate LUM on survival, co-expression networks, and tumor-associated immunity.
From the Oncomine and UALCAN databases, we found that the expression of LUM in COAD was significantly higher than adjacent tissues. The results of Kaplan-Meier and COX univariate analysis revealed that high LUM expression had a worse prognosis in COAD. Then, LUM expression, age, and stage were used in the COX multivariate regression model to establish a predictive model for calculating the risk scores of COAD patients. The patients in the analyzed sample were divided into high- and low-risk groups, which was based on the risk scores. To assess the reliability and efficiency of risk score in terms of survival prediction, ROC curve analysis and KM plot analysis were performed. The results showed that the risk score could predict the prognosis of COAD patients. Thus, our research demonstrates that LUM expression is an independent negative prognostic biomarker in COAD patients.
To understand the role of LUM in the colon cancer microenvironment, we analyzed the co-expression network of LUM in the LinkedOmics website. Our results suggest that LUM is associated with immune infiltration and the miR200 family, thus providing a new possible target for COAD treatment. The results indicated that the function of LUM co-expression genes were enriched for immunity and cell adhesion by GO analysis. Through the LinkFinder module, there was a positive correlation between LUM and immune score, indicating that the function of LUM was related to immune cell infiltration and metastasis. Then, we used the TIMER website and found that LUM expression was positively correlated with different immune cell infiltration and markers (monocytes, TAMs, macrophages, DCs, and Treg cells). This suggests that LUM has a crucial role in evading immunity and metastasis by reducing the cytotoxicity of CD8+ T cells and increasing T cell depletion in COAD. LUM is an extracellular proteoglycan and a class II SLRP. Proteoglycans are one of the major ECM components and play a critical role in tissue homeostasis and immunity. Changes in proteoglycan expression in tumor cells and the tumor microenvironment is related to oncogenesis [63]. Cancer immunoediting consists of three stages: elimination (cancer immune surveillance), balance, and escape. Tumor ECM contributes to the development of an immunosuppressive network. ECM remodeling involves cytokines and chemokines that allow tumor immune escape. Tumor-extracellular matrix interactions and matrix remodeling are necessary for promoting a tumor immune response. Therefore, proteoglycans are attractive pharmacological targets in cancer [64, 65]. SLRP was initially associated with regulating the innate immune response, and triggering these responses can initiate tumorigenesis [66]. Therefore, high LUM expression may play a promoting role in tumorigenesis and immune escape of COAD, which could result in poor patient outcomes.
We also analyzed co-expression in LUM miRNAs and found that the most significant TOP10 negative correlation miRNA was the miR200 family members. We excluded the possibility of the miR200 family as upstream of LUM, rather, LUM could be upstream of the miR200 family. Then we explored the relationship between LUM and downstream of the miR200 family. The results showed that LUM was highly correlated with miRNA200/ZEB/EMT signaling pathways, indicating that LUM promotes EMT by targeting miRNA200. We also found that there is a significant correlation between LUM and the miRNA200/RASSF1/KARS/MAPK/ERK signaling pathway. The EMT and MAPK/ERK pathways are related to carcinogenesis and development of colon cancer. The miR200 family regulates EMT through the ZEB1/E-Cadherin signaling pathway. ZEB1 is a transcriptional repressor of the miR200 family. Therefore, it can be assumed that LUM activates ZEB1 to transcriptively inhibit expression of the miR200 family and regulate its downstream pathways. Previous studies revealed abnormal silencing of the miR200 family in tumors is caused by abnormal DNA methylation [67]. High expression of LUM can inhibit DNA demethylation activity by GO enrichment analysis. We speculate that LUM maintains the abnormal DNA methylation state of miR200 family by inhibiting DNA demethylation, thus silencing expression of the miR200 family. Therefore, LUM is crucial for evading immunity and is also related to the carcinogenic pathway. This makes LUM a target with great therapeutic potential.
At present, there are a variety of strategies for treating advanced COAD, but the outlook remains poor for most patients. In recent years, emerging immunomodulatory antibodies targeting PD-1, PD-L1, and CTLA-4 have rapidly been developed. However, the efficacy of using them for COAD remains controversial [68, 69]. Depleted immunosuppressant TAMs is another emerging therapy to promote anti-tumor immune response. There are two main kinds of blockers for CSF1R and CD40. When the CSF1R blocker is used alone, it could lead to the recruitment and proliferation of FOXP3+ Treg cells and macrophages, which has an effect on C1QC+TAM, but little effect on SPP1+TAM [70–73]. C1QC+TAM is related to inflammation while SPP1+TAM is related to metastasis and angiogenesis of CRC [51]. In our study, the expression of LUM was positively correlated with FOXP3+ Treg and promoted the polarization of macrophages. Moreover, in terms of the influence on the subtypes of TAM, LUM is more related to SPP1+TAM than C1QC+TAM. Therefore, LUM blockers could be used together with CSF1R blockers to make up for the defects of CSF1R blockers and improve the immune therapy effect. It is also well established that colon cancer occurrence is closely related to EMT. EMT is a dominant program in human colon cancer [74]. Our study results reveal that LUM may target the miR200 family to regulate the EMT pathway. Several studies confirmed that a selective ECM inhibitor can control tumor metastasis [75]. Thus, a LUM inhibitor could participate in immunotherapy and inhibit EMT at the same time. Unfortunately, there were no targeted drugs found for LUM in three drug target databases (DrugBank, Potential Drug Target Database, and Therapeutic Target Database). Previous preclinical studies, vaccines, CAR-T-NK cells, monoclonal antibodies, immunotoxin-targeted proteoglycans and their ligands, enzymes, receptors, and signal molecules have shown encouraging results in the synthesis, accumulation, and degradation of proteoglycans [64]. Therefore, these techniques can be used for LUM inhibitors. In the JASPAR website, we predicted that SP3 was bound to the GC box in the promoter region (Supplementary Figure 5). Grover et al. analyzed the promoter sequence of LUM and found that SP3 binded to the GC box in the promoter region to transcriptively activate LUM [76]. Mitramycin A (MTM-A) is an anti-tumor antibiotic and frequently used in clinical chemotherapeutic drugs. MTM-A preferentially binds to the GC-rich sequence in DNA, competitively blocks the binding of Sp TFs to the GC box in the gene promoter, and inhibits the transcription of Sp-regulated genes [77–80]. We speculate that MTM-A may be used as a targeting drug for LUM in the future. It could be used in combination with CSF1R blockers as an immunotherapy, and, simultaneously, as an inhibitor of EMT signaling pathways in cancer the miR200 family.
In conclusion, this study provides evidence for the crucial role of LUM in the prognosis and carcinogenesis of COAD. Our results suggest that LUM may be a novel target that can inhibit both immune escape and carcinogenic pathways. However, further experiments in vitro and in vivo should focus on the molecular mechanisms underlying the involvement of LUM in COAD.
Materials and Methods
Oncomine database analysis
Oncomine (https://www.oncomine.org/resource/login.html) is one of the largest oncogene chip databases and integrated data mining platforms in the world. It integrates GEO, TCGA, RNA, and DNA-SEQ data from published literature [81]. We used its online analysis tool to analyze the expression of LUM in COAD and paracancerous tissues in the tumor database.
UALCAN database analysis
UALCAN (http://ualcan.path.uab.edu) used TCGA Level 3 RNA-Seq and clinical data from 31 cancer types [82]. We used it to analyze the relative expression of LUM in tumor and normal samples and different tumor subgroups based on cancer stage, tumor grade, race, weight, or other clinicopathological features of COAD. A t-test was used to determine the statistical significance between different levels of LUM expression.
PrognoScan database analysis
PrognoScan (http://dna00.bio.kyutech.ac.jp/PrognoScan/index.html) has a large collection of publicly available cancer microarray data sets with clinical annotations [83]. We used it to find the gene chip of COAD. The sample quantity of GSE12945 and GSE17537 was less than 100, and GSE14333 lacked of overall survival information. Therefore, we excluded these datasets.
Establishment of a multivariate COX regression model
The gene expression dataset of primary colorectal tumors (GSE17536) was downloaded from the GEO database. IBM SPSS Statistics for Mac 26.0 software was used to process the data. We first averaged LUM expression, then divided it into two groups (cut-off value = 12.0869): high and low LUM expression, and then made the survival curve with the survival times of OS and DSS (Kaplan-Meier method and Univariate COX regression method). Then, the patient's clinical parameters (age, grade, stage, gender) was added, and the prognosis model was obtained by COX multivariate regression analysis (P < 0.05). Through the formula, we obtained the risk score value and patient survival to analyze the ROC curve and verify the prediction accuracy of the formula (AUC > 0.70). Then, according to the mean risk score, we divided the patients into high and low risk groups for Kaplan-Meier survival analysis (P < 0.05).
LinkedOmics website analysis
LinkedOmics database (http://www.linkedomics.org) contains multiple data sets and clinical data from 32 cancer types in 11,158 patients from the Cancer Genome Map (TCGA) project [84]. The LinkFinder module of LinkedOmics was used to study genes differentially expressed in correlation with LUM in the TCGA COAD cohort (n = 105). The results were analyzed statistically using Pearson’s correlation coefficient. We use the LinkFinder module to obtain volcanic maps, heat maps, and tables of genes and miRNA that are positively and negatively related to LUM (Pearson’s correlation). The scatter diagrams of gene and immune scores were also obtained (Non-parametric analysis; P < 0.001). We used the LinkInterpreter module to get the GSEA analysis of the co-expression network and the functional enrichment analysis of related genes and miRNAs. Minimum number of genes (Size = 3; Simulations = 1000; HDR < 0.05)
TIMER website analysis
TIMER pre-calculated the levels of six tumor-infiltrating immune subsets from 10,897 tumors from 32 cancer types to comprehensively study the molecular characteristics of tumor-immune interactions [85]. We used the gene module to see the correlation between genes and the level of immune infiltration. We used the correlation module to examine the correlation of different genes in COAD (Spearman correlation analysis). The partial Spearman correlation of tumor purity correction calculated the correlation between LUM expression and immune genes, and controlled the tumor purity.
GEPIA database analysis
GEPIA (http://gepia.cancer-pku.cn/index.html) is a website that provides fast and customizable functionality based on TCGA and GTEx data [86]. We used multiple gene analysis-correlation modules to examine the correlation of different genes in COAD and paracancerous tissues (Pearson correlation analysis).
Statistical analysis
The survival curve was derived from the Kaplan–Meier method; the log-rank test was used to compare the survival rate. A Cox proportional hazards model was used to calculate the adjusted hazard ratio (HR) with a 95% confidential interval (95% CI). The ROC curve and the area under ROC curve (ROC-AUC) were also calculated to evaluate the predictive ability of built model (AUC > 0.70).
Supplementary Materials
Author Contributions
L.Z. and Z.Y.Q. designed and performed the research, analyzed data, and wrote the manuscript; D.Q.P., L.Y., D.K.T., and W.R. participated in data preparation, analysis, and figure preparation. L.Z. and Z.Y.Q. analyzed the expression of LUM in various databases; Z.Y.Q. established the prognostic model and co-expression network of LUM; D.Q.P. and W.R. analyzed the relationship with immunity by TIMER; L.Y. and D.K.T. analyzed the relationship with MiR200 and its downstream by TIMER.All authors have read and approved the manuscript for publication.
Conflicts of Interest
The authors declare no potential conflicts of interest.
Funding
This work was supported by the Natural Science Foundation of Tianjin City, China (Grant No. 17JCYBJC25600) and Tianjin Research Innovation Project for Postgraduate Students (Grant No.2019YJSS191).
References
- 1. Grover J, Chen XN, Korenberg JR, Roughley PJ. The human lumican gene. Organization, chromosomal location, and expression in articular cartilage. J Biol Chem. 1995; 270:21942–9. https://doi.org/10.1074/jbc.270.37.21942 [PubMed]
- 2. Nikitovic D, Katonis P, Tsatsakis A, Karamanos NK, Tzanakakis GN. Lumican, a small leucine-rich proteoglycan. IUBMB Life. 2008; 60:818–23. https://doi.org/10.1002/iub.131 [PubMed]
- 3. Seomun Y, Joo CK. Lumican induces human corneal epithelial cell migration and integrin expression via ERK 1/2 signaling. Biochem Biophys Res Commun. 2008; 372:221–25. https://doi.org/10.1016/j.bbrc.2008.05.014 [PubMed]
- 4. Lin HJ, Kung YJ, Lin YJ, Sheu JJ, Chen BH, Lan YC, Lai CH, Hsu YA, Wan L, Tsai FJ. Association of the lumican gene functional 3'-UTR polymorphism with high myopia. Invest Ophthalmol Vis Sci. 2010; 51:96–102. https://doi.org/10.1167/iovs.09-3612 [PubMed]
- 5. Carlson EC, Lin M, Liu CY, Kao WW, Perez VL, Pearlman E. Keratocan and lumican regulate neutrophil infiltration and corneal clarity in lipopolysaccharide-induced keratitis by direct interaction with CXCL1. J Biol Chem. 2007; 282:35502–09. https://doi.org/10.1074/jbc.M705823200 [PubMed]
- 6. Guggenheim JA, Zayats T, Hammond C, Young TL. Lumican and muscarinic acetylcholine receptor 1 gene polymorphisms associated with high myopia. Eye (Lond). 2010; 24:1411–12. https://doi.org/10.1038/eye.2010.55 [PubMed]
- 7. Vij N, Roberts L, Joyce S, Chakravarti S. Lumican regulates corneal inflammatory responses by modulating Fas-Fas ligand signaling. Invest Ophthalmol Vis Sci. 2005; 46:88–95. https://doi.org/10.1167/iovs.04-0833 [PubMed]
- 8. Majava M, Bishop PN, Hägg P, Scott PG, Rice A, Inglehearn C, Hammond CJ, Spector TD, Ala-Kokko L, Männikkö M. Novel mutations in the small leucine-rich repeat protein/proteoglycan (SLRP) genes in high myopia. Hum Mutat. 2007; 28:336–44. https://doi.org/10.1002/humu.20444 [PubMed]
- 9. Lin HJ, Wan L, Tsai Y, Chen WC, Tsai SW, Tsai FJ. The association between lumican gene polymorphisms and high myopia. Eye (Lond). 2010; 24:1093–101. https://doi.org/10.1038/eye.2009.254 [PubMed]
- 10. Amjadi S, Mai K, McCluskey P, Wakefield D. The role of lumican in ocular disease. ISRN Ophthalmol. 2013; 2013:632302. https://doi.org/10.1155/2013/632302 [PubMed]
- 11. Liao X, Yang XB, Liao M, Lan CJ, Liu LQ. Association between lumican gene -1554 T/C polymorphism and high myopia in Asian population: a meta-analysis. Int J Ophthalmol. 2013; 6:696–701. https://doi.org/10.3980/j.issn.2222-3959.2013.05.28 [PubMed]
- 12. Onda M, Ishiwata T, Kawahara K, Wang R, Naito Z, Sugisaki Y. Expression of lumican in thickened intima and smooth muscle cells in human coronary atherosclerosis. Exp Mol Pathol. 2002; 72:142–49. https://doi.org/10.1006/exmp.2002.2425 [PubMed]
- 13. Gu G, Wan F, Xue Y, Cheng W, Zheng H, Zhao Y, Fan F, Han YI, Tong C, Yao C. Lumican as a novel potential clinical indicator for acute aortic dissection: a comparative study, based on multi-slice computed tomography angiography. Exp Ther Med. 2016; 11:923–28. https://doi.org/10.3892/etm.2016.3020 [PubMed]
- 14. Mohammadzadeh N, Lunde IG, Andenæs K, Strand ME, Aronsen JM, Skrbic B, Marstein HS, Bandlien C, Nygård S, Gorham J, Sjaastad I, Chakravarti S, Christensen G, et al. The extracellular matrix proteoglycan lumican improves survival and counteracts cardiac dilatation and failure in mice subjected to pressure overload. Sci Rep. 2019; 9:9206. https://doi.org/10.1038/s41598-019-45651-9 [PubMed]
- 15. Nahás-Scocate AC, de Moraes GF, Nader HB, Vicente CM, Toma L. Analysis of proteoglycan expression in human dental pulp. Arch Oral Biol. 2018; 90:67–73. https://doi.org/10.1016/j.archoralbio.2018.03.003 [PubMed]
- 16. Alimohamad H, Habijanac T, Larjava H, Häkkinen L. Colocalization of the collagen-binding proteoglycans decorin, biglycan, fibromodulin and lumican with different cells in human gingiva. J Periodontal Res. 2005; 40:73–86. https://doi.org/10.1111/j.1600-0765.2004.00776.x [PubMed]
- 17. Matheson S, Larjava H, Häkkinen L. Distinctive localization and function for lumican, fibromodulin and decorin to regulate collagen fibril organization in periodontal tissues. J Periodontal Res. 2005; 40:312–24. https://doi.org/10.1111/j.1600-0765.2005.00800.x [PubMed]
- 18. Barreto G, Senturk B, Colombo L, Brück O, Neidenbach P, Salzmann G, Zenobi-Wong M, Rottmar M. Lumican is upregulated in osteoarthritis and contributes to TLR4-induced pro-inflammatory activation of cartilage degradation and macrophage polarization. Osteoarthritis Cartilage. 2020; 28:92–101. https://doi.org/10.1016/j.joca.2019.10.011 [PubMed]
- 19. Simões RS, Soares JM
Jr , Simões MJ, Nader HB, Baracat MC, Maciel GA, Serafini PC, Azziz R, Baracat EC. Small leucine-rich proteoglycans (SLRPs) in the endometrium of polycystic ovary syndrome women: a pilot study. J Ovarian Res. 2017; 10:54. https://doi.org/10.1186/s13048-017-0349-9 [PubMed] - 20. Chang PC, Chen Y, Lai MT, Chang HY, Huang CM, Liu HP, Lin WY, Lai CH, Sheu JJ, Tsai FJ. Association analysis of polymorphisms in lumican gene and systemic lupus erythematosus in a Taiwan Chinese Han population. J Rheumatol. 2011; 38:2376–81. https://doi.org/10.3899/jrheum.101310 [PubMed]
- 21. Troup S, Njue C, Kliewer EV, Parisien M, Roskelley C, Chakravarti S, Roughley PJ, Murphy LC, Watson PH. Reduced expression of the small leucine-rich proteoglycans, lumican, and decorin is associated with poor outcome in node-negative invasive breast cancer. Clin Cancer Res. 2003; 9:207–14. [PubMed]
- 22. Ishiwata T, Cho K, Kawahara K, Yamamoto T, Fujiwara Y, Uchida E, Tajiri T, Naito Z. Role of lumican in cancer cells and adjacent stromal tissues in human pancreatic cancer. Oncol Rep. 2007; 18:537–43. [PubMed]
- 23. Kelemen LE, Couch FJ, Ahmed S, Dunning AM, Pharoah PD, Easton DF, Fredericksen ZS, Vierkant RA, Pankratz VS, Goode EL, Scott CG, Rider DN, Wang X, et al. Genetic variation in stromal proteins decorin and lumican with breast cancer: investigations in two case-control studies. Breast Cancer Res. 2008; 10:R98. https://doi.org/10.1186/bcr2201 [PubMed]
- 24. Karamanou K, Franchi M, Vynios D, Brézillon S. Epithelial-to-mesenchymal transition and invadopodia markers in breast cancer: lumican a key regulator. Semin Cancer Biol. 2020; 62:125–33. https://doi.org/10.1016/j.semcancer.2019.08.003 [PubMed]
- 25. Mao W, Luo M, Huang X, Wang Q, Fan J, Gao L, Zhang Y, Geng J. Knockdown of lumican inhibits proliferation and migration of bladder cancer. Transl Oncol. 2019; 12:1072–78. https://doi.org/10.1016/j.tranon.2019.05.014 [PubMed]
- 26. Klejewski A, Sterzyńska K, Wojtowicz K, Świerczewska M, Partyka M, Brązert M, Nowicki M, Zabel M, Januchowski R. The significance of lumican expression in ovarian cancer drug-resistant cell lines. Oncotarget. 2017; 8:74466–478. https://doi.org/10.18632/oncotarget.20169 [PubMed]
- 27. Vuillermoz B, Khoruzhenko A, D'Onofrio MF, Ramont L, Venteo L, Perreau C, Antonicelli F, Maquart FX, Wegrowski Y. The small leucine-rich proteoglycan lumican inhibits melanoma progression. Exp Cell Res. 2004; 296:294–306. https://doi.org/10.1016/j.yexcr.2004.02.005 [PubMed]
- 28. Sifaki M, Assouti M, Nikitovic D, Krasagakis K, Karamanos NK, Tzanakakis GN. Lumican, a small leucine-rich proteoglycan substituted with keratan sulfate chains is expressed and secreted by human melanoma cells and not normal melanocytes. IUBMB Life. 2006; 58:606–10. https://doi.org/10.1080/15216540600951605 [PubMed]
- 29. Brézillon S, Venteo L, Ramont L, D’Onofrio MF, Perreau C, Pluot M, Maquart FX, Wegrowski Y. Expression of lumican, a small leucine-rich proteoglycan with antitumour activity, in human malignant melanoma. Clin Exp Dermatol. 2007; 32:405–16. https://doi.org/10.1111/j.1365-2230.2007.02437.x [PubMed]
- 30. Siegel R, DeSantis C, Virgo K, Stein K, Mariotto A, Smith T, Cooper D, Gansler T, Lerro C, Fedewa S, Lin C, Leach C, Cannady RS, et al. Cancer treatment and survivorship statistics, 2012. CA Cancer J Clin. 2012; 62:220–41. https://doi.org/10.3322/caac.21149 [PubMed]
- 31. Sankaranarayanan R, Swaminathan R, Brenner H, Chen K, Chia KS, Chen JG, Law SC, Ahn YO, Xiang YB, Yeole BB, Shin HR, Shanta V, Woo ZH, et al. Cancer survival in Africa, Asia, and Central America: a population-based study. Lancet Oncol. 2010; 11:165–73. https://doi.org/10.1016/S1470-2045(09)70335-3 [PubMed]
- 32. Brenner H, Bouvier AM, Foschi R, Hackl M, Larsen IK, Lemmens V, Mangone L, Francisci S, and EUROCARE Working Group. Progress in colorectal cancer survival in Europe from the late 1980s to the early 21st century: the EUROCARE study. Int J Cancer. 2012; 131:1649–58. https://doi.org/10.1002/ijc.26192 [PubMed]
- 33. Siegel RL, Miller KD, Goding Sauer A, Fedewa SA, Butterly LF, Anderson JC, Cercek A, Smith RA, Jemal A. Colorectal cancer statistics, 2020. CA Cancer J Clin. 2020; 70:145–64. https://doi.org/10.3322/caac.21601 [PubMed]
- 34. Lu YP, Ishiwata T, Kawahara K, Watanabe M, Naito Z, Moriyama Y, Sugisaki Y, Asano G. Expression of lumican in human colorectal cancer cells. Pathol Int. 2002; 52:519–26. https://doi.org/10.1046/j.1440-1827.2002.01384.x [PubMed]
- 35. Seya T, Tanaka N, Shinji S, Yokoi K, Koizumi M, Teranishi N, Yamashita K, Tajiri T, Ishiwata T, Naito Z. Lumican expression in advanced colorectal cancer with nodal metastasis correlates with poor prognosis. Oncol Rep. 2006; 16:1225–30. [PubMed]
- 36. de Wit M, Carvalho B, Delis-van Diemen PM, van Alphen C, Beliën JA, Meijer GA, Fijneman RJ. Lumican and versican protein expression are associated with colorectal adenoma-to-carcinoma progression. PLoS One. 2017; 12:e0174768. https://doi.org/10.1371/journal.pone.0174768 [PubMed]
- 37. Radwanska A, Litwin M, Nowak D, Baczynska D, Wegrowski Y, Maquart FX, Malicka-Blaszkiewicz M. Overexpression of lumican affects the migration of human colon cancer cells through up-regulation of gelsolin and filamentous actin reorganization. Exp Cell Res. 2012; 318:2312–23. https://doi.org/10.1016/j.yexcr.2012.07.005 [PubMed]
- 38. Negrini M, Nicoloso MS, Calin GA. MicroRNAs and cancer—new paradigms in molecular oncology. Curr Opin Cell Biol. 2009; 21:470–79. https://doi.org/10.1016/j.ceb.2009.03.002 [PubMed]
- 39. Kim J, Yao F, Xiao Z, Sun Y, Ma L. MicroRNAs and metastasis: small RNAs play big roles. Cancer Metastasis Rev. 2018; 37:5–15. https://doi.org/10.1007/s10555-017-9712-y [PubMed]
- 40. Ding XM. MicroRNAs: regulators of cancer metastasis and epithelial-mesenchymal transition (EMT). Chin J Cancer. 2014; 33:140–47. https://doi.org/10.5732/cjc.013.10094 [PubMed]
- 41. Yang M, Tang X, Wang Z, Wu X, Tang D, Wang D. miR-125 inhibits colorectal cancer proliferation and invasion by targeting TAZ. Biosci Rep. 2019; 39:BSR20190193. https://doi.org/10.1042/BSR20190193 [PubMed]
- 42. Zhang X, Ma X, An H, Xu C, Cao W, Yuan W, Ma J. Upregulation of microRNA-125b by G-CSF promotes metastasis in colorectal cancer. Oncotarget. 2017; 8:50642–54. https://doi.org/10.18632/oncotarget.16892 [PubMed]
- 43. O’Brien SJ, Carter JV, Burton JF, Oxford BG, Schmidt MN, Hallion JC, Galandiuk S. The role of the miR-200 family in epithelial-mesenchymal transition in colorectal cancer: a systematic review. Int J Cancer. 2018; 142:2501–11. https://doi.org/10.1002/ijc.31282 [PubMed]
- 44. Dolcetti R, Viel A, Doglioni C, Russo A, Guidoboni M, Capozzi E, Vecchiato N, Macrì E, Fornasarig M, Boiocchi M. High prevalence of activated intraepithelial cytotoxic T lymphocytes and increased neoplastic cell apoptosis in colorectal carcinomas with microsatellite instability. Am J Pathol. 1999; 154:1805–13. https://doi.org/10.1016/S0002-9440(10)65436-3 [PubMed]
- 45. Schwitalle Y, Kloor M, Eiermann S, Linnebacher M, Kienle P, Knaebel HP, Tariverdian M, Benner A, von Knebel Doeberitz M. Immune response against frameshift-induced neopeptides in HNPCC patients and healthy HNPCC mutation carriers. Gastroenterology. 2008; 134:988–97. https://doi.org/10.1053/j.gastro.2008.01.015 [PubMed]
- 46. Shia J, Ellis NA, Paty PB, Nash GM, Qin J, Offit K, Zhang XM, Markowitz AJ, Nafa K, Guillem JG, Wong WD, Gerald WL, Klimstra DS. Value of histopathology in predicting microsatellite instability in hereditary nonpolyposis colorectal cancer and sporadic colorectal cancer. Am J Surg Pathol. 2003; 27:1407–17. https://doi.org/10.1097/00000478-200311000-00002 [PubMed]
- 47. Daurkin I, Eruslanov E, Stoffs T, Perrin GQ, Algood C, Gilbert SM, Rosser CJ, Su LM, Vieweg J, Kusmartsev S. Tumor-associated macrophages mediate immunosuppression in the renal cancer microenvironment by activating the 15-lipoxygenase-2 pathway. Cancer Res. 2011; 71:6400–09. https://doi.org/10.1158/0008-5472.CAN-11-1261 [PubMed]
- 48. Jenks JA, Seki S, Kanai T, Huang J, Morgan AA, Scalco RC, Nath R, Bucayu R, Wit JM, Al-Herz W, Ramadan D, Jorge AA, Bacchetta R, et al. Differentiating the roles of STAT5B and STAT5A in human CD4+ T cells. Clin Immunol. 2013; 148:227–36. https://doi.org/10.1016/j.clim.2013.04.014 [PubMed]
- 49. Barsheshet Y, Wildbaum G, Levy E, Vitenshtein A, Akinseye C, Griggs J, Lira SA, Karin N. CCR8+ FOXp3+ Treg cells as master drivers of immune regulation. Proc Natl Acad Sci USA. 2017; 114:6086–91. https://doi.org/10.1073/pnas.1621280114 [PubMed]
- 50. Georgiev P, Charbonnier LM, Chatila TA. Regulatory T Cells: the Many Faces of Foxp3. J Clin Immunol. 2019; 39:623–40. https://doi.org/10.1007/s10875-019-00684-7 [PubMed]
- 51. Zhang L, Li Z, Skrzypczynska KM, Fang Q, Zhang W, O’Brien SA, He Y, Wang L, Zhang Q, Kim A, Gao R, Orf J, Wang T, et al. Single-cell analyses inform mechanisms of myeloid-targeted therapies in cancer. Cell. 2020; 181:442–59.e29. https://doi.org/10.1016/j.cell.2020.03.048 [PubMed]
- 52. Paterson EL, Kazenwadel J, Bert AG, Khew-Goodall Y, Ruszkiewicz A, Goodall GJ. Down-regulation of the miRNA-200 family at the invasive front of colorectal cancers with degraded basement membrane indicates EMT is involved in cancer progression. Neoplasia. 2013; 15:180–91. https://doi.org/10.1593/neo.121828 [PubMed]
- 53. Hur K, Toiyama Y, Takahashi M, Balaguer F, Nagasaka T, Koike J, Hemmi H, Koi M, Boland CR, Goel A. MicroRNA-200c modulates epithelial-to-mesenchymal transition (EMT) in human colorectal cancer metastasis. Gut. 2013; 62:1315–26. https://doi.org/10.1136/gutjnl-2011-301846 [PubMed]
- 54. Korpal M, Lee ES, Hu G, Kang Y. The miR-200 family inhibits epithelial-mesenchymal transition and cancer cell migration by direct targeting of E-cadherin transcriptional repressors ZEB1 and ZEB2. J Biol Chem. 2008; 283:14910–14. https://doi.org/10.1074/jbc.C800074200 [PubMed]
- 55. Gregory PA, Bert AG, Paterson EL, Barry SC, Tsykin A, Farshid G, Vadas MA, Khew-Goodall Y, Goodall GJ. The miR-200 family and miR-205 regulate epithelial to mesenchymal transition by targeting ZEB1 and SIP1. Nat Cell Biol. 2008; 10:593–601. https://doi.org/10.1038/ncb1722 [PubMed]
- 56. Vos MD, Ellis CA, Elam C, Ulku AS, Taylor BJ, Clark GJ. RASSF2 is a novel K-Ras-specific effector and potential tumor suppressor. J Biol Chem. 2003; 278:28045–51. https://doi.org/10.1074/jbc.M300554200 [PubMed]
- 57. Akino K, Toyota M, Suzuki H, Mita H, Sasaki Y, Ohe-Toyota M, Issa JP, Hinoda Y, Imai K, Tokino T. The ras effector RASSF2 is a novel tumor-suppressor gene in human colorectal cancer. Gastroenterology. 2005; 129:156–69. https://doi.org/10.1053/j.gastro.2005.03.051 [PubMed]
- 58. Carter JV, O’Brien SJ, Burton JF, Oxford BG, Stephen V, Hallion J, Bishop C, Galbraith NJ, Eichenberger MR, Sarojini H, Hattab E, Galandiuk S. The microRNA-200 family acts as an oncogene in colorectal cancer by inhibiting the tumor suppressor RASSF2. Oncol Lett. 2019; 18:3994–4007. https://doi.org/10.3892/ol.2019.10753 [PubMed]
- 59. Tsoumas D, Nikou S, Giannopoulou E, Champeris Tsaniras S, Sirinian C, Maroulis I, Taraviras S, Zolota V, Kalofonos HP, Bravou V. ILK expression in colorectal cancer is associated with EMT, cancer stem cell markers and chemoresistance. Cancer Genomics Proteomics. 2018; 15:127–41. https://doi.org/10.21873/cgp.20071 [PubMed]
- 60. Greene FL, Sobin LH. A worldwide approach to the TNM staging system: collaborative efforts of the AJCC and UICC. J Surg Oncol. 2009; 99:269–27. https://doi.org/10.1002/jso.21237 [PubMed]
- 61. Weitz J, Koch M, Debus J, Höhler T, Galle PR, Büchler MW. Colorectal cancer. Lancet. 2005; 365:153–65. https://doi.org/10.1016/S0140-6736(05)17706-X [PubMed]
- 62. Galon J, Mlecnik B, Bindea G, Angell HK, Berger A, Lagorce C, Lugli A, Zlobec I, Hartmann A, Bifulco C, Nagtegaal ID, Palmqvist R, Masucci GV, et al. Towards the introduction of the ‘Immunoscore’ in the classification of malignant tumours. J Pathol. 2014; 232:199–209. https://doi.org/10.1002/path.4287 [PubMed]
- 63. Espinoza-Sánchez NA, Götte M. Role of cell surface proteoglycans in cancer immunotherapy. Semin Cancer Biol. 2020; 62:48–67. https://doi.org/10.1016/j.semcancer.2019.07.012 [PubMed]
- 64. Tzanakakis G, Neagu M, Tsatsakis A, Nikitovic D. Proteoglycans and immunobiology of cancer-therapeutic implications. Front Immunol. 2019; 10:875. https://doi.org/10.3389/fimmu.2019.00875 [PubMed]
- 65. Theocharis AD, Karamanos NK. Proteoglycans remodeling in cancer: underlying molecular mechanisms. Matrix Biol. 2019; 75–76:220–59. https://doi.org/10.1016/j.matbio.2017.10.008 [PubMed]
- 66. Neill T, Schaefer L, Iozzo RV. Decoding the matrix: instructive roles of proteoglycan receptors. Biochemistry. 2015; 54:4583–98. https://doi.org/10.1021/acs.biochem.5b00653 [PubMed]
- 67. Vrba L, Jensen TJ, Garbe JC, Heimark RL, Cress AE, Dickinson S, Stampfer MR, Futscher BW. Role for DNA methylation in the regulation of miR-200c and miR-141 expression in normal and cancer cells. PLoS One. 2010; 5:e8697. https://doi.org/10.1371/journal.pone.0008697 [PubMed]
- 68. Brahmer JR, Drake CG, Wollner I, Powderly JD, Picus J, Sharfman WH, Stankevich E, Pons A, Salay TM, McMiller TL, Gilson MM, Wang C, Selby M, et al. Phase I study of single-agent anti-programmed death-1 (MDX-1106) in refractory solid tumors: safety, clinical activity, pharmacodynamics, and immunologic correlates. J Clin Oncol. 2010; 28:3167–75. https://doi.org/10.1200/JCO.2009.26.7609 [PubMed]
- 69. Chung KY, Gore I, Fong L, Venook A, Beck SB, Dorazio P, Criscitiello PJ, Healey DI, Huang B, Gomez-Navarro J, Saltz LB. Phase II study of the anti-cytotoxic T-lymphocyte-associated antigen 4 monoclonal antibody, tremelimumab, in patients with refractory metastatic colorectal cancer. J Clin Oncol. 2010; 28:3485–90. https://doi.org/10.1200/JCO.2010.28.3994 [PubMed]
- 70. Kumar V, Donthireddy L, Marvel D, Condamine T, Wang F, Lavilla-Alonso S, Hashimoto A, Vonteddu P, Behera R, Goins MA, Mulligan C, Nam B, Hockstein N, et al. Cancer-associated fibroblasts neutralize the anti-tumor effect of CSF1 receptor blockade by inducing PMN-MDSC infiltration of tumors. Cancer Cell. 2017; 32:654–68.e5. https://doi.org/10.1016/j.ccell.2017.10.005 [PubMed]
- 71. Gyori D, Lim EL, Grant FM, Spensberger D, Roychoudhuri R, Shuttleworth SJ, Okkenhaug K, Stephens LR, Hawkins PT. Compensation between CSF1R+ macrophages and Foxp3+ treg cells drives resistance to tumor immunotherapy. JCI Insight. 2018; 3:e120631. https://doi.org/10.1172/jci.insight.120631 [PubMed]
- 72. Pradel LP, Ooi CH, Romagnoli S, Cannarile MA, Sade H, Rüttinger D, Ries CH. Macrophage susceptibility to emactuzumab (RG7155) treatment. Mol Cancer Ther. 2016; 15:3077–86. https://doi.org/10.1158/1535-7163.MCT-16-0157 [PubMed]
- 73. Neubert NJ, Schmittnaegel M, Bordry N, Nassiri S, Wald N, Martignier C, Tillé L, Homicsko K, Damsky W, Maby-El Hajjami H, Klaman I, Danenberg E, Ioannidou K, et al. T cell-induced CSF1 promotes melanoma resistance to PD1 blockade. Sci Transl Med. 2018; 10:eaan3311. https://doi.org/10.1126/scitranslmed.aan3311 [PubMed]
- 74. Loboda A, Nebozhyn MV, Watters JW, Buser CA, Shaw PM, Huang PS, Van’t Veer L, Tollenaar RA, Jackson DB, Agrawal D, Dai H, Yeatman TJ. EMT is the dominant program in human colon cancer. BMC Med Genomics. 2011; 4:9. https://doi.org/10.1186/1755-8794-4-9 [PubMed]
- 75. Harisi R, Jeney A. Extracellular matrix as target for antitumor therapy. Onco Targets Ther. 2015; 8:1387–98. https://doi.org/10.2147/OTT.S48883 [PubMed]
- 76. Grover J, Liu CY, Kao WW, Roughley PJ. Analysis of the human lumican gene promoter. J Biol Chem. 2000; 275:40967–73. https://doi.org/10.1074/jbc.M004134200 [PubMed]
- 77. Barceló F, Scotta C, Ortiz-Lombardía M, Méndez C, Salas JA, Portugal J. Entropically-driven binding of mithramycin in the minor groove of C/G-rich DNA sequences. Nucleic Acids Res. 2007; 35:2215–26. https://doi.org/10.1093/nar/gkm037 [PubMed]
- 78. Snyder RC, Ray R, Blume S, Miller DM. Mithramycin blocks transcriptional initiation of the c-myc P1 and P2 promoters. Biochemistry. 1991; 30:4290–97. https://doi.org/10.1021/bi00231a027 [PubMed]
- 79. Blume SW, Snyder RC, Ray R, Thomas S, Koller CA, Miller DM. Mithramycin inhibits SP1 binding and selectively inhibits transcriptional activity of the dihydrofolate reductase gene in vitro and in vivo. J Clin Invest. 1991; 88:1613–21. https://doi.org/10.1172/JCI115474 [PubMed]
- 80. Sastry M, Patel DJ. Solution structure of the mithramycin dimer-DNA complex. Biochemistry. 1993; 32:6588–604. https://doi.org/10.1021/bi00077a012 [PubMed]
- 81. Rhodes DR, Kalyana-Sundaram S, Mahavisno V, Varambally R, Yu J, Briggs BB, Barrette TR, Anstet MJ, Kincead-Beal C, Kulkarni P, Varambally S, Ghosh D, Chinnaiyan AM. Oncomine 3.0: genes, pathways, and networks in a collection of 18,000 cancer gene expression profiles. Neoplasia. 2007; 9:166–80. https://doi.org/10.1593/neo.07112 [PubMed]
- 82. Chandrashekar DS, Bashel B, Balasubramanya SA, Creighton CJ, Ponce-Rodriguez I, Chakravarthi BV, Varambally S. UALCAN: a portal for facilitating tumor subgroup gene expression and survival analyses. Neoplasia. 2017; 19:649–58. https://doi.org/10.1016/j.neo.2017.05.002 [PubMed]
- 83. Mizuno H, Kitada K, Nakai K, Sarai A. PrognoScan: a new database for meta-analysis of the prognostic value of genes. BMC Med Genomics. 2009; 2:18. https://doi.org/10.1186/1755-8794-2-18 [PubMed]
- 84. Vasaikar SV, Straub P, Wang J, Zhang B. LinkedOmics: analyzing multi-omics data within and across 32 cancer types. Nucleic Acids Res. 2018; 46:D956–63. https://doi.org/10.1093/nar/gkx1090 [PubMed]
- 85. Li T, Fan J, Wang B, Traugh N, Chen Q, Liu JS, Li B, Liu XS. TIMER: a web server for comprehensive analysis of tumor-infiltrating immune cells. Cancer Res. 2017; 77:e108–10. https://doi.org/10.1158/0008-5472.CAN-17-0307 [PubMed]
- 86. Tang Z, Li C, Kang B, Gao G, Li C, Zhang Z. GEPIA: a web server for cancer and normal gene expression profiling and interactive analyses. Nucleic Acids Res. 2017; 45:W98–102. https://doi.org/10.1093/nar/gkx247 [PubMed]