Submit an Article
Navigate
Home
Editorial Board
Editorial Policies
Current Volume
Archive
Scientific Integrity
Publication Ethics Statements
Interviews with Outstanding Authors
Newsroom
Sponsored Conferences
Podcast
Contact
Special Collections
Submit an Article
Online ISSN: 1945-4589
Research Paper
|
Volume 13, Issue 3
|
pp. 4388–4408
Lumican inhibits immune escape and carcinogenic pathways in colorectal adenocarcinoma
Back to article
Figure 6
(6 of 7)
−
100%
+
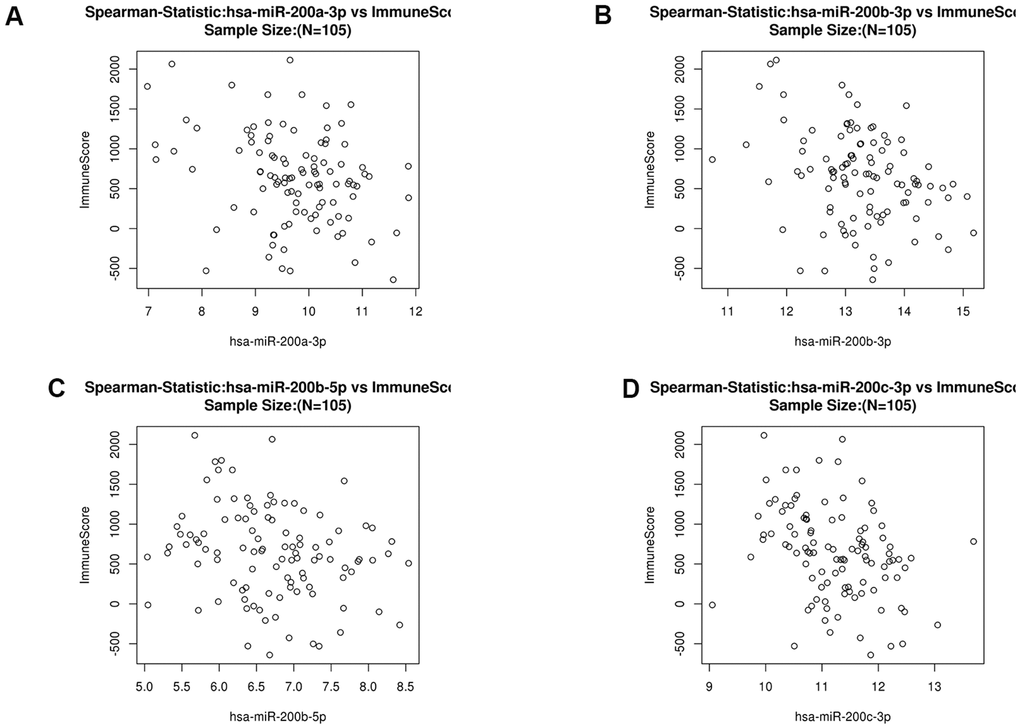
Figure 6.
Scatter diagram of the relationship between immune score and the miR200 family (hsa-miR-200a-3p (
A
), hsa-miR200b-3p (
B
), hsa-miR200b-5p (
C
) and hsa-miR-200c-3p (
D
) in COAD.