


Introduction
Gout is the most common form of inflammatory arthritis worldwide, and its prevalence increases with age [1]. Gout is associated with numerous comorbidities, such as increased low-density lipoprotein levels, elevated triglyceride levels, and altered glycosylated hemoglobin (HbA1c) levels [2, 3]. Despite increases in associated health and economic costs, gout remains a poorly controlled disease, and therapeutic choices are limited due to side effects or contraindications [4]. Novel drug targets and therapeutics that exhibit improved tolerability are therefore urgently needed.
Previous studies have shown that the development of gout consists of two steps: hyperuricemia-elicited monosodium urate crystal deposition and crystal-activated gouty inflammation [5–9]. In the first step, serum uric acid levels increase, resulting in a hyperuricemic state and thereby promoting crystal deposition. In the second step, monosodium urate crystals activate interleukin-1β (IL-1β) production, resulting in a gouty attack [5–9]. The following evidence indicates that distinct pathogenic mechanisms underlie these two steps: (a) most hyperuricemia patients do not develop gout even after decades [10], and (b) colchicine, which effectively reverses gouty inflammation, has no influence whatsoever on urate metabolism.
To date, much effort has been devoted to elucidating the mechanisms of hyperuricemia, and a multitude of associated proteins, such as ABCG2,SLC2A9, GCKR and SLC17A1, have been identified [9]. In contrast, relatively little is known regarding mechanisms underlying gouty inflammation, although increases in monocyte/macrophage-derived IL-1β induced by monosodium urate crystals play an important role [9]. However, anti-IL-1 therapies are associated with infectious complications [4, 11]. Targeting upstream gout-specific molecules in the IL-1 signaling cascade might reduce such side effects. However, the relationship between monosodium urate crystals and IL-1β levels remains poorly understood.
Studies have shown that gout’s heritability is approximately 30%, but sequence variants explain less than 10% of the risk of developing gout [12, 13]. Epigenetic modifications, which are also heritable and can account for parent-of-origin patterns of inheritance [14], may also be implicated in the heritability of gout. Furthermore, although specific environmental factors are known to increase the risk of gout [12], many more environmental factors can impact the epigenome, and these environmentally-induced epigenomic changes can exert long-term effects on disease phenotypes [15].
Interestingly, DNA methylation regulates cytokine expression and inflammation in macrophages, which are crucial in gouty inflammation [16–18]. DNA methylation might therefore act as a potential mechanism that links heritability, environmental factors, immune biology, and gout. Previous epigenome-wide association studies (EWAS) have demonstrated numerous associations between DNA methylation, inflammation, and disease development [19]. However, the extent to which DNA methylation influences gout and related genetic factors is not fully understood. Moreover, previous EWAS analysis methods couldn’t identify disease-associated genes at a cell-type-specific resolution, hindering further translational research [20]. However, computational model that is validated for cell-type-specific EWAS was recently developed [20]. Here, we employed this method to conduct an integrative analysis of cell lineage-specific methylome and genome alterations in gout. Our goal was to identify cell lineage-specific DNA methylation sites associated with gouty inflammation and their relationships to other genetic variants and clinical characteristics.
Results
Sixty-nine patients with gout and 1,455 non-gout controls underwent concurrent methylation profiling and whole genome sequencing and were included in cell lineage-specific methylation and cis-methylation quantitative trait loci (cis-meQTL)/genetic analyses. Gout patients were predominantly males (60 males, nine females) with a mean age of 52.58 ± 10.98 years and a mean uric acid level of 7.13 ± 1.96 mg/d, which are similar to the characteristics of gout patients in other studies [21] (Table 1).
Table 1. Characteristics of study participants.
| Characteristics | Participants with gout (n=69) | Participants without gout (n=1455) | |||||||||||||||||||||||||||||||||||||||||||||||||||||||||||||||||||||||||||||||||||||||||||||||||
| Age (years) | 52.58 ± 10.98 | 49.16 ± 11.15 | |||||||||||||||||||||||||||||||||||||||||||||||||||||||||||||||||||||||||||||||||||||||||||||||||
| Sex, male/female | 60/9 | 683/772 | |||||||||||||||||||||||||||||||||||||||||||||||||||||||||||||||||||||||||||||||||||||||||||||||||
| Uric acid (mg/dl) | 7.13 ± 1.96 | 5.53 ± 1.39 | |||||||||||||||||||||||||||||||||||||||||||||||||||||||||||||||||||||||||||||||||||||||||||||||||
| Hyperuricemia (uric acid >7 mg/dl) | NA | 207 (14.23%) | |||||||||||||||||||||||||||||||||||||||||||||||||||||||||||||||||||||||||||||||||||||||||||||||||
| Low density lipoprotein (mg/dl) | 124.96 ± 34.15 | 121.69 ± 32.35 | |||||||||||||||||||||||||||||||||||||||||||||||||||||||||||||||||||||||||||||||||||||||||||||||||
| Triglyceride (mg/dl) | 144.01 ±86.38 | 114.33 ± 95.45 | |||||||||||||||||||||||||||||||||||||||||||||||||||||||||||||||||||||||||||||||||||||||||||||||||
| HbA1c (%) | 5.96 ± 0.78 | 5.71 ± 0.73 | |||||||||||||||||||||||||||||||||||||||||||||||||||||||||||||||||||||||||||||||||||||||||||||||||
| The results were expressed as mean ± standard deviation. HbA1C: glycosylated hemoglobin. NA: not applicable. | |||||||||||||||||||||||||||||||||||||||||||||||||||||||||||||||||||||||||||||||||||||||||||||||||||
After quality control (Supplementary Figure 1, Step I), CellDMC analysis identified 1,763 cytosine-phosphate-guanine dinucleotide (CpG) sites across promoter (TSS200, TSS1500) [22], 5'UTR, gene body, 3'UTR, and intergenic regions exhibited differential methylation in monocytes, eosinophils, neutrophils, NK cells, B cells, CD4+ T cells, and CD8+ T cells in gout patients after correcting for sex, age, alcohol drinking, smoking status, smoking history (total pack-years), and cell fractions [20] (Supplementary Table 2).
To clarify whether different cell lineages displayed distinct differential methylation patterns, we examined the overlap of differential methylation between different cell lineages at the CpG site and gene levels (Supplementary Figure 1, Step IIa). There was little overlap (overlap rate < 0.5) [23] in differentially methylated CpG sites among different cell lineages (Supplementary Figure 2A). Similarly, little overlap in differential methylation at the gene level was observed (Supplementary Figure 2B). These results suggest that DNA methylome signatures are relatively unique in different cell lineages.
Epigenetic modifications were associated with IL-1 signaling in multiple cell lineages
To examine the functions of differentially methylated genes, we performed separate pathway enrichment analyses for monocytes, eosinophils, neutrophils, NK cells, B cells, CD4+ T cells, and CD8+ cells (Supplementary Figure 1, Step IIb; Figure 1). Genes related to IL-1 signaling pathways were enriched among the differentially methylated genes in multiple cellular subsets (Figure 1A, 1B, 1D, 1E). This might help account for the therapeutic efficacy of an IL-1β blocking agent in treating gout [4]. These results indicate that IL-1 regulation is a critical mechanism underlying gout despite differential methylation in different cell types; we therefore examined the impacts of this differential methylation on IL-1β expression.
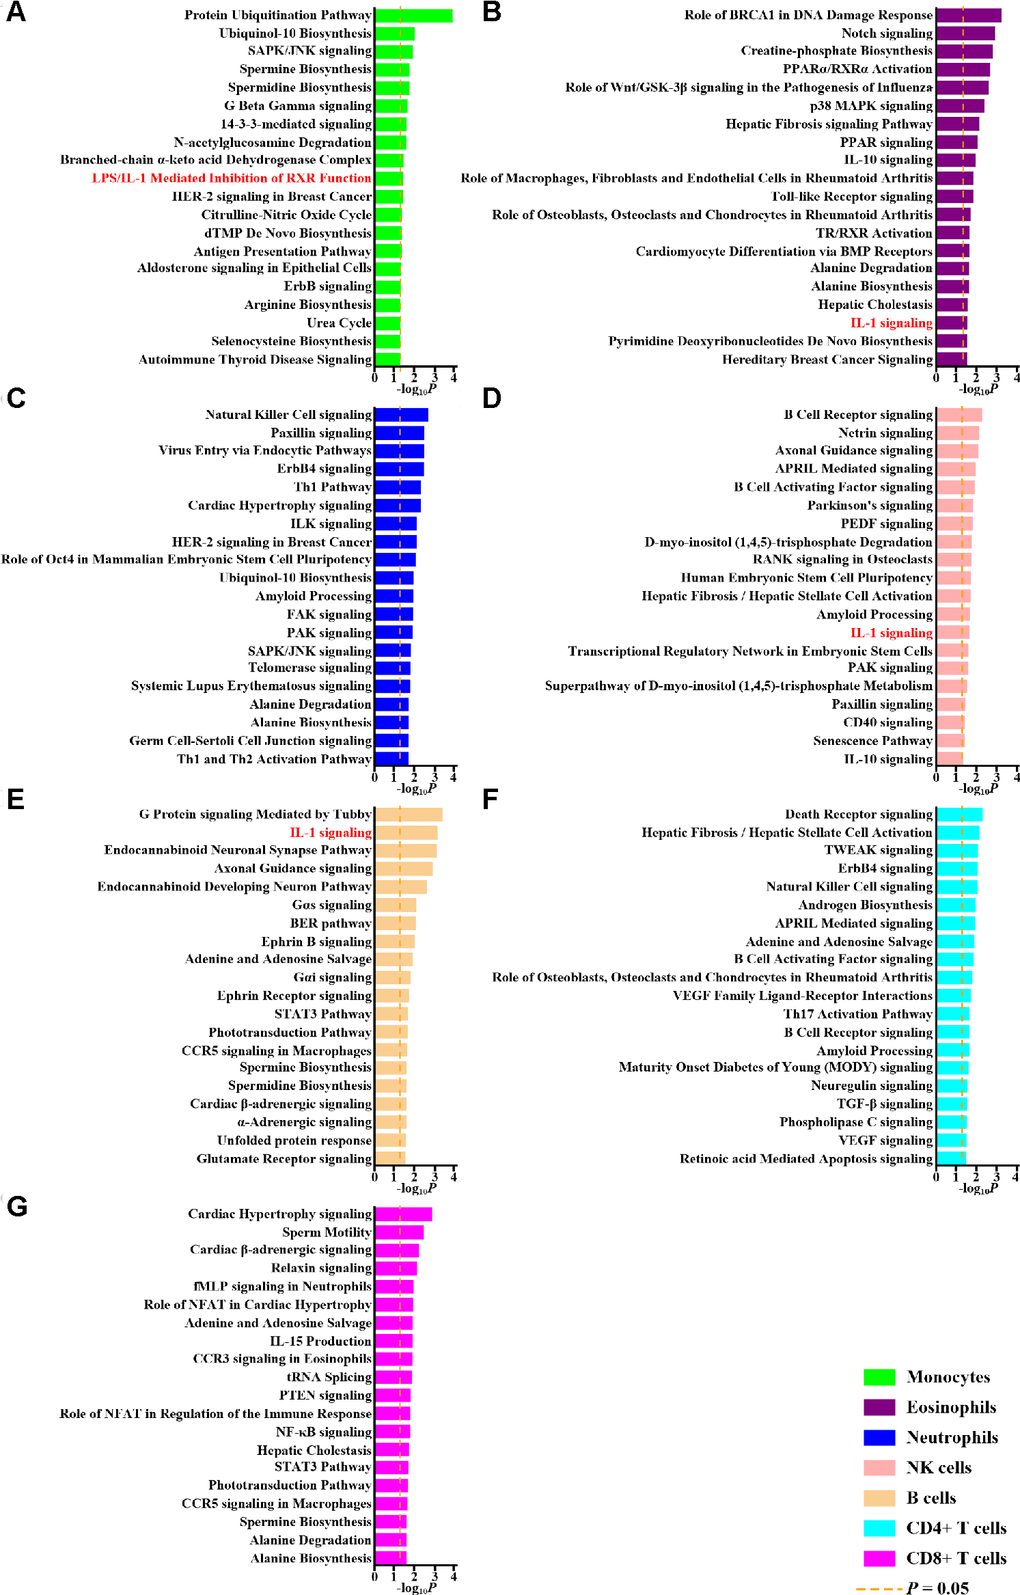
Figure 1. Pathway analysis of differentially methylated genes. The top 20 pathways of differentially methylated genes in monocytes (A), eosinophils (B), neutrophils (C), NK cells (D), B cells (E), CD4+ T cells (F) and CD8+ T cells (G) revealed by Ingenuity Pathway Analysis and corresponding P values are shown. The dashed orange lines represent P values of 0.05. Pathways related to interleukin-1 (IL-1) are highlighted with red.
Although the role of IL-1β in gout has already been established [9], mechanistic links between monosodium urate crystals and IL-1β production in gout have not been identified. We explored whether gout-associated differential methylation might be implicated in regulation of IL-1β. Previous work indicated that IL-1β is primarily produced by monocytes/macrophages in gout [24, 25]. Consistent with these reports, the protein-protein interaction network constructed with genes to which monocyte-specific CpG sites were mapped (Supplementary Figure 1, Step IIc) pinpointed several hub genes (those directly connected to many interacting partners, indicating higher importance) with well-established IL-1β regulatory functions (Supplementary Figure 3). We therefore focused on monocyte-specific differentially methylated CpG sites in genes known to increase or decrease IL-1β production (Supplementary Figure 1, Step IId). Of the 58 monocyte-specific differentially methylated CpG sites, 15 were located in genes previously found to affect IL-1β expression (Table 2, Supplementary Table 3) [26–37]; no evidence was found indicating that genes to which the remaining 43 CpG sites were mapped directly affect IL-1β expression (Supplementary Table 4).
Table 2. Surviving monocyte-specific methylation sites.
| CpG site | Δβa | P | FDR | Chr | Positionb | Gene (Alias) | Genomic featuresc | CpG features | Referencesd | ||||||||||||||||||||||||||||||||||||||||||||||||||||||||||||||||||||||||||||||||||||||||||
| Increases/decreases interleukin-1β (IL-1β) in monocyte/macrophage lineage cells | |||||||||||||||||||||||||||||||||||||||||||||||||||||||||||||||||||||||||||||||||||||||||||||||||||
| cg03795507 | -1.00 | 3.42×10⁻⁷ | 1.60×10⁻³ | 5 | 133340866 | VDAC1 | TSS200 | island | ↑IL-1β [26] | ||||||||||||||||||||||||||||||||||||||||||||||||||||||||||||||||||||||||||||||||||||||||||
| cg10257063 | -0.71 | 2.59×10⁻⁶ | 9.04×10⁻³ | 11 | 68587159 | CPT1A | 5'UTR | open sea | ↑ IL-1β [27] | ||||||||||||||||||||||||||||||||||||||||||||||||||||||||||||||||||||||||||||||||||||||||||
| cg16975613 | 1.00 | 2.66×10⁻¹² | 5.77×10⁻⁸ | 11 | 102217719 | BIRC2 (cIAP1) [28] | TSS1500 | island | ↓IL-1β [29] | ||||||||||||||||||||||||||||||||||||||||||||||||||||||||||||||||||||||||||||||||||||||||||
| cg17151991 | -0.52 | 1.42×10⁻⁶ | 5.38×10⁻³ | 19 | 1207421 | STK11 (LKB1) [30] | Body | island | ↓ IL-1β [30] | ||||||||||||||||||||||||||||||||||||||||||||||||||||||||||||||||||||||||||||||||||||||||||
| cg26375855 | 0.64 | 4.61×10⁻⁹ | 4.30×10⁻⁵ | 19 | 54299976 | NLRP12 | Body | open sea | ↑ IL-1β [31] | ||||||||||||||||||||||||||||||||||||||||||||||||||||||||||||||||||||||||||||||||||||||||||
| Increases IL-1β and expressed in monocyte/macrophage lineage cells | |||||||||||||||||||||||||||||||||||||||||||||||||||||||||||||||||||||||||||||||||||||||||||||||||||
| cg22626579 | -0.69 | 1.81×10⁻⁷ | 9.63×10⁻⁴ | 1 | 2038628 | PRKCZ | 5'UTR | island | ↑ IL-1β [Supplementary Table 2 of 32, 33] | ||||||||||||||||||||||||||||||||||||||||||||||||||||||||||||||||||||||||||||||||||||||||||
| cg10314750 | -0.74 | 2.98×10⁻⁶ | 1.03×10⁻² | 3 | 9922257 | CIDEC | TSS1500 | open sea | ↑ IL-1β [34, Figure 6E of 35] | ||||||||||||||||||||||||||||||||||||||||||||||||||||||||||||||||||||||||||||||||||||||||||
| cg16630982 | -0.20 | 3.31×10⁻⁶ | 1.12×10⁻² | 17 | 41277394 | BRCA1 | 5'UTR | shore ↑ IL-1β [36, 37] | |||||||||||||||||||||||||||||||||||||||||||||||||||||||||||||||||||||||||||||||||||||||||||
| cg12182452 | -0.35 | 1.14×10⁻⁵ | 3.12×10⁻² | 17 | 41277730 | BRCA1 | TSS1500 | shore | |||||||||||||||||||||||||||||||||||||||||||||||||||||||||||||||||||||||||||||||||||||||||||
| Chr: chromosome; CpG: cytosine-phosphate-guanine dinucleotide; FDR: false discovery rate. | |||||||||||||||||||||||||||||||||||||||||||||||||||||||||||||||||||||||||||||||||||||||||||||||||||
| aMethylation levels of gout-methylation levels of non-gout in monocytes after adjusting for age, sex, alcohol drinking, smoking status, smoking history (total pack-years) and cell fractions with CellDMC. | |||||||||||||||||||||||||||||||||||||||||||||||||||||||||||||||||||||||||||||||||||||||||||||||||||
| bPositions of the CpG sites in hg19. | |||||||||||||||||||||||||||||||||||||||||||||||||||||||||||||||||||||||||||||||||||||||||||||||||||
| cTSS200 and TSS1500 both belong to promoters [22]. | |||||||||||||||||||||||||||||||||||||||||||||||||||||||||||||||||||||||||||||||||||||||||||||||||||
| dReferences about genes in relationship to IL-1β production and supporting its expression in monocyte/macrophage lineage cells. | |||||||||||||||||||||||||||||||||||||||||||||||||||||||||||||||||||||||||||||||||||||||||||||||||||
Gout was associated with numerous comorbidities, including increased low-density lipoprotein levels, elevated triglyceride levels, and altered HbA1c levels [2, 3]. To confirm that the monocyte-specific differential methylation we observed was specific to gout, we also examined monocyte-specific associations with metabolic traits (Supplementary Figure 1, Step IIe; Supplementary Table 5). Some of the initially identified CpG sites (cg18886702, cg00091098, cg22408430, cg13204333, cg14326053, cg10027934, cg01718853, cg13559233, cg03275949, cg07235456, cg25692425, cg11169286, cg05438708, and cg04810466) were not specific to gout (Supplementary Table 5). Meanwhile, of the CpG sites located in IL-1β-regulating genes, cg18886702 showed monocyte-specific associations with both low-density lipoprotein and HbA1c, cg00091098 showed monocyte-specific associations with low-density lipoprotein, cg22408430 manifested monocyte-specific associations with HbA1c, cg13204333, cg14326053, and cg10027934 displayed monocyte-specific associations with low-density lipoprotein (Supplementary Figure 4). Only nine CpG sites of the CpG sites located in IL-1β-regulating genes, (cg22626579, cg10314750, cg03795507, cg10257063, cg16975613, cg16630982, cg12182452, cg17151991, and cg26375855) that did not exhibit monocyte-specific associations with low-density lipoprotein, triglyceride, or HbA1c levels survived metabolic trait analysis (Figure 2; Supplementary Figure 1, Step IIe). To augment metabolic trait analysis, we examined previous EWAS results from EWASdb (Supplementary Figure 1, Step IIf) [38]. None of these final nine CpG sites were associated with body mass index (Supplementary Table 6) according to EWASdb. A separate study also found no associations between DNA methylation and hypertension [39].
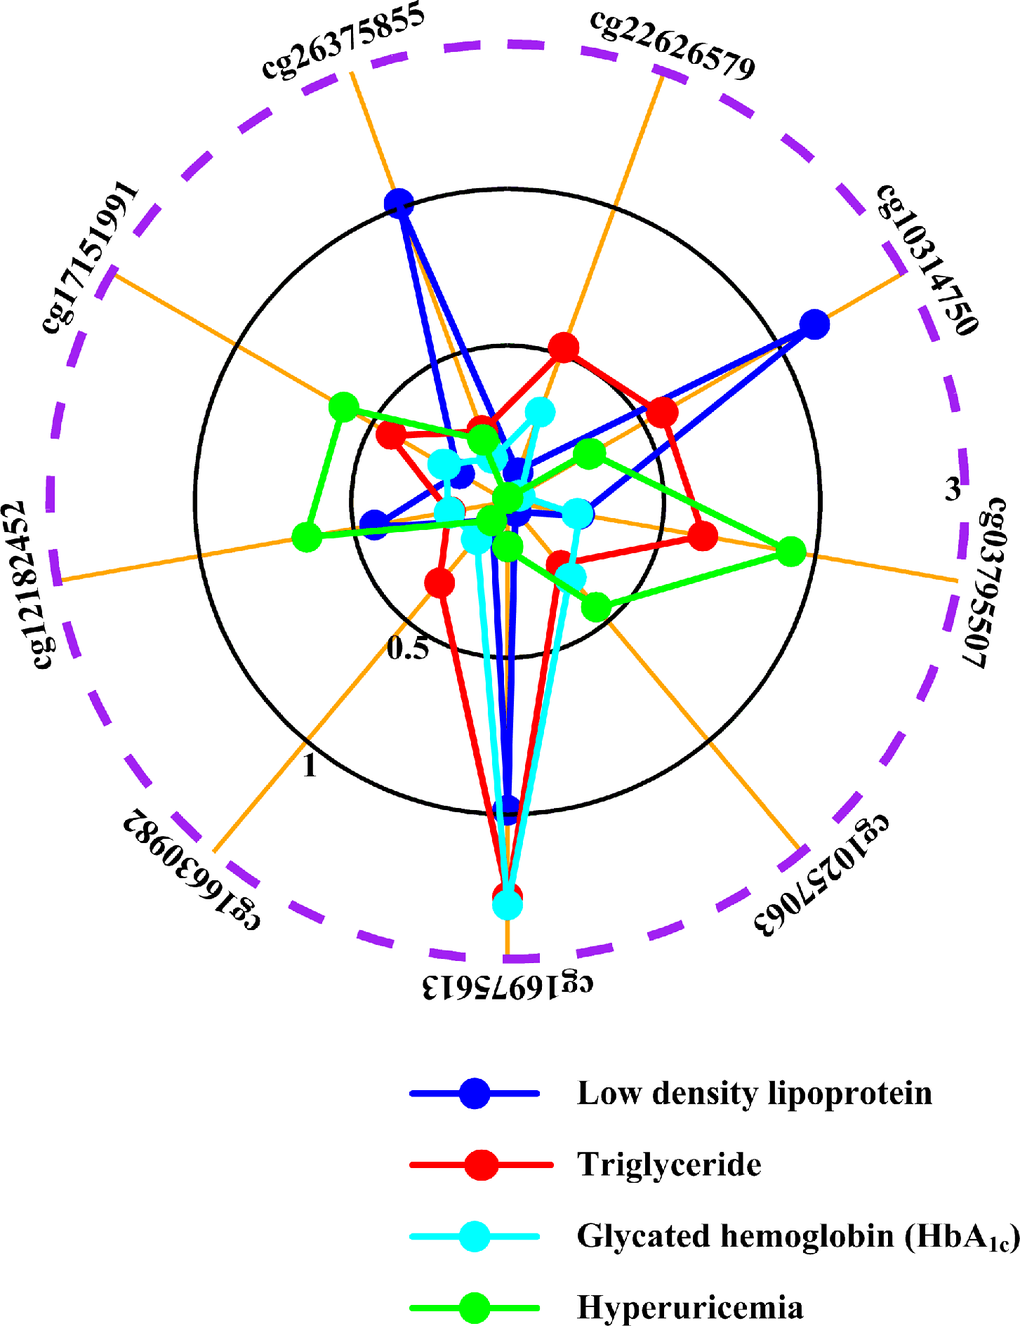
Figure 2. Associations of surviving methylation sites with metabolic traits and hyperuricemia. The graphical representation shows monocyte-specific associations between cg22626579, cg10314750, cg03795507, cg10257063, cg16975613, cg16630982, cg12182452, cg17151991, cg26375855 methylation and low density lipoprotein (blue line), triglyceride (red line), HbA1c levels (cyan line) and hyperuricemia (green line). The radii mean minus log10P of monocyte-specific associations between cytosine-phosphate-guanine dinucleotide (CpG) sites and phenotypes. The dashed purple circle shows threshold value of P=0.05. For example, cg17151991 is not monocyte-specifically associated with low density lipoprotein (P=0.6650, minus log10P=0.18), triglyceride (P=0.3715, minus log10P=0.43), HbA1c (P=0.5758, minus log10P=0.24) and hyperuricemia (P=0.2481, minus log10P=0.61). All results are adjusted for sex, age, alcohol drinking, smoking status, smoking history (total pack-years) and cell fractions with CellDMC (see supplementary methods).
Furthermore, to differentiate between the hyperuricemia and gouty inflammation stages of gout [5–9], we examined monocyte-specific relationships between the final nine monocyte-specific differentially methylated CpG sites (cg22626579, cg10314750, cg03795507, cg10257063, cg16975613, cg16630982, cg12182452, cg17151991, cg26375855) and hyperuricemia (Supplementary Figure 1, Step IIg).
None of the final nine monocyte-specific differential methylation sites were associated with hyperuricemia (Figure 2), indicating that all nine sites were specifically involved in gouty inflammation alone. Similarly, a literature review did not identify any overlap between these nine loci and previously identified uric acid-associated loci (Supplementary Figure 1, Step IIh; Supplementary Table 7).
Relationships between the final nine loci and gout were not confounded by genetic variants
Previous studies have demonstrated local correlations between genetic variants and DNA methylation levels (cis-meQTL) [40]. To determine whether genetic variants were involved in the monocyte-specific associations between CpG methylation and gout observed here, we conducted monocyte-specific cis-meQTL and genetic analyses of variants within 20,000 base pairs of the nine surviving monocyte-specific CpG sites; this strategy was similar to previous approaches (Supplementary Figure 1, Step IIIa-IIIb) [40].
Associations between methylation at some of the initially identified the monocyte-specific CpG sites and gout were likely confounded by genetic variants (Supplementary Table 8). However, for cg22626579, as shown in Figure 3, although some nearby genetic variants displayed monocyte-specific associations with cg22626579 methylation (Figure 3A) or gout (Figure 3B), no single genetic variant was associated with both monocyte-specific cg22626579 methylation and gout. Thus, genetic variations did not underlie the observed monocyte-specific epigenetic associations between cg22626579 methylation and gout. Similar results were obtained for cg10314750, cg03795507, cg10257063, cg16975613, cg16630982, cg12182452, cg17151991 and cg26375855 (Supplementary Figures 5–12). Taken together, these results suggest that the relationships between monocyte-specific methylation at the final nine sites and gout were not confounded by genetic mediators, and all final nine CpG sites were therefore included in subsequent analysis.
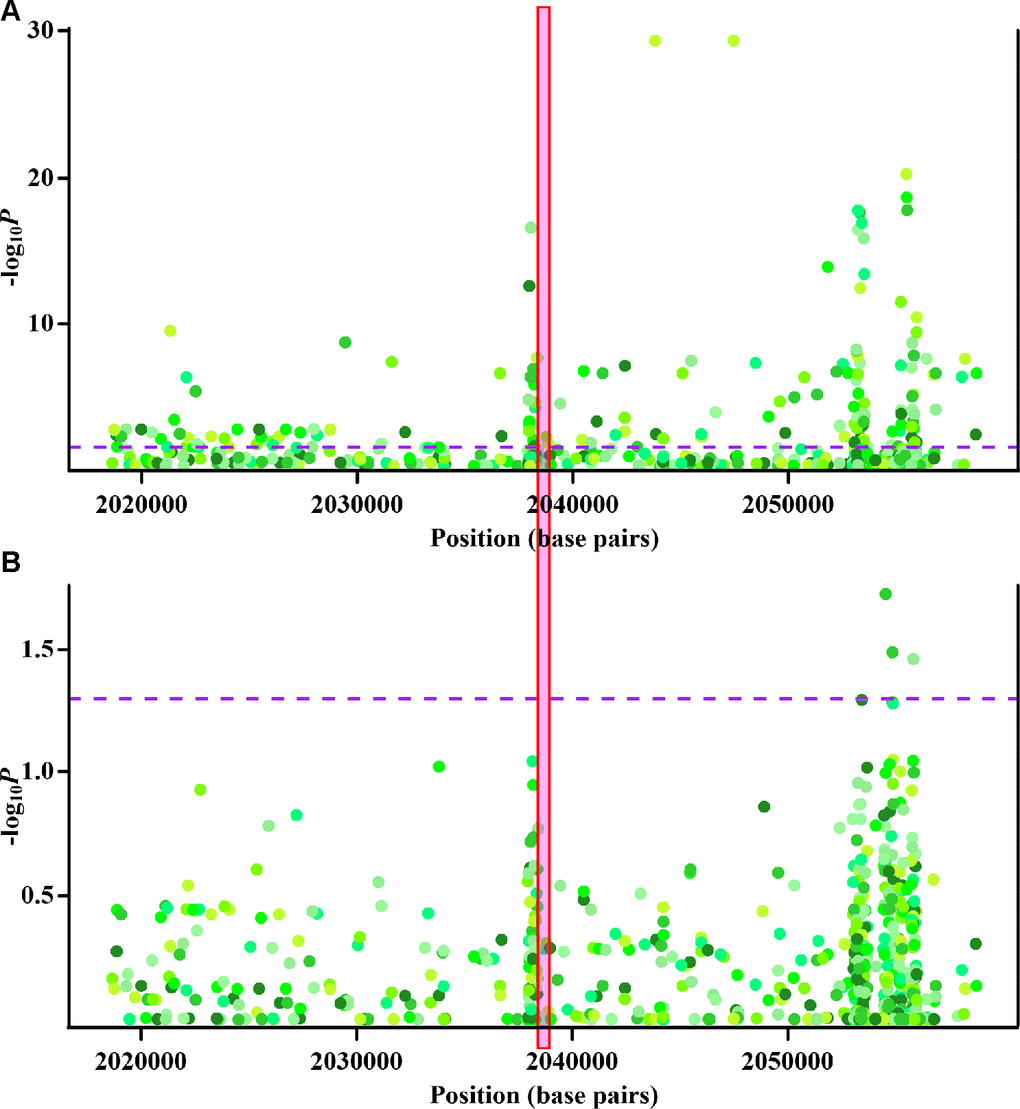
Figure 3. Cis-methyl-quantitative trait locus (cis-meQTL) and genetic analysis of cg22626579. (A) Regional association plots of monocyte-specific associations between nearby genetic variants and cg22626579 methylation. X-axis represents positions on respective chromosome. Y axis represents minus log10P of monocyte-specific associations between genetic variants and cg22626579 methylation. (B) Regional association plots of monocyte-specific associations between nearby genetic variants and gout. X-axis represents positions on respective chromosome. Y axis represents minus log10P of monocyte-specific associations between genetic variants and gout. Every point is one genetic variant colored with respective hue, with different colors implying different genetic variants. The dashed purple lines indicate the significance threshold (P = 0.05), and the red box highlights the location of cg22626579. Monocyte-specific associations of genetic variants with cg22626579 methylation and gout are analysed using multiple regression analysis, adjusting for sex, age, alcohol drinking, smoking status, smoking history (total pack-years) and cell fractions (see supplementary methods).
Less evidence of associations with gout from local co-methylated CpGs
Due to the high degree of spatial correlation in CpG methylation and the biological relevance of co-methylation [41–43], we examined whether methylation of CpG sites surrounding the final nine monocyte-specific differentially methylated loci were associated with gout (Supplementary Figure 1, Step IVa).
Of the final nine sites that passed monocyte-specific cis-meQTL/genetic analyses (cg22626579, cg10314750, cg03795507, cg10257063, cg16975613, cg16630982, cg12182452, cg17151991 and cg26375855), corresponding MethylationEPIC BeadChip array CpG probes located in the nearby region were examined (Figure 4A, Supplementary Figures 13A–20A). As shown in Figure 4A, none of the nearby CpG sites demonstrated evidence of co-methylation with cg22626579 (ρ≥0.8) [44]. Furthermore, none of the monocyte-specific associations between these nearby CpG sites and gout were nearly as strong as the association for cg22626579 (Figure 4B). Similar results were obtained for cg10314750 (Supplementary Figure 13A, 13B), cg03795507 (Supplementary Figure 14A, 14B), cg10257063 (Supplementary Figure 15A, 15B), cg16975613 (Supplementary Figure 16A, 16B), cg16630982 (Supplementary Figure 17A, 17B), cg12182452 (Supplementary Figure 18A, 18B), cg17151991 (Supplementary Figure 19A, 19B), and cg26375855 (Supplementary Figure 20A, 20B). Furthermore, there was no evidence of co-methylation between cg16630982 and cg12182452 (ρ=0.51) (Supplementary Figure 17A), suggesting that monocyte-specific associations observed for those two CpG sites were independent.
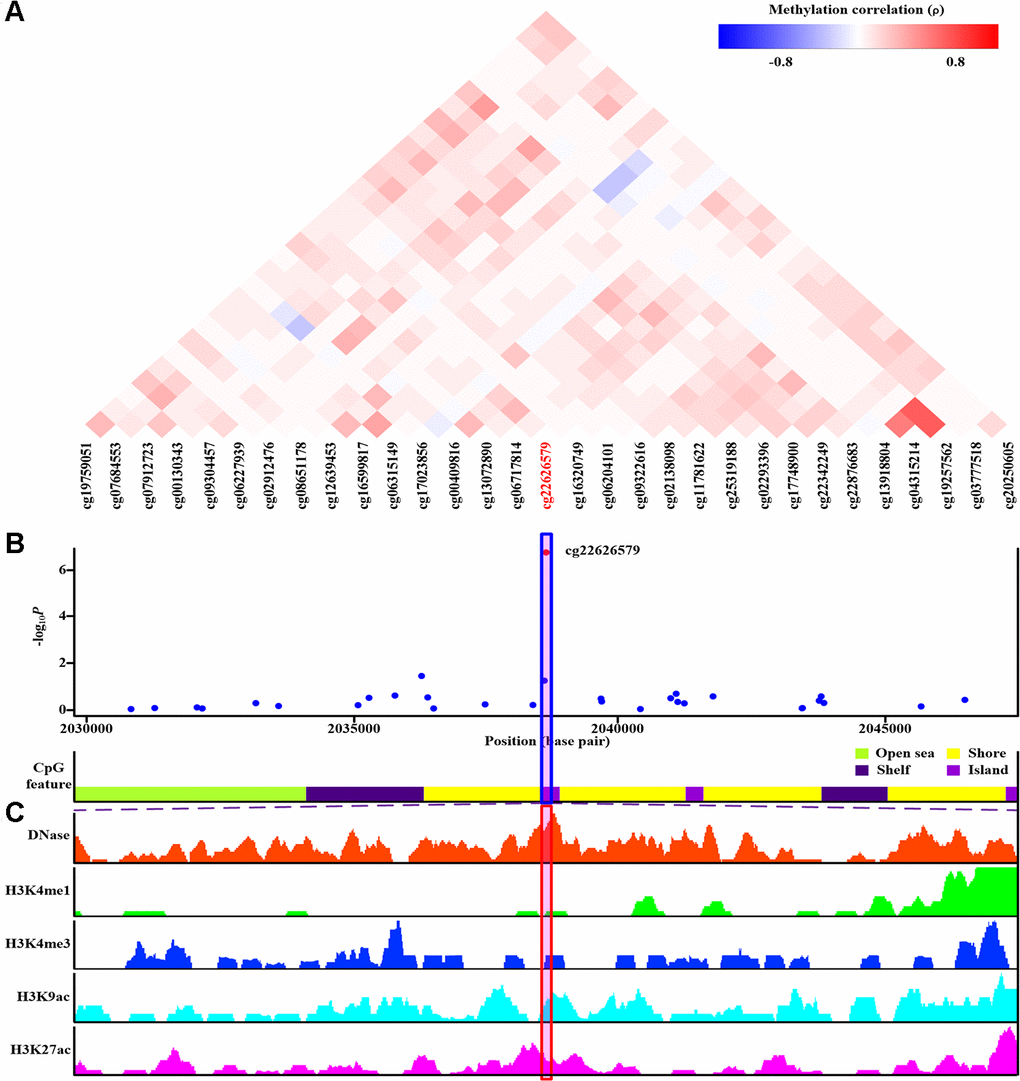
Figure 4. Co-methylation analysis and functional annotation of cg22626579. (A) Patterns of co-methylation at the cytosine-phosphate-guanine dinucleotide (CpG) sites surrounding cg22626579. (B) Monocyte-specific regional association results along with position of nearby CpG island (dark violet), CpG shore (yellow), CpG shelf (indigo) and CpG open sea (green yellow). cg22626579 (highlighted in shaded box) is located in CpG island. (C) Functional annotation of cg22626579. DNase hypersensitive sites derived by DNase-seq (DNase Track) and histone marks surrounding cg22626579 (H3K4me1, H3K4me3, H3K9ac and H3K27ac Tracks) in monocyte are shown. DNase hypersensitivity, H3K4me1, H3K4me3, H3K9ac and H3K27ac histone marks are associated with active regulatory elements.
We also completed co-methylation analysis for the six methylation sites located in IL-1β-regulating genes that did not pass metabolic trait analysis (Supplementary Table 3; Supplementary Figure 21A–26B) and for the remaining 43 CpG sites located in genes that did not directly regulate IL-1β (Supplementary Table 4; Supplementary Figure 27A–69B). Although cg00748492 displayed co-methylation with cg01904227 (ρ=0.81) and cg26544725 (ρ=0.81) (Supplementary Figure 51A), neither of the latter two sites had monocyte-specific associations with gout as strong as that of cg00748492 (Supplementary Figure 51B). These results suggest that the 58 monocyte-specific methylation sites identified here were independent signals.
Functional annotation of CpG loci in monocyte regulatory elements
To assess whether the final nine monocyte-specific differentially methylated CpG sites that passed monocyte-specific cis-meQTL and genetic analyses had functional potential, we examined monocyte epigenetic data for the area surrounding each site in monocytes using the WashU epigenome browser (Supplementary Figure 1, Step IVb). We chose DNase, H3K4me1, H3K4me3, H3K9ac, and H3K27ac as annotation histone marks. DNase-seq is a well-established method for identifying nucleosome-depleted regions that include active regulatory elements [45]. We also evaluated CpG sites with respect to post-translational histone modifications H3K4me1, H3K4me3, H3K9ac, and H3K27ac, which are associated with active regulatory regions [46]. The WashU epigenome browser (hg19) was queried to create separate epigenetic tracks for regions containing differentially methylated CpG sites (Figure 4C, Supplementary Figures13C–20C).
DNase-seq results indicated that cg22626579 was located in a DNase hypersensitivity site in monocytes (Figure 4C). Furthermore, cg22626579 was located in a transcriptional regulatory region containing multiple histone marks characteristic of active regulatory elements (H3K4me1, H3K4me3, H3K9ac and H3K27ac) in monocytes (Figure 4C) [46]. Together, these features suggested that cg22626579 might have regulatory potential in monocytes. Similar results were obtained for the remaining eight monocyte-specific differentially methylated CpG sites (cg10314750, cg03795507, cg10257063, cg16975613, cg16630982, cg12182452, cg17151991, and cg26375855), each of which overlapped with DNase hypersensitivity sites and the histone marks (H3K4me1, H3K4me3, H3K9ac and H3K27ac) indicative of active regulatory elements in monocytes (Supplementary Figures 13C, 20C). Taken together, these findings suggest that the final nine monocyte-specific differentially methylated CpG sites might have regulatory potential in monocytes.
Of the additional six methylation sites located in IL-1β-regulating genes that failed metabolic trait analysis (Supplementary Table 3) as well as the remaining 43 CpG sites located in genes that did not directly regulate IL-1β (Supplementary Table 4), all showed some regulatory potential, as evidenced by overlap with various combinations of DNase hypersensitivity site and histone marks indicative of active regulatory region in monocytes (Supplementary Figure 21C, 69C).
Transcription factor mapping for the final CpG loci
Although DNA methylation changes may not directly impact cellular processes, differential DNA methylation coordinates transcription factors that exert downstream effects [47]. To explore how cell lineage-specific methylation might affect mechanisms underlying gout, we used MoLoTool and ReMap to identify associated transcription factors (Supplementary Figure 1, Step Va-Vb) [48, 49]. No associated transcription factors were identified for cg10257063 and cg26375855 by ReMap; otherwise, associated transcription factors were identified for all nine sites by both tools (Supplementary Tables 9–24, Supplementary Figure 70).
Associations between methylation at the final nine CpG loci and clinical characteristics
To evaluate whether the final nine epigenetic loci had clinically relevant associations with phenotypic variations among gout patients in addition to disease susceptibility, we examined associations between methylation at the final nine CpG loci and clinical characteristics in gout patients (Supplementary Figure 1, Step Vc). Interesting, methylation levels of PRKCZ and STK11 were lower for individuals with more extensive family histories of gout in first-degree relatives (Supplementary Figure 71). These results were consistent with the associations between PRKCZ and STK11 hypomethylation and development of gout (Table 2). Family history of gout is associated with other markers of severity such as polyarticular gout and tophi formation [50, 51]. These observations suggest that PRKCZ and STK11 hypomethylation could be associated with more severe gout phenotypes in addition to gout susceptibility.
Discussion
Different cell lineages displayed distinct methylation alterations in gout. However, the IL-1 signaling pathway was identified as the pathway most affected by altered methylation in multiple cell lineages. Aberrant DNA methylation that exhibited monocyte-specific associations with gout was observed at nine sites (cg22626579, cg10314750, cg03795507, cg10257063, cg16975613, cg16630982, cg12182452, cg17151991, and cg26375855) that mapped to eight genes (PRKCZ, CIDEC, VDAC1, CPT1A, BIRC2, BRCA1, STK11 and NLRP12); however, methylation at these sites was not associated with gout comorbidities or hyperuricemia (Figure 2). These observations suggest that these sites were specifically associated with gouty inflammation, rather than hyperuricemia. Furthermore, all nine CpG sites survived monocyte-specific cis-meQTL and genetic analyses, excluding the possibility of confounding genetic factors (Figure 3, Supplementary Figures 5–12). Functional annotation revealed that each site was located in a region of open chromatin structure containing histone markers indicative of active regulation, supporting their regulatory potential in monocytes (Figure 4C, Supplementary Figure 13C, 20C). Transcription factor mapping also identified several transcription factors affected by the methylation sites that might exert effects in gout (Supplementary Tables 9–24, Supplementary Figure 70). Finally, decreased PRKCZ and STK11 methylation were associated with familial clustering of gout (Supplementary Figure 71).
In this study, there was little overlap in differential methylation patterns between different cell lineages (Supplementary Figure 2). Similarly, previous studies have reported limited overlap of differential methylation between distinct cell lineages [52]. Whether this observation applies to other diseases as well remains unknown. However, this result suggested that different regulatory mechanisms of DNA methylation operated in different cell subsets, resulting in distinct methylation landscapes in different cell lineages. Improved understanding of these cell lineage-specific methylation regulatory mechanisms might help identify cell type-specific therapies for various diseases that might minimize unnecessary side effects.
Multiple pathways besides IL-1 signaling that were affected by methylation, such as IL-10 signaling (Figure 1B, 1D) and ubiquinol-10 biosynthesis (Figure 1A, 1C), were shared by several cell types. Interestingly, most were also related to IL-1β production and gouty inflammation (Supplementary Table 25). The precise roles these pathways play in the development of gout remain unknown and should be examined in future investigations.
The final nine surviving monocyte-specific differentially methylated CpG sites were mapped to eight genes (PRKCZ, CIDEC, VDAC1, CPT1A, BIRC2, BRCA1, STK11, and NLRP12) that have not previously been studied in the field of gout genetics. PRKCZ is expressed in macrophages and increases IL-1β release [Supplementary Table 2 of 32, 33]. 5'UTR hypomethylation is associated with gene upregulation [53], and hypomethylated PRKCZ might therefore increase PRKCZ expression, subsequently increasing IL-1β production in macrophages and facilitating gout (Table 2, Figure 5).
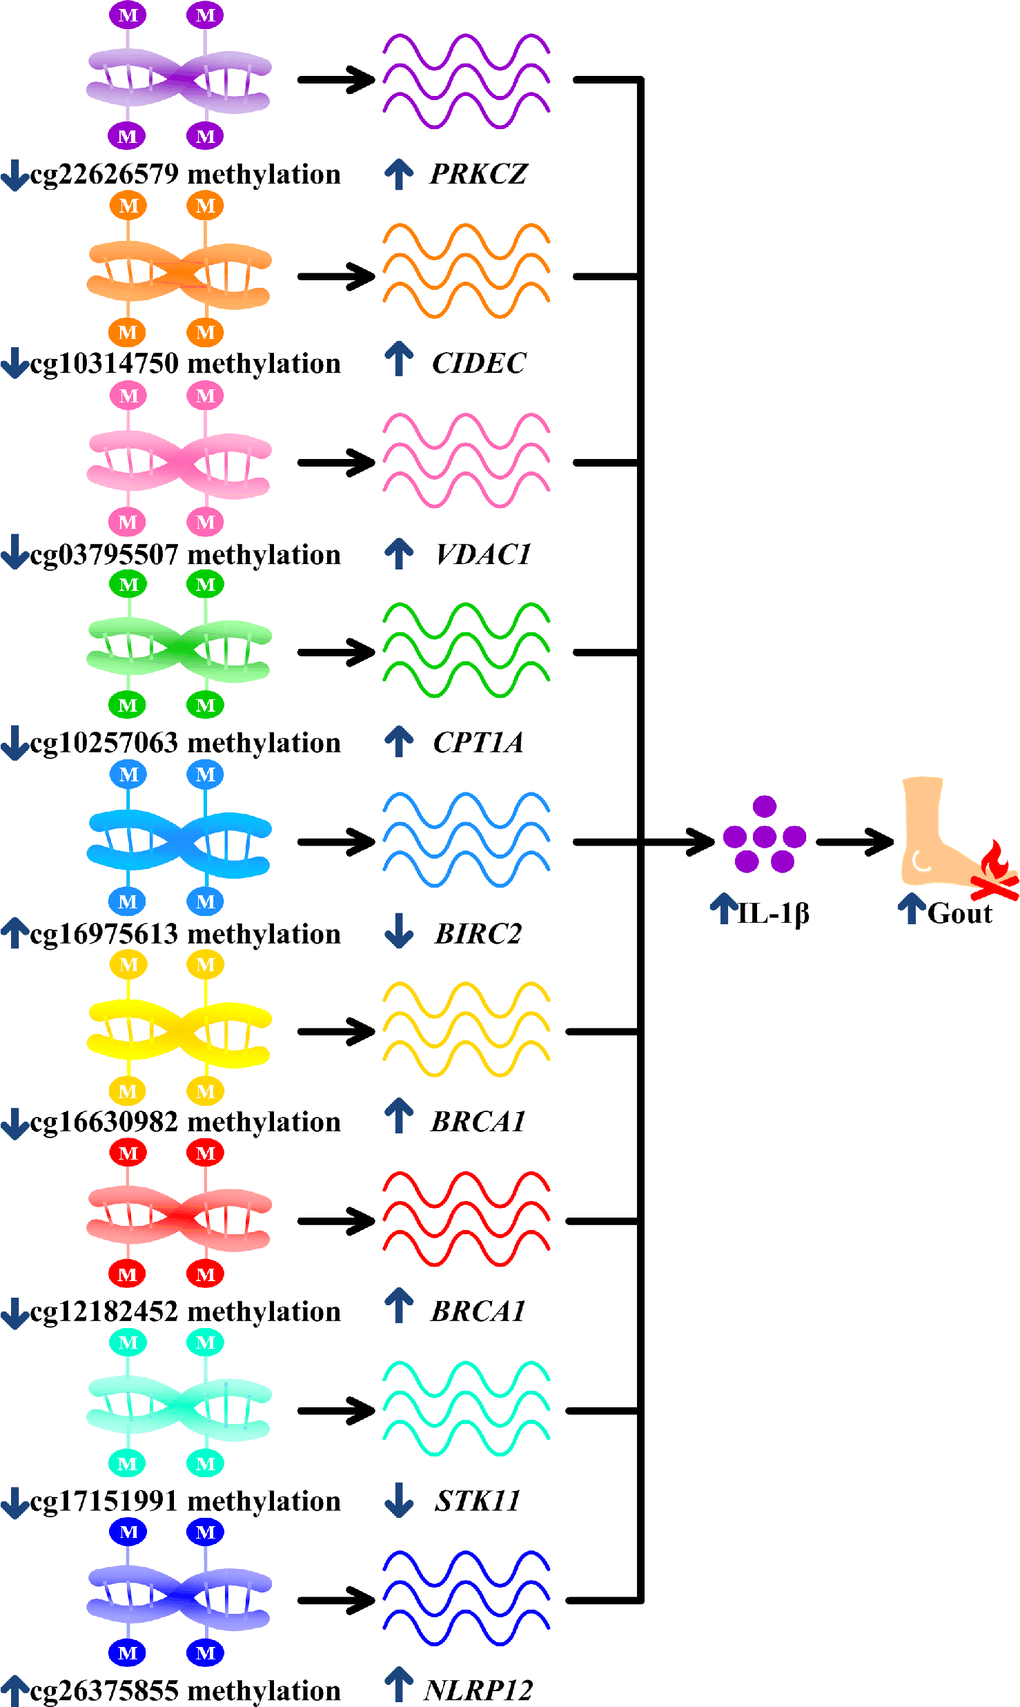
Figure 5. Potential mechanisms linking surviving methylation sites with gouty inflammation. cg22626579 hypomethylation in gout increases PRKCZ, cg10314750 hypomethylation in gout increases CIDEC, cg03795507 hypomethylation in gout increases VDAC1, hypomethylated cg10257063 in gout increases CPT1A, cg16975613 hypermethylation in gout decreases BIRC2, cg16630982 and cg12182452 hypomethylation in gout increases BRCA1, cg17151991 hypomethylation in gout decreases STK11 and hypermethylated cg26375855 in gout increases NLRP12. All these culminate in increased interleukin-1β (IL-1β) production, promoting gouty inflammation.
CIDEC is expressed in macrophages and increases the release of IL-1β [34, Figure 6E of 35]. Promoter hypomethylation is associated with gene upregulation [54, 55]. Therefore, CIDEC hypomethylation might increase IL-1β, which is the central driver in gouty inflammation (Table 2, Figure 5) [9]. VDAC1 also stimulates IL-1β expression in macrophages [26], and the hypomethylated VDAC1 promoter may promote VDAC1 expression [54, 55] and subsequent IL-1β expression in macrophages, thus perpetuating gouty inflammation (Table 2, Figure 5). CPT1A is also required for IL-1β production in macrophages and may be upregulated in response to 5'UTR hypomethylation [27, 53]. The CPT1A hypomethylation observed here therefore likely promotes gout by increasing CPT1A expression and IL-1β production in macrophages (Table 2, Figure 5).
Previous studies demonstrated that BIRC2, also called cIAP1 [28], downregulates IL-1β in macrophages [29]. Gene is downregulated in association with promoter hypermethylation [54, 55], Here, hypermethylation of BIRC2 likely suppressed BIRC2 expression and increased IL-1β production, exacerbating gout (Table 2, Figure 5). BRCA1 is also expressed in macrophages and can increase IL-1β expression [36, 37]. Consequently, hypomethylated promoter and 5'UTR of BRCA1 increased BRCA1 expression and IL-1β secretion, thus promoting gouty inflammation (Table 2, Figure 5) [36, 37, 53–55]. STK11 inhibits IL-1β release in macrophages [30]. Hypomethylation of STK11 gene body likely suppressed STK11 expression [56, 57], which in turn increased IL-1β levels and magnified gouty inflammation (Table 2, Figure 5) [30, 56, 57]. NLRP12 also upregulated IL-1β in macrophages [31] and hypermethylation of NLRP12 gene body probably increased NLRP12 expression [56, 57] and IL-1β release, thereby promoting gouty inflammation (Table 2, Figure 5) [31, 56, 57].
Fifteen of the monocyte-specific differentially methylated CpG sites identified here were located in genes that affect IL-1β levels according to previous reports (Table 2, Supplementary Table 3) while 43 sites were located in genes with no reported direct effects on IL-1β (Supplementary Table 4). Of these 43 methylation sites, only cg19824059, cg08797047, and cg11169286 were associated with hyperuricemia (Supplementary Table 26). However, most of the 43 sites displayed potential associations with inflammation according to current evidence (Supplementary Table 26). Therefore, although the associations of cg19824059, cg08797047, and cg11169286 methylation with gout could be partly attributed to hyperuricemia, gouty inflammation, rather than hyperuricemia might provide the link between most of the 43 remaining CpG sites and gout. Deeper analysis of these 43 sites might help identify additional mechanisms underlying gout pathogenesis.
Some of the factors identified during transcription factor mapping in this study (AHR, CEBPA, CEBPB, EGR1, HIF1A, KLF9, MED1, NFE2L1, PPARG, RELA(p65), SPI1(PU.1), STAT1, and VDR) have been reported to increase or decrease IL-1β levels in monocytes or macrophages in previous studies (Supplementary Figure 70). Additionally, AHR, BRD4, and PPARG are known to facilitate or inhibit gouty inflammation (Supplementary Figure 70). Together, these findings support potential roles for these transcription factors in gouty inflammation. The results of transcription factor mapping could inform further studies to clarify mechanism through which these CpG sites facilitate gouty inflammation.
We also explored whether the nine epigenetic variations associated with gout development (Table 2) were also associated with clinical phenotypes in gout patients. The results indicated that hypomethylation in PRKCZ and STK11 was associated with familial clustering of gout (Supplementary Figure 71). Familial clustering of gout is associated with polyarticular manifestation and presence of tophi [50, 51], both of which are indicative of severe gout. These findings suggest that PRKCZ and STK11 hypomethylation might impact not only disease susceptibility but might also impact family histories and clinical phenotypes in gout patients.
The etiology of monocyte-specific differential methylation of PRKCZ, CIDEC, VDAC1, CPT1A, BIRC2, BRCA1, STK11, and NLRP12 in gout remains unknown. Given that both genetic and environmental factors play roles in gout [12] and because environmental exposure is crucial in shaping the epigenome landscape [15], environmental factors may underlie this differential methylation. For example, previous studies found that the risk of gout was inversely associated with consumption of coffee and omega-3 fatty acids, both of which decreased DNA methylation [58–61]. Conversely, legumes, which increased methylation, reduced the risk of gout [62, 63]. Additional studies are needed to identify other environmental factors that might impact gout by increasing or decreasing DNA methylation.
Irrespective of the underlying causes, these methylation changes could facilitate gouty inflammation (Figure 5). Several lines of evidence further showed molecules targeting PRKCZ, CIDEC, VDAC1, CPT1A, BIRC2, BRCA1 and STK11 exerted corresponding effects on gouty inflammation (Supplementary Table 27). Thus, findings of this study could represent novel therapeutic targets in gout.
One of the main strengths of this study is the inclusion of large number of subjects from the general population of Taiwan, which increases its applicability to clinical practice. Furthermore, we adjusted for the following covariates using CellDMC: age, sex, alcohol drinking, smoking status, smoking history (total pack-years), and cell fractions [20]. All of these covariates can affect DNA methylation [64–66], and previous epigenetic studies have not adequately controlled for their effects [67]. Furthermore, the cell lineage-specific nature of the methylation studies we examined here allowed us to draw novel conclusion. Because different cell types participate in different aspects of gout [68], identification of a specific cell type showing epigenetic alterations is crucial in understanding the impact of such alterations on diverse biological function, identifying causal relationships between methylation and phenotype, and establishing valuable clinical biomarkers and therapeutic targets. In addition, previous studies demonstrated that genetic factors contributing to disease susceptibility often function in a cell type-specific manner [69]. Cell type-specific functional investigations like ours might therefore ultimately help connect epigenetic variations identified via EWAS to molecular mechanisms and drug discovery. Finally, drugs that act on cell type-specific targets are more likely to gain regulatory approval and enter clinical use [70]. Cell lineage-specific studies might therefore increase drug discovery successful rates.
We used a deconvolution algorithm to infer cell type-specific differential methylation from tissue-level methylation results instead of directly measuring of methylation in various isolated cell lineages. Several advantages are associated with tissue-level bulk profiling compared to cell-type specific profiling, in which low recovery rates per specimen lead to large volume requirements for each individual. It is difficult to obtain samples of sufficient volume that contain various cell lineages in large enough quantities to conduct research on the scale of this study. Additionally, samples for lineage-specific analysis performed in isolated cell lineages must be handled in a manner that preserves cellular membranes and epitopes for cell-sorting. The steps necessary to preserve these structures differ between cell lineages, making such procedures impractical for large-scale cohort investigations like the present study that simultaneously targeting multiple cell lineages. Finally, the high costs of additional collection, sorting, enrichment, and purification also limit available sample sizes. Most recent epigenetic studies have therefore used whole-available tissue samples for EWAS rather than isolated specific cell subsets [71, 72].
In conclusion, this cell lineage-specific epigenetic and genetic study of gout revealed distinct methylation landscapes across various cell lineages. IL-1 signaling emerged as the most important associated molecular mechanism in pathway analysis and network construction. Further cis-meQTL and genetic analyses revealed evidence of monocyte-specific aberrations in methylation of PRKCZ, CIDEC, VDAC1, CPT1A, BIRC2, BRCA1, STK11, and NLRP12 in gout. All of these genes were associated specifically with gouty inflammation rather than hyperuricemia. Moreover, PRKCZ and STK11 methylation was also associated with familial clustering of gout. Regardless of the reasons of differential methylation, these methylation changes promote gouty inflammation. However, the processes by which environmental factors promote gout by increasing or decreasing DNA methylation in each cell type-specific manner remain unknown. Multi-omic studies are required to improve our understanding of how DNA methylation interacts with other biological networks to impact gout. Longitudinal studies might help pinpoint DNA methylation markers that predict severe gout phenotypes. Additional studies and clinical trials are needed to determine whether the molecular markers might serve as effective treatments for gout.
Materials and Methods
Ethical statement
Informed consent was obtained from all enrollees. All experimental protocols were performed in compliance with the Declaration of Helsinki and according to national and international guidelines and were approved by the Tian-Sheng Memorial Hospital Institutional Review Board (TSMHIRB 17-122-B).
Study participants
All study participants of this study were recruited from the Taiwan Biobank, a prospective national cohort aiming to promote biomedical research in Taiwan [73]. This cohort was recruited from the general Taiwanese population and has been examined in several epigenetic and genetic studies, including studies on gout [12, 74, 75]. All Taiwan Biobank patients who provided informed consent for peripheral blood leukocyte DNA methylation measurement and DNA sequencing were included in the study. All steps were performed in compliance with relevant guidelines and regulations.
Sixty-nine patients with self-reported gout and 1,455 patients who self-reported the absence of gout underwent methylation array and whole genome sequencing analysis. For patients with gout, the number of first-degree relatives who also had gout were obtained from Taiwan Biobank. All participants self-identified as Han Chinese. Previous genetic studies also utilized self-reported gout [12, 76, 77] and demonstrated that self-reporting of physician-diagnosed gout resulted in high sensitivity and precision [78].
DNA bisulfite conversion and methylation quantification
Peripheral blood was collected from enrolled participants into sodium citrate tubes. DNA was isolated using the Chemagic™ Prime™ instrument, an automated chemical extraction machine that uses magnetized rods to separate nucleic acids from solutions. A Fragment Analyzer (Agilent) was used to measure DNA length, and the 260/280 optical density (OD) ratio was used to assess DNA purity. Samples with an OD 260/280 ratio of 1.6~2.0 were considered pure. DNA samples were subjected to sodium bisulfite treatment using the EZ DNA Methylation Kit (Zymo Research, CA, USA). DNA methylation at each cytosine-phosphate-guanine dinucleotide (CpG) site was quantified with the Infinium® MethylationEPIC BeadChip array (Illumina Inc) which covered 850,000 methylation sites [79]. Samples were randomized on the MethylationEPIC BeadChip to avoid batch effects. The assay was performed according to the manufacturer’s standard protocol.
Whole genome sequencing
Genomic DNA was isolated from peripheral blood and purified using standard protocols. Whole genome sequencing was performed using the HiSeq platform (Illumina Inc). On average, 8.6 Gb of mappable sequence data per individual was obtained. Isaac version 01.13.10.21 was employed to map DNA sequence reads to the hg19 reference genome. A minimum coverage of 30× was confirmed for regions of interest. Isaac Variant Caller version 2.0.17, Grouper version 1.4.2 and CNVseg version 2.2.4 were used for variant calling. Alleles were annotated with ANNOVAR version 2014Jul14. Complete assemblies of the regions of interest were obtained for all samples.
Marker classification
In the MethylationEPIC BeadChip array, CpG markers were categorized based on chromosome location and the feature category of the gene region according to UCSC annotation (TSS200, TSS1500, 5'UTR, first exon, Body, 3'UTR, intergenic). In this classification scheme, the TSS200 category refers to the region 0~200 bases upstream from the transcriptional start site (TSS), TSS1500 category refers to the region 201~1,500 bases upstream of TSS [80], 5'UTR refers to the region between the TSS and the start site (ATG). CpGs within the first exon of a gene are included in the first exon category, CpGs downstream from the first exon and before the stop codon, including intronic regions, are included in the gene body category, and CpGs downstream from the stop codon and before the poly A signal are included in the 3'UTR category. Finally, CpGs that do not fit into any of the previous categories are annotated as intergenic.
Cell lineage-specific genome-wide methylation analysis
Minfi version 1.18.2 was used to import raw methylation data and generate methylation β-values for subsequent analyses [81]. Methylation results from the MethylationEPIC BeadChip array were processed and analyzed according to previously reported approaches (Supplementary Figure 1, Step I) [64]. Quality control at the probe level was performed by computing a detection P value relative to control probes. Probes without significant detection (P > 0.05) in more than 5% of the samples were excluded (Supplementary Figure 1, Step Ia) [64]. Sex chromosome CpG sites were also excluded because X chromosomes were inactivated by methylation in females (Supplementary Figure 1, Step Ib) [82]. Probes with single nucleotide polymorphisms (SNPs) at the CpG site (minor allele frequency ≥ 5%), at the single base extension (minor allele frequency ≥ 5%), and at probes (minor allele frequency ≥ 5%) (Supplementary Figure 1, Step Ic) were also eliminated [64]. Previously identified cross-reactive probes in the MethylationEPIC BeadChip were excluded as well (Supplementary Figure 1, Step Id) [83]. Methylation intensity levels were functionally normalized after subdividing by probe type, sub-type, and color channel (Supplementary Figure 1, Step Ie), and beta-normalized methylation levels were then calculated based on these normalized intensity levels [64]. Qualified probes were examined in subsequent analyses.
To estimate cell-type fractions, we leveraged the previously validated EpiDISH procedure (Supplementary Figure 1, Step If) [20]. Briefly, the EpiDISH procedure uses a DNA methylation reference matrix defined by 333 immune-cell-subtype-specific differentially methylated CpG sites and seven immune cell subtypes (monocytes, eosinophils, neutrophils, NK cells, B cells, CD4+ T cells, and CD8+ T cells) to estimate underlying immune cell subtype fractions.
CellDMC was used to identify cell lineage-specific differentially methylated CpG sites in gout (Supplementary Figure 1, Step Ig) [20]. Adjustments were made for sex, age, alcohol drinking, smoking history (total pack-years), smoking status and cell fractions to avoid the confounding effects of these factors [64–66, 84]. Participants were categorized as non-smokers if they had never smoked or have not smoked continuously for at least six months. Former smokers included those who continuously smoked for at least six months but were currently not smoking. Participants who have continuously smoked for at least six months and were currently smoking were classified as current smokers. Participants were considered non-drinkers if they had never drunk or drank less than 150 cc of alcohol per week continuously for six months. Patients who abstained from alcohol for more than six months were regarded as former drinkers while current drinkers were those who drank at least 150 cc of alcohol per week continuously for six months, according to Taiwan Biobank questionnaires [74]. CpG sites showing differential methylation between gout and non-gout patients and the cell lineages that drove those effects were identified. False discovery rates less than 0.05 were considered significant [85].
Overlap of differential methylation in different cell lineages
To examine whether differential methylation patterns were similar between different cell lineages, we used the definition of Jaccard Index to calculate overlap rates (Supplementary Figure 1, Step IIa) [86]. At the CpG site level, the overlap rate of differential methylation was the ratio of the number of CpG sites with differential methylation in both cell lineages over the number of CpG sites with differential methylation in one or both cell lineages. At the gene level, the overlap rate of differential methylation was the ratio of the number of genes containing differentially methylated CpG sites in both cell lineages over the number of genes with differentially methylated CpG sites in one or both cell lineages. Differential methylation between different cell lineages was considered similar if the overlap rate was ≥ 0.5, the same threshold used in a previous study [23].
Ingenuity Pathway Analysis (IPA)
To identify the common functional characteristics of differentially methylated genes in monocytes, eosinophils, neutrophils, NK cells, B cells, CD4+ T cells, and CD8+ T cells, we used IPA (Qiagen) to determine the relative enrichment of genes in target pathways using right-tailed Fisher’s exact tests (Supplementary Figure 1, Step IIb). Genes containing differentially methylated CpG sites in each cell lineage were uploaded into IPA to perform enrichment analysis. The ingenuity knowledge base (genes only) with direct and indirect relationships and only molecules and/or relationships that had been experimentally observed or predicted in human were considered. Core analysis of the differentially methylated genes in each cell lineage was performed and results were downloaded. The top 20 pathways with the lowest P values in each lineages were plotted.
Protein-protein interaction (PPI) network construction
To explore functional relationships between differentially methylated genes, regulatory networks were constructed for genes containing differentially methylated CpG sites using NetworkAnalyst (Supplementary Figure 1, Step IIc) [87] and were visualized with Cytoscape [87]. NetworkAnalyst integrates machine learning and Walktrap algorithms and uses protein-protein interaction data from the IMEx Interactome database to perform topology analysis that examines the overall network structure to identify important genes (hubs) that act as critical players in biological networks [87].
Identify monocyte-specific CpG sites associated with gouty inflammation
IPA identified IL-1 signaling as a key pathway (Figure 1), and interleukin-1β (IL-1β) is synthesized primarily by monocytes and macrophages [24]. Additionally, most of the hub genes in the gout network were IL-1β-regulating genes (Supplementary Figure 3). We therefore focused on monocyte-specific differentially methylated genes that upregulated or downregulated IL-1β expression. CpG sites which also displayed differential methylation in other cell lineages were excluded to prevent those associations from potentially confounding the associations between CpG methylation in monocytes and gout. We also performed a literature review to elucidate the biological functions of these monocyte-specific differentially methylated genes. CpG sites annotated to genes that regulated IL-1β, the most crucial player in gouty inflammation, were included in subsequent analysis (Supplementary Figure 1, Step IId) [9].
Gout is accompanied by numerous comorbidities, including increased low density lipoprotein levels, elevated triglyceride levels, and altered glycated hemoglobin (HbA1c) levels [2, 3]. To confirm the specificity of the identified monocyte-specific differential methylation in gouty inflammation, we tested monocyte-specific associations between DNA methylation and low-density lipoprotein, triglyceride, HbA1c and hyperuricemia, adjusting for sex, age, smoking history (total pack-years), smoking status, alcohol consumption and cell fractions using CellDMC [20] (Supplementary Figure 1, Step IIe, Step IIg).
Comparison with past epigenome-wide association study (EWAS) results
To augment the results of our analyses, we obtained CpG sites associated with hypertension and body mass index from EWASdb on April 14, 2020 (Supplementary Figure 1, Step IIf) [38]. EWASdb is a part of “The EWAS Project” which seeks to store epigenetic association results for DNA methylation from various studies; it currently includes over 1,300 sets of EWAS results associated with more than 300 diseases/phenotypes. CpG sites associated with body mass index were downloaded from EWASdb. No CpG sites were associated with hypertension in EWASdb. Similarly, no evidence of associations between DNA methylation and hypertension was found in another recent study [39].
Comparison with past genome-wide association study (GWAS) results
To compare methylation results with past uric acid-associated risk variants, we performed a literature search of PubMed on October 1, 2019 and retrieved studies describing relationships between genetic loci and uric acid levels using the search terms “GWAS” and “uric acid”. Studies were included if they were written in English and contained data on loci associated with uric acid levels. No limitations were placed on patient’s ethnicity. Review articles and case reports were excluded. Selected articles were screened for potential uric acid-associated loci. Only genome-wide significant loci (P < 5×10⁻⁸) related to uric acid levels were considered; CpG sites located in uric acid-associated genes were discarded (Supplementary Figure 1, Step IIh).
Monocyte-specific cis-meQTL and genetic analysis
To exclude monocyte-specific epigenetic associations between gout and CpG site methylation that were confounded by genetic factors, we conducted monocyte-specific cis-meQTL and genetic analyses of variants within 20,000 base pairs of CpG; this was consistent with previous studies (Supplementary Figure 1, Step III) [40]. In short, we first searched for genetic variants within 20,000 base pairs of CpG sites of interest using the UCSC Genome Browser (https://genome.ucsc.edu/). Corresponding genetic variant genotyping results were obtained from whole genome sequencing. To infer the cell type specificity of genetic variants, we applied a statistical model that tested for an interaction effect between the genetic variant dosage and the proportion of various cell types, adjusting for sex, age, smoking history (total pack-years), smoking status, and alcohol consumption. In other words, monocyte-specific associations between genetic variants and CpG methylation and gout were identified by introducing additional variant×cell proportion interaction terms in the regression model between genetic variants and CpG methylation/gout and examine P values for every genetic variant for the interaction terms associated with each genetic variant; this was analogous to past approaches [88–90]. Genetic variants displaying concomitant monocyte-specific associations with CpG methylation (Supplementary Figure 1, Step IIIa) and gout (Supplementary Figure 1, Step IIIb) were considered likely to confound monocyte-specific associations between CpG methylation and gout.
Regional visualization of co-methylation patterns surrounding surviving CpG sites
After identifying CpG sites whose methylation was associated with gouty inflammation in a monocyte-specific manner, we applied coMET to estimate DNA methylation correlation between CpG sites [43]. A regional plot of monocyte-specific epigenetic-phenotype association results, estimated DNA methylation correlations between CpG sites (co-methylation) and genomic context was generated for visualization of the results (Supplementary Figure 1, Step IVa).
Monocyte-specific functional annotation of surviving CpG sites
To gain further insight about the biological relevance of differentially methylated CpG sites, the WashU epigenome browser was used to visualize chromatin modifications and histone acetylation patterns around CpG sites of interest in monocytes [91]. DNase footprinting patterns in the region identified in our association analysis were examined since DNase hypersensitivity implies an open chromatin structure, which is typical of active regulatory elements [45]. CpG regions were also aligned against ChIP-seq data for acetylated and methylated lysine variants of histone H3, which are also indicative of the histone code of active regulatory regions [46]. The WashU epigenome browser was also used to visualize DNase and histone markers located near monocyte-specific differentially methylated sites in monocytes (Supplementary Figure 1, Step IVb).
Transcription factor mapping of surviving CpG sites
Differential DNA methylation contributes to transcriptional dysregulation by altering transcription factor binding [47]. To gain insight into which transcription factors might be involved, we used MoLoTool in conjunction with ReMap (Supplementary Figure 1, Step Va-Vb) [48, 49]. For all the monocyte-specific CpG sites surviving the above analysis, we downloaded the DNA sequence of the region around each monocyte-specific CpG site from Ensembl BioMart (GRCh38.p13 assembly) and used MoLoTool to identify transcription factors that bind to the CpG sites (Supplementary Figure 1, Step Va) [48, 92]. The threshold P-value was set at the recommended default of 0.0005 [48]. We also used ReMap, which includes high-quality transcription factor binding region data from a large-scale integrative analysis of thousands of ChIP-seq and ChIP-exo datasets [49]. We retrieved transcription factor binding sites in monocytes/macrophages (Supplementary Table 1) from ReMap database and overlapped transcription factor binding sites of monocytes/macrophages with surviving CpG sites from this study (Supplementary Figure 1, Step Vb). Transcription factors obtained from MoLoTool and ReMap were plotted and summarized.
Associations between monocyte-specific CpG site methylation and clinical characteristics
Because all samples used in this study were obtained from Taiwan Biobank, detailed clinical characteristics were not available for further analysis. However, numbers of first-degree relatives with gout were available for gout patients. We therefore examined monocyte-specific associations between DNA methylation at the surviving CpG sites and the number of first-degree relatives with gout, adjusting for sex, age, smoking history (total pack-years), smoking status, alcohol consumption and cell fractions using CellDMC [20] (Supplementary Figure 1, Step Vc).
Author Contributions
CCT, WTL, CJC and SJC conceived the project and designed the experiments. CCT, JHY, CJC and SJC identified and collected patients. CCT, MCW, CJC, SCL, SJC and WTL analysed the data. CCT, WTL and SJC wrote the manuscript. All authors read and approved the final manuscript.
Acknowledgments
The authors would like to thank participants of Taiwan Biobank for their contributions in this study.
Conflicts of Interest
The authors have declared that no conflicts of interest exist.
Funding
This study was supported by Kaohsiung Medical University Hospital (KMUH1088R26) and Ministry of Science and Technology (109-2314-B-037 -123).
References
- 1. Evans PL, Prior JA, Belcher J, Hay CA, Mallen CD, Roddy E. Gender-specific risk factors for gout: a systematic review of cohort studies. Adv Rheumatol. 2019; 59:24. https://doi.org/10.1186/s42358-019-0067-7 [PubMed]
- 2. Jung JY, Choi Y, Suh CH, Yoon D, Kim HA. Effect of fenofibrate on uric acid level in patients with gout. Sci Rep. 2018; 8:16767. https://doi.org/10.1038/s41598-018-35175-z [PubMed]
- 3. Li X, Li L, Xing Y, Cheng T, Ren S, Ma H. Diabetes mellitus is associated with a lower risk of gout: a meta-analysis of observational studies. J Diabetes Res. 2020; 2020:5470739. https://doi.org/10.1155/2020/5470739 [PubMed]
- 4. Oliviero F, Bindoli S, Scanu A, Feist E, Doria A, Galozzi P, Sfriso P. Autoinflammatory mechanisms in crystal-induced arthritis. Front Med (Lausanne). 2020; 7:166. https://doi.org/10.3389/fmed.2020.00166 [PubMed]
- 5. Alberts BM, Bruce C, Basnayake K, Ghezzi P, Davies KA, Mullen LM. Secretion of IL-1β from monocytes in gout is redox independent. Front Immunol. 2019; 10:70. https://doi.org/10.3389/fimmu.2019.00070 [PubMed]
- 6. Abhishek A, Roddy E, Doherty M. Gout - a guide for the general and acute physicians. Clin Med (Lond). 2017; 17:54–59. https://doi.org/10.7861/clinmedicine.17-1-54 [PubMed]
- 7. Tai V, Merriman TR, Dalbeth N. Genetic advances in gout: potential applications in clinical practice. Curr Opin Rheumatol. 2019; 31:144–51. https://doi.org/10.1097/BOR.0000000000000571 [PubMed]
- 8. Kawamura Y, Nakaoka H, Nakayama A, Okada Y, Yamamoto K, Higashino T, Sakiyama M, Shimizu T, Ooyama H, Ooyama K, Nagase M, Hidaka Y, Shirahama Y, et al. Genome-wide association study revealed novel loci which aggravate asymptomatic hyperuricaemia into gout. Ann Rheum Dis. 2019; 78:1430–37. https://doi.org/10.1136/annrheumdis-2019-215521 [PubMed]
- 9. Punzi L, Scanu A, Spinella P, Galozzi P, Oliviero F. One year in review 2018: gout. Clin Exp Rheumatol. 2019; 37:1–11. [PubMed]
- 10. Dalbeth N, Phipps-Green A, Frampton C, Neogi T, Taylor WJ, Merriman TR. Relationship between serum urate concentration and clinically evident incident gout: an individual participant data analysis. Ann Rheum Dis. 2018; 77:1048–52. https://doi.org/10.1136/annrheumdis-2017-212288 [PubMed]
- 11. So A. IL1 inhibition in gout-where are we a decade on? Arthritis Res Ther. 2019; 21:233. https://doi.org/10.1186/s13075-019-2027-3 [PubMed]
- 12. Lee MG, Hsu TC, Chen SC, Lee YC, Kuo PH, Yang JH, Chang HH, Lee CC. Integrative genome-wide association studies of eQTL and GWAS data for gout disease susceptibility. Sci Rep. 2019; 9:4981. https://doi.org/10.1038/s41598-019-41434-4 [PubMed]
- 13. Matsuo H, Yamamoto K, Nakaoka H, Nakayama A, Sakiyama M, Chiba T, Takahashi A, Nakamura T, Nakashima H, Takada Y, Danjoh I, Shimizu S, Abe J, et al. Genome-wide association study of clinically defined gout identifies multiple risk loci and its association with clinical subtypes. Ann Rheum Dis. 2016; 75:652–59. https://doi.org/10.1136/annrheumdis-2014-206191 [PubMed]
- 14. Xavier MJ, Roman SD, Aitken RJ, Nixon B. Transgenerational inheritance: how impacts to the epigenetic and genetic information of parents affect offspring health. Hum Reprod Update. 2019; 25:518–40. https://doi.org/10.1093/humupd/dmz017 [PubMed]
- 15. Wu CC, Hsu TY, Chang JC, Ou CY, Kuo HC, Liu CA, Wang CL, Chuang H, Chen CP, Yang KD. Paternal tobacco smoke correlated to offspring asthma and prenatal epigenetic programming. Front Genet. 2019; 10:471. https://doi.org/10.3389/fgene.2019.00471 [PubMed]
- 16. Li HD, Chen X, Xu JJ, Du XS, Yang Y, Li JJ, Yang XJ, Huang HM, Li XF, Wu MF, Zhang C, Zhang C, Li Z, et al. DNMT3b-mediated methylation of ZSWIM3 enhances inflammation in alcohol-induced liver injury via regulating TRAF2-mediated NF-κB pathway. Clin Sci (Lond). 2020; 134:1935–56. https://doi.org/10.1042/CS20200031 [PubMed]
- 17. Abd El Maksoud AI, Elebeedy D, Abass NH, Awad AM, Nasr GM, Roshdy T, Khalil H. Methylomic changes of autophagy-related genes by Legionella effector Lpg2936 in infected macrophages. Front Cell Dev Biol. 2020; 7:390. https://doi.org/10.3389/fcell.2019.00390 [PubMed]
- 18. Liu Y, Tang H, Liu X, Chen H, Feng N, Zhang J, Wang C, Qiu M, Yang J, Zhou X. Frontline science: reprogramming COX-2, 5-LOX, and CYP4A-mediated arachidonic acid metabolism in macrophages by salidroside alleviates gouty arthritis. J Leukoc Biol. 2019; 105:11–24. https://doi.org/10.1002/JLB.3HI0518-193R [PubMed]
- 19. Stylianou E. Epigenetics of chronic inflammatory diseases. J Inflamm Res. 2018; 12:1–14. https://doi.org/10.2147/JIR.S129027 [PubMed]
- 20. Zheng SC, Breeze CE, Beck S, Teschendorff AE. Identification of differentially methylated cell types in epigenome-wide association studies. Nat Methods. 2018; 15:1059–66. https://doi.org/10.1038/s41592-018-0213-x [PubMed]
- 21. Choi HJ, Moon KW, Kim HO, Lee YA, Hong SJ, Jung JY, Kim HA, Suh CH, Ha YJ, Kim IJ, Lee J, Park EK, Lee SG, et al. Seasonal variations and associated factors of gout attacks: a prospective multicenter study in Korea. J Korean Med Sci. 2020; 35:e133. https://doi.org/10.3346/jkms.2020.35.e133 [PubMed]
- 22. Needhamsen M, Ewing E, Lund H, Gomez-Cabrero D, Harris RA, Kular L, Jagodic M. Usability of human infinium MethylationEPIC BeadChip for mouse DNA methylation studies. BMC Bioinformatics. 2017; 18:486. https://doi.org/10.1186/s12859-017-1870-y [PubMed]
- 23. Yuan FC, Li B, Zhang LJ. Identification of differential modules in ankylosing spondylitis using systemic module inference and the attract method. Exp Ther Med. 2018; 16:149–54. https://doi.org/10.3892/etm.2018.6134 [PubMed]
- 24. So AK, Martinon F. Inflammation in gout: mechanisms and therapeutic targets. Nat Rev Rheumatol. 2017; 13:639–47. https://doi.org/10.1038/nrrheum.2017.155 [PubMed]
- 25. Sil P, Wicklum H, Surell C, Rada B. Macrophage-derived IL-1β enhances monosodium urate crystal-triggered NET formation. Inflamm Res. 2017; 66:227–37. https://doi.org/10.1007/s00011-016-1008-0 [PubMed]
- 26. Shoshan-Barmatz V, Pittala S, Mizrachi D. VDAC1 and the TSPO: expression, interactions, and associated functions in health and disease states. Int J Mol Sci. 2019; 20:3348. https://doi.org/10.3390/ijms20133348 [PubMed]
- 27. Wu KK, Cheung SW, Cheng KK. NLRP3 inflammasome activation in adipose tissues and its implications on metabolic diseases. Int J Mol Sci. 2020; 21:4184. https://doi.org/10.3390/ijms21114184 [PubMed]
- 28. Gil-Kulik P, Świstowska M, Kondracka A, Chomik P, Krzyżanowski A, Kwaśniewska A, Rahnama M, Kocki J. Increased expression of BIRC2, BIRC3, and BIRC5 from the IAP family in mesenchymal stem cells of the umbilical cord wharton’s jelly (WJSC) in younger women giving birth naturally. Oxid Med Cell Longev. 2020; 2020:9084730. https://doi.org/10.1155/2020/9084730 [PubMed]
- 29. Lawlor KE, Feltham R, Yabal M, Conos SA, Chen KW, Ziehe S, Graß C, Zhan Y, Nguyen TA, Hall C, Vince AJ, Chatfield SM, D’Silva DB, et al. XIAP loss triggers RIPK3- and caspase-8-driven IL-1β activation and cell death as a consequence of TLR-MyD88-induced cIAP1-TRAF2 degradation. Cell Rep. 2017; 20:668–82. https://doi.org/10.1016/j.celrep.2017.06.073 [PubMed]
- 30. Cui J, Li M, Liu W, Zhang B, Sun B, Niu W, Wang Y. Liver kinase B1 overexpression controls mycobacterial infection in macrophages via FOXO1/Wnt5a signaling. J Cell Biochem. 2019; 120:224–31. https://doi.org/10.1002/jcb.27322 [PubMed]
- 31. Ratner D, Orning MP, Lien E. Bacterial secretion systems and regulation of inflammasome activation. J Leukoc Biol. 2017; 101:165–81. https://doi.org/10.1189/jlb.4MR0716-330R [PubMed]
- 32. Yao S, Bee A, Brewer D, Dodson A, Beesley C, Ke Y, Ambroisine L, Fisher G, Møller H, Dickinson T, Gerard P, Lian LY, Risk J, et al. PRKC-ζ expression promotes the aggressive phenotype of human prostate cancer cells and is a novel target for therapeutic intervention. Genes Cancer. 2010; 1:444–64. https://doi.org/10.1177/1947601910376079 [PubMed]
- 33. Day P, Burrows L, Richards D, Fountain SJ. Inhibitors of DAG metabolism suppress CCR2 signalling in human monocytes. Br J Pharmacol. 2019; 176:2736–49. https://doi.org/10.1111/bph.14695 [PubMed]
- 34. He J, Zhang B, Gan H. CIDEC is involved in LPS-induced inflammation and apoptosis in renal tubular epithelial cells. Inflammation. 2018; 41:1912–21. https://doi.org/10.1007/s10753-018-0834-3 [PubMed]
- 35. Vasamsetti SB, Coppin E, Zhang X, Florentin J, Koul S, Götberg M, Clugston AS, Thoma F, Sembrat J, Bullock GC, Kostka D, St Croix CM, Chattopadhyay A, et al. Apoptosis of hematopoietic progenitor-derived adipose tissue-resident macrophages contributes to insulin resistance after myocardial infarction. Sci Transl Med. 2020; 12:eaaw0638. https://doi.org/10.1126/scitranslmed.aaw0638 [PubMed]
- 36. Ragu S, Matos-Rodrigues G, Lopez BS. Replication stress, DNA damage, inflammatory cytokines and innate immune response. Genes (Basel). 2020; 11:409. https://doi.org/10.3390/genes11040409 [PubMed]
- 37. Pietrzak J, Płoszaj T, Pułaski Ł, Robaszkiewicz A. EP300-HDAC1-SWI/SNF functional unit defines transcription of some DNA repair enzymes during differentiation of human macrophages. Biochim Biophys Acta Gene Regul Mech. 2019; 1862:198–208. https://doi.org/10.1016/j.bbagrm.2018.10.019 [PubMed]
- 38. Liu D, Zhao L, Wang Z, Zhou X, Fan X, Li Y, Xu J, Hu S, Niu M, Song X, Li Y, Zuo L, Lei C, et al. EWASdb: epigenome-wide association study database. Nucleic Acids Res. 2019; 47:D989–93. https://doi.org/10.1093/nar/gky942 [PubMed]
- 39. Kazmi N, Elliott HR, Burrows K, Tillin T, Hughes AD, Chaturvedi N, Gaunt TR, Relton CL. Associations between high blood pressure and DNA methylation. PLoS One. 2020; 15:e0227728. https://doi.org/10.1371/journal.pone.0227728 [PubMed]
- 40. Lin D, Chen J, Perrone-Bizzozero N, Bustillo JR, Du Y, Calhoun VD, Liu J. Characterization of cross-tissue genetic-epigenetic effects and their patterns in schizophrenia. Genome Med. 2018; 10:13. https://doi.org/10.1186/s13073-018-0519-4 [PubMed]
- 41. Affinito O, Palumbo D, Fierro A, Cuomo M, De Riso G, Monticelli A, Miele G, Chiariotti L, Cocozza S. Nucleotide distance influences co-methylation between nearby CpG sites. Genomics. 2020; 112:144–50. https://doi.org/10.1016/j.ygeno.2019.05.007 [PubMed]
- 42. Hui T, Cao Q, Wegrzyn-Woltosz J, O’Neill K, Hammond CA, Knapp DJ, Laks E, Moksa M, Aparicio S, Eaves CJ, Karsan A, Hirst M. High-resolution single-cell DNA methylation measurements reveal epigenetically distinct hematopoietic stem cell subpopulations. Stem Cell Reports. 2018; 11:578–92. https://doi.org/10.1016/j.stemcr.2018.07.003 [PubMed]
- 43. Martin TC, Yet I, Tsai PC, Bell JT. coMET: visualisation of regional epigenome-wide association scan results and DNA co-methylation patterns. BMC Bioinformatics. 2015; 16:131. https://doi.org/10.1186/s12859-015-0568-2 [PubMed]
- 44. Mallona I, Aussó S, Diez-Villanueva A, Moreno V, Peinado MA. Modular dynamics of DNA co-methylation networks exposes the functional organization of colon cancer cells' genome. bioRxiv. 2020. [Epub ahead of print]. https://www.biorxiv.org/content/10.1101/428730v1.
- 45. Chen Y, Chen A. Unveiling the gene regulatory landscape in diseases through the identification of DNase I-hypersensitive sites. Biomed Rep. 2019; 11:87–97. https://doi.org/10.3892/br.2019.1233 [PubMed]
- 46. Kang H, Shokhirev MN, Xu Z, Chandran S, Dixon JR, Hetzer MW. Dynamic regulation of histone modifications and long-range chromosomal interactions during postmitotic transcriptional reactivation. Genes Dev. 2020; 34:913–30. https://doi.org/10.1101/gad.335794.119 [PubMed]
- 47. Yin Y, Morgunova E, Jolma A, Kaasinen E, Sahu B, Khund-Sayeed S, Das PK, Kivioja T, Dave K, Zhong F, Nitta KR, Taipale M, Popov A, et al. Impact of cytosine methylation on DNA binding specificities of human transcription factors. Science. 2017; 356:eaaj2239. https://doi.org/10.1126/science.aaj2239 [PubMed]
- 48. Kulakovskiy IV, Vorontsov IE, Yevshin IS, Sharipov RN, Fedorova AD, Rumynskiy EI, Medvedeva YA, Magana-Mora A, Bajic VB, Papatsenko DA, Kolpakov FA, Makeev VJ. HOCOMOCO: towards a complete collection of transcription factor binding models for human and mouse via large-scale ChIP-seq analysis. Nucleic Acids Res. 2018; 46:D252–59. https://doi.org/10.1093/nar/gkx1106 [PubMed]
- 49. Chèneby J, Ménétrier Z, Mestdagh M, Rosnet T, Douida A, Rhalloussi W, Bergon A, Lopez F, Ballester B. ReMap 2020: a database of regulatory regions from an integrative analysis of human and arabidopsis DNA-binding sequencing experiments. Nucleic Acids Res. 2020; 48:D180–88. https://doi.org/10.1093/nar/gkz945 [PubMed]
- 50. Schmidt I. Gout - Practicable Interdisciplinary Insights for the Clinician on a Surgeon’s Perspective. J Rheumatol Arthritic Dis. 2018; 3:1–12. https://doi.org/10.15226/2475-4676/3/3/00144
- 51. Ma L, Sun R, Jia Z, Zou Y, Xin Y, Cheng X, Liu T, Cui L, Liu Z, Wu X, Li C. Clinical characteristics associated with subcutaneous tophi formation in Chinese gout patients: a retrospective study. Clin Rheumatol. 2018; 37:1359–65. https://doi.org/10.1007/s10067-017-3969-y [PubMed]
- 52. Ulff-Møller CJ, Asmar F, Liu Y, Svendsen AJ, Busato F, Grønbaek K, Tost J, Jacobsen S. Twin DNA methylation profiling reveals flare-dependent interferon signature and B cell promoter hypermethylation in systemic lupus erythematosus. Arthritis Rheumatol. 2018; 70:878–90. https://doi.org/10.1002/art.40422 [PubMed]
- 53. Lim KH, Park ES, Kim DH, Cho KC, Kim KP, Park YK, Ahn SH, Park SH, Kim KH, Kim CW, Kang HS, Lee AR, Park S, et al. Suppression of interferon-mediated anti-HBV response by single CpG methylation in the 5'-UTR of TRIM22. Gut. 2018; 67:166–78. https://doi.org/10.1136/gutjnl-2016-312742 [PubMed]
- 54. Greenberg MV, Bourc’his D. The diverse roles of DNA methylation in mammalian development and disease. Nat Rev Mol Cell Biol. 2019; 20:590–607. https://doi.org/10.1038/s41580-019-0159-6 [PubMed]
- 55. Hentze JL, Høgdall CK, Høgdall EV. Methylation and ovarian cancer: can DNA methylation be of diagnostic use? Mol Clin Oncol. 2019; 10:323–30. https://doi.org/10.3892/mco.2019.1800 [PubMed]
- 56. So JY, Skrypek N, Yang HH, Merchant AS, Nelson GW, Chen WD, Ishii H, Chen JM, Hu G, Achyut BR, Yoon EC, Han L, Huang C, et al. Induction of DNMT3B by PGE2 and IL6 at distant metastatic sites promotes epigenetic modification and breast cancer colonization. Cancer Res. 2020; 80:2612–27. https://doi.org/10.1158/0008-5472.CAN-19-3339 [PubMed]
- 57. Yagi M, Kabata M, Tanaka A, Ukai T, Ohta S, Nakabayashi K, Shimizu M, Hata K, Meissner A, Yamamoto T, Yamada Y. Identification of distinct loci for de novo DNA methylation by DNMT3A and DNMT3B during mammalian development. Nat Commun. 2020; 11:3199. https://doi.org/10.1038/s41467-020-16989-w [PubMed]
- 58. Yaghjyan L, Colditz G, Rosner B, Rich S, Egan K, Tamimi RM. Adolescent caffeine consumption and mammographic breast density in premenopausal women. Eur J Nutr. 2020; 59:1633–39. https://doi.org/10.1007/s00394-019-02018-0 [PubMed]
- 59. Hutton J, Fatima T, Major TJ, Topless R, Stamp LK, Merriman TR, Dalbeth N. Mediation analysis to understand genetic relationships between habitual coffee intake and gout. Arthritis Res Ther. 2018; 20:135. https://doi.org/10.1186/s13075-018-1629-5 [PubMed]
- 60. Karimi M, Vedin I, Freund Levi Y, Basun H, Faxén Irving G, Eriksdotter M, Wahlund LO, Schultzberg M, Hjorth E, Cederholm T, Palmblad J. DHA-rich n-3 fatty acid supplementation decreases DNA methylation in blood leukocytes: the OmegAD study. Am J Clin Nutr. 2017; 106:1157–65. https://doi.org/10.3945/ajcn.117.155648 [PubMed]
- 61. Iverson C, Bacong A, Liu S, Baumgartner S, Lundström T, Oscarsson J, Miner JN. Omega-3-carboxylic acids provide efficacious anti-inflammatory activity in models of crystal-mediated inflammation. Sci Rep. 2018; 8:1217. https://doi.org/10.1038/s41598-018-19252-x [PubMed]
- 62. Barchitta M, Maugeri A, Magnano San Lio R, Favara G, La Rosa MC, La Mastra C, Quattrocchi A, Agodi A. Dietary patterns are associated with leukocyte LINE-1 methylation in women: a cross-sectional study in Southern Italy. Nutrients. 2019; 11:1843. https://doi.org/10.3390/nu11081843 [PubMed]
- 63. Vedder D, Walrabenstein W, Heslinga M, de Vries R, Nurmohamed M, van Schaardenburg D, Gerritsen M. Dietary interventions for gout and effect on cardiovascular risk factors: a systematic review. Nutrients. 2019; 11:2955. https://doi.org/10.3390/nu11122955 [PubMed]
- 64. Cardenas A, Sordillo JE, Rifas-Shiman SL, Chung W, Liang L, Coull BA, Hivert MF, Lai PS, Forno E, Celedón JC, Litonjua AA, Brennan KJ, DeMeo DL, et al. The nasal methylome as a biomarker of asthma and airway inflammation in children. Nat Commun. 2019; 10:3095. https://doi.org/10.1038/s41467-019-11058-3 [PubMed]
- 65. Domingo-Relloso A, Riffo-Campos AL, Haack K, Rentero-Garrido P, Ladd-Acosta C, Fallin DM, Tang WY, Herreros-Martinez M, Gonzalez JR, Bozack AK, Cole SA, Navas-Acien A, Tellez-Plaza M. Cadmium, smoking, and human blood DNA methylation profiles in adults from the strong heart study. Environ Health Perspect. 2020; 128:67005. https://doi.org/10.1289/EHP6345 [PubMed]
- 66. Xu K, Montalvo-Ortiz JL, Zhang X, Southwick SM, Krystal JH, Pietrzak RH, Gelernter J. Epigenome-wide DNA methylation association analysis identified novel loci in peripheral cells for alcohol consumption among European American male veterans. Alcohol Clin Exp Res. 2019; 43:2111–21. https://doi.org/10.1111/acer.14168 [PubMed]
- 67. Zhu Z, Meng W, Liu P, Zhu X, Liu Y, Zou H. DNA hypomethylation of a transcription factor binding site within the promoter of a gout risk gene NRBP1 upregulates its expression by inhibition of TFAP2A binding. Clin Epigenetics. 2017; 9:99. https://doi.org/10.1186/s13148-017-0401-z [PubMed]
- 68. Wu M, Tian Y, Wang Q, Guo C. Gout: a disease involved with complicated immunoinflammatory responses: a narrative review. Clin Rheumatol. 2020; 39:2849–59. https://doi.org/10.1007/s10067-020-05090-8 [PubMed]
- 69. Moreno-Moral A, Bagnati M, Koturan S, Ko JH, Fonseca C, Harmston N, Game L, Martin J, Ong V, Abraham DJ, Denton CP, Behmoaras J, Petretto E. Changes in macrophage transcriptome associate with systemic sclerosis and mediate GSDMA contribution to disease risk. Ann Rheum Dis. 2018; 77:596–601. https://doi.org/10.1136/annrheumdis-2017-212454 [PubMed]
- 70. Ryaboshapkina M, Hammar M. Tissue-specific genes as an underutilized resource in drug discovery. Sci Rep. 2019; 9:7233. https://doi.org/10.1038/s41598-019-43829-9 [PubMed]
- 71. Joseph S, George NI, Green-Knox B, Treadwell EL, Word B, Yim S, Lyn-Cook B. Epigenome-wide association study of peripheral blood mononuclear cells in systemic lupus erythematosus: identifying DNA methylation signatures associated with interferon-related genes based on ethnicity and SLEDAI. J Autoimmun. 2019; 96:147–57. https://doi.org/10.1016/j.jaut.2018.09.007 [PubMed]
- 72. Webster AP, Plant D, Ecker S, Zufferey F, Bell JT, Feber A, Paul DS, Beck S, Barton A, Williams FM, Worthington J. Increased DNA methylation variability in rheumatoid arthritis-discordant monozygotic twins. Genome Med. 2018; 10:64. https://doi.org/10.1186/s13073-018-0575-9 [PubMed]
- 73. Lin JC, Fan CT, Liao CC, Chen YS. Taiwan biobank: making cross-database convergence possible in the big data era. Gigascience. 2018; 7:1–4. https://doi.org/10.1093/gigascience/gix110 [PubMed]
- 74. Tantoh DM, Wu MF, Ho CC, Lung CC, Lee KJ, Nfor ON, Liaw YC, Hsu SY, Chen PH, Lin C, Chu HW, Liaw YC, Liaw YP. SOX2 promoter hypermethylation in non-smoking Taiwanese adults residing in air pollution areas. Clin Epigenetics. 2019; 11:46. https://doi.org/10.1186/s13148-019-0647-8 [PubMed]
- 75. Kao HW, Pan CY, Lai CH, Wu CW, Fang WL, Huang KH, Lin WC. Urine miR-21-5p as a potential non-invasive biomarker for gastric cancer. Oncotarget. 2017; 8:56389–97. https://doi.org/10.18632/oncotarget.16916 [PubMed]
- 76. Richardson TG, Harrison S, Hemani G, Davey Smith G. An atlas of polygenic risk score associations to highlight putative causal relationships across the human phenome. Elife. 2019; 8:e43657. https://doi.org/10.7554/eLife.43657 [PubMed]
- 77. Jing J, Ekici AB, Sitter T, Eckardt KU, Schaeffner E, Li Y, Kronenberg F, Köttgen A, Schultheiss UT. Genetics of serum urate concentrations and gout in a high-risk population, patients with chronic kidney disease. Sci Rep. 2018; 8:13184. https://doi.org/10.1038/s41598-018-31282-z [PubMed]
- 78. Cadzow M, Merriman TR, Dalbeth N. Performance of gout definitions for genetic epidemiological studies: analysis of UK biobank. Arthritis Res Ther. 2017; 19:181. https://doi.org/10.1186/s13075-017-1390-1 [PubMed]
- 79. Kling T, Wenger A, Beck S, Carén H. Validation of the MethylationEPIC BeadChip for fresh-frozen and formalin-fixed paraffin-embedded tumours. Clin Epigenetics. 2017; 9:33. https://doi.org/10.1186/s13148-017-0333-7 [PubMed]
- 80. Miles F, Mashchak A, Fraser G. Differences in DNA Methylation Patterns Between Vegans and Non-vegetarians in the AHS-2 Cohort (FS11-06-19). Curr Dev Nutr. 2019 (Suppl 1); 3:nzz037.FS11-06-19. https://doi.org/10.1093/cdn/nzz037.FS11-06-19
- 81. Ruzicka WB, Subburaju S, Coyle JT, Benes FM. Location matters: distinct DNA methylation patterns in GABAergic interneuronal populations from separate microcircuits within the human hippocampus. Hum Mol Genet. 2018; 27:254–65. https://doi.org/10.1093/hmg/ddx395 [PubMed]
- 82. Shvetsova E, Sofronova A, Monajemi R, Gagalova K, Draisma HH, White SJ, Santen GW, Chuva de Sousa Lopes SM, Heijmans BT, van Meurs J, Jansen R, Franke L, Kiełbasa SM, et al, and BIOS consortium, and GoNL consortium. Skewed X-inactivation is common in the general female population. Eur J Hum Genet. 2019; 27:455–65. https://doi.org/10.1038/s41431-018-0291-3 [PubMed]
- 83. Cheung K, Burgers MJ, Young DA, Cockell S, Reynard LN. Correlation of infinium HumanMethylation450K and MethylationEPIC BeadChip arrays in cartilage. Epigenetics. 2020; 15:594–603. https://doi.org/10.1080/15592294.2019.1700003 [PubMed]
- 84. Morrison FG, Logue MW, Guetta R, Maniates H, Stone A, Schichman SA, McGlinchey RE, Milberg WP, Miller MW, Wolf EJ. Investigation of bidirectional longitudinal associations between advanced epigenetic age and peripheral biomarkers of inflammation and metabolic syndrome. Aging (Albany NY). 2019; 11:3487–504. https://doi.org/10.18632/aging.101992 [PubMed]
- 85. Johansson A, Palli D, Masala G, Grioni S, Agnoli C, Tumino R, Giurdanella MC, Fasanelli F, Sacerdote C, Panico S, Mattiello A, Polidoro S, Jones ME, et al. Epigenome-wide association study for lifetime estrogen exposure identifies an epigenetic signature associated with breast cancer risk. Clin Epigenetics. 2019; 11:66. https://doi.org/10.1186/s13148-019-0664-7 [PubMed]
- 86. Liu X, Zhang W, Zhao M, Fu L, Liu L, Wu J, Luo S, Wang L, Wang Z, Lin L, Liu Y, Wang S, Yang Y, et al. T cell receptor β repertoires as novel diagnostic markers for systemic lupus erythematosus and rheumatoid arthritis. Ann Rheum Dis. 2019; 78:1070–78. https://doi.org/10.1136/annrheumdis-2019-215442 [PubMed]
- 87. Zhang Z, Zhao L, Wei X, Guo Q, Zhu X, Wei R, Yin X, Zhang Y, Wang B, Li X. Integrated bioinformatic analysis of microarray data reveals shared gene signature between MDS and AML. Oncol Lett. 2018; 16:5147–59. https://doi.org/10.3892/ol.2018.9237 [PubMed]
- 88. Panousis NI, Bertsias GK, Ongen H, Gergianaki I, Tektonidou MG, Trachana M, Romano-Palumbo L, Bielser D, Howald C, Pamfil C, Fanouriakis A, Kosmara D, Repa A, et al. Combined genetic and transcriptome analysis of patients with SLE: distinct, targetable signatures for susceptibility and severity. Ann Rheum Dis. 2019; 78:1079–89. https://doi.org/10.1136/annrheumdis-2018-214379 [PubMed]
- 89. Glastonbury CA, Couto Alves A, El-Sayed Moustafa JS, Small KS. Cell-type heterogeneity in adipose tissue is associated with complex traits and reveals disease-relevant cell-specific eQTLs. Am J Hum Genet. 2019; 104:1013–24. https://doi.org/10.1016/j.ajhg.2019.03.025 [PubMed]
- 90. International Multiple Sclerosis Genetics Consortium. Multiple sclerosis genomic map implicates peripheral immune cells and microglia in susceptibility. Science. 2019; 365:eaav7188. https://doi.org/10.1126/science.aav7188 [PubMed]
- 91. Li D, Hsu S, Purushotham D, Sears RL, Wang T. WashU epigenome browser update 2019. Nucleic Acids Res. 2019; 47:W158–65. https://doi.org/10.1093/nar/gkz348 [PubMed]
- 92. Yates AD, Achuthan P, Akanni W, Allen J, Allen J, Alvarez-Jarreta J, Amode MR, Armean IM, Azov AG, Bennett R, Bhai J, Billis K, Boddu S, et al. Ensembl 2020. Nucleic Acids Res. 2020; 48:D682–88. https://doi.org/10.1093/nar/gkz966 [PubMed]