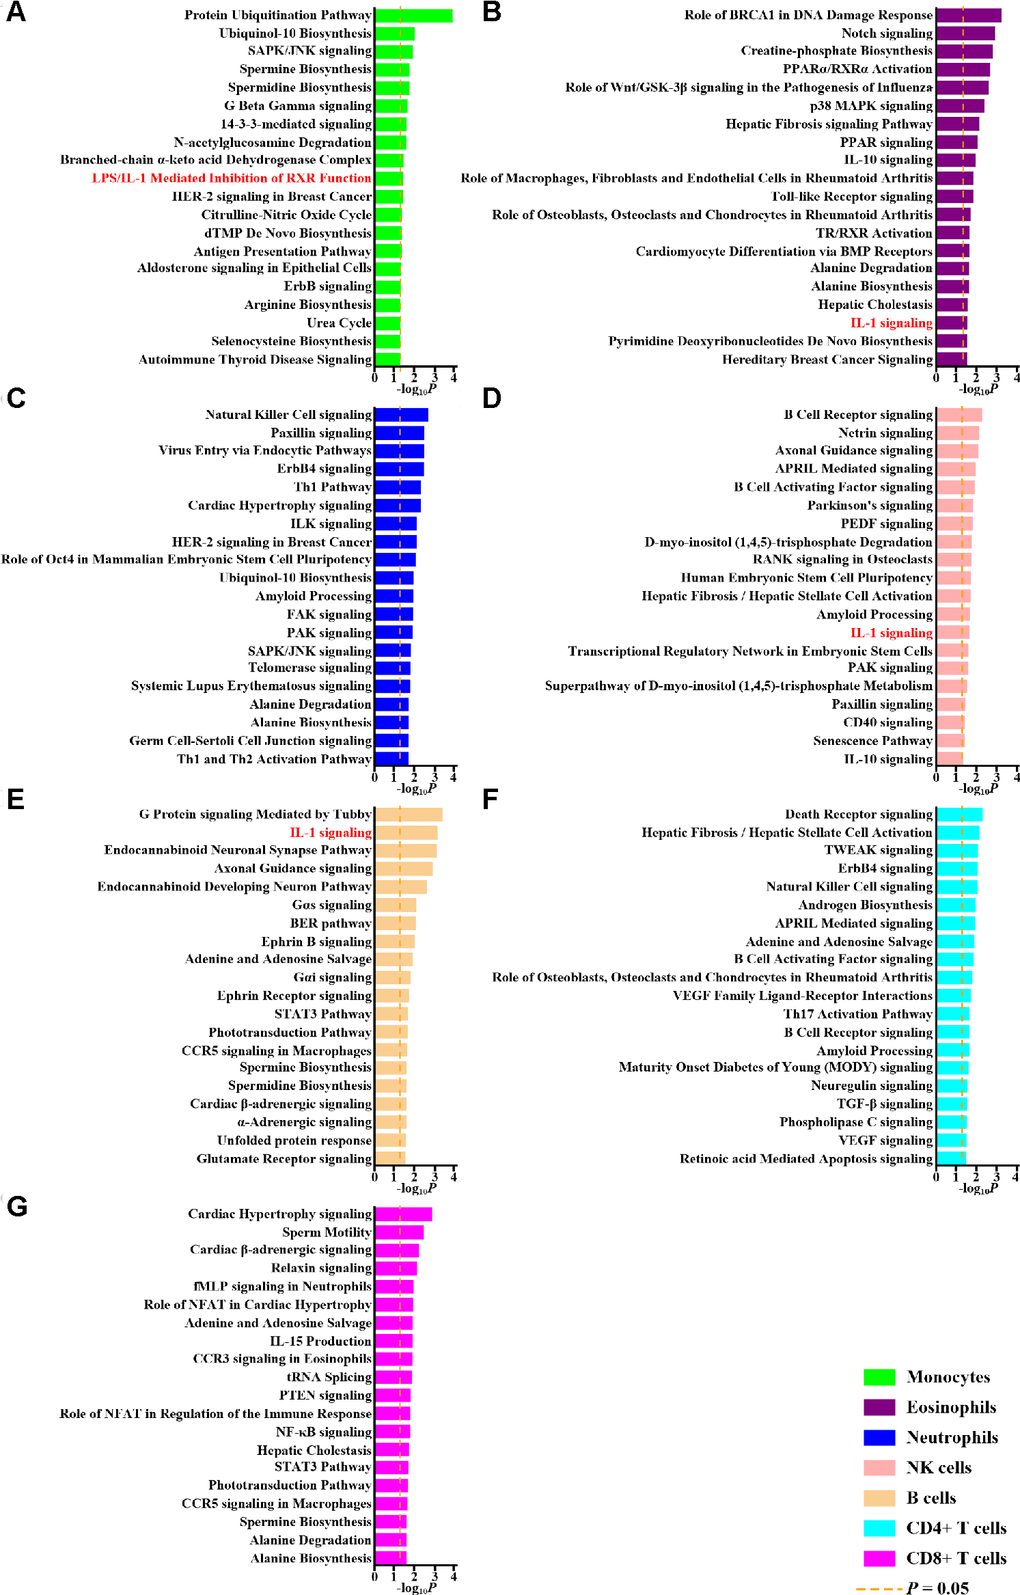
Figure 1.Pathway analysis of differentially methylated genes. The top 20 pathways of differentially methylated genes in monocytes (A), eosinophils (B), neutrophils (C), NK cells (D), B cells (E), CD4+ T cells (F) and CD8+ T cells (G) revealed by Ingenuity Pathway Analysis and corresponding P values are shown. The dashed orange lines represent P values of 0.05. Pathways related to interleukin-1 (IL-1) are highlighted with red.