


Introduction
Gastric cancer (GC) is the fifth most common malignancy and the third leading cause of cancer-related deaths worldwide [1]. Based on The Cancer Genome Atlas (TCGA) molecular characterizations, GC can be categorized into four subtypes: Epstein-Barr virus (EBV, 9%), microsatellite instability-high (MSI-H, 22%), genomically stable (GS, 20%), and chromosomal instability (CIN, 50%) [2]. These subtypes are strongly associated with patients' survival outcome [3].
Microsatellites, short tandem DNA sequence repeats, are widely distributed throughout the genome. Due to de-regulation in the DNA mismatch-repair (MMR) genes and proteins, these tandem repeats are prone to insertion-deletion events, causing microsatellite instability (MSI). Clinically, a tumor harboring two or more altered dinucleotide repeats in the microsatellite region is termed as MSI-H, while in other cases it is either termed as microsatellite instability-low or microsatellite stable (MSI-L/MSS) [4, 5].
Using MSI as a predictive value, especially in the early stage GC, patients with MSI-H status showed better survival outcomes compared to those with MSS [6, 7]. Moreover, therapeutically, patients with MSI-H tumors may benefit with PD-1 pathway blockade, and the MSI status also has been considered by the FDA as an indication for pembrolizumab treatments [8]. Despite these encouraging results, a significant proportion of MSI-H GC patients remain insensitive to immunotherapy [9], which necessitates the identification of molecular biomarkers for the prognostic screening of GC patients with MSI-H status.
Here, using TCGA datasets, we performed a differential gene expression analysis using IRGs in GC patients with MSI-H or MSI-L/MSS status. The selected genes were further analyzed using univariate and multivariate Cox regression analyses to establish their correlation with disease prognosis. Furthermore, we rigorously explored the expression status and prognostic landscape of IRGs and constructed an individualized risk-stratification model for MSI-H or MSI-L/MSS patients, respectively. And, we also explored the underlying transcriptional regulation of IRGs and their utility as prognostic signatures. Taken together, the risk-stratification model proposed in our study offers a foundation for subsequent immune-related work, which nevertheless requires further evaluation in clinics before consideration for prognosis of patients with gastric cancer.
Results
Identification of differentially expressed immune-related genes (IRGs) in MSI-H samples of gastric cancer (GC)
Gene expression data analysis of the 374 GC patient samples with variable MSI status allowed identification of 5268 differentially expressed genes (DEGs) which met the statistical threshold criteria. Amongst these, 540 genes were up-regulated while 4728 genes were significantly down-regulated in the MSI-H patient samples as compared to the MSI-L/MSS.(Figure 1A, 1B) And of these, 289 DEGs were screened as immune-related genes. (Figure 1C, 1D).
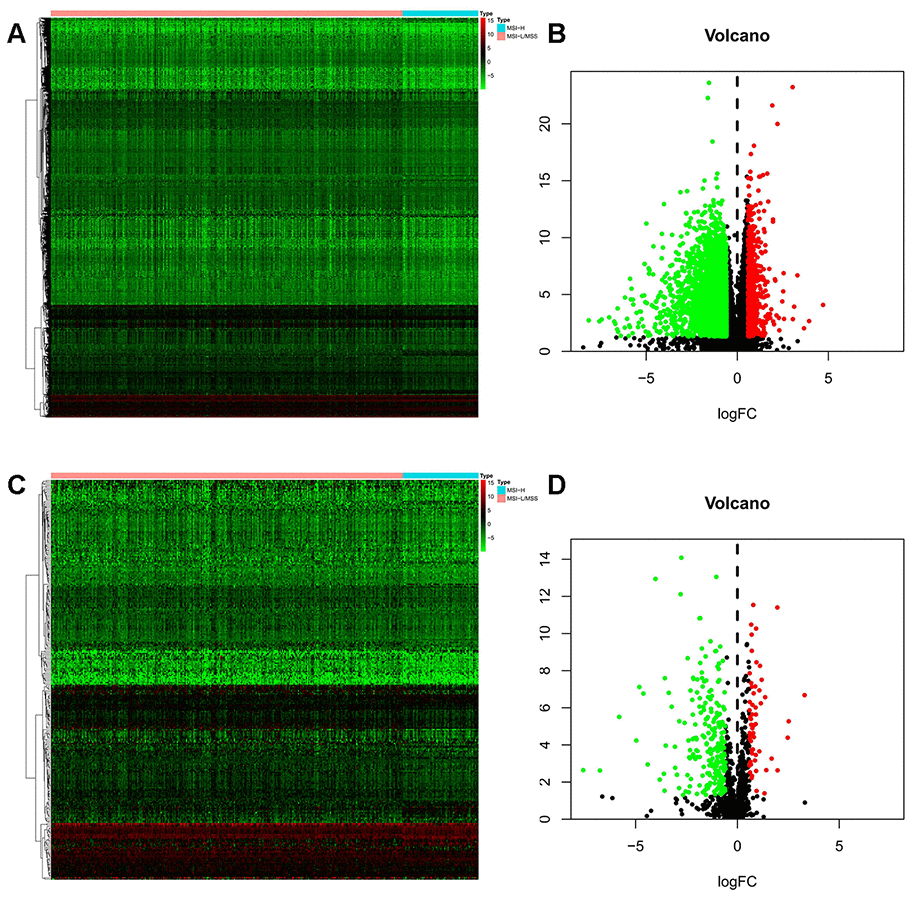
Figure 1. Differentially expressed immune-related genes (IRGs). (A, B) Heatmap and volcano plot of the upregulated (red) and downregulated (green) genes between the MSI-L/MSS and MSI-H samples of gastric cancer. (C, D) Profiling data of the IRGs are shown in heatmap and volcano plot, red dots represent upregulated and green dots represent downregulated. (MSI-H, microsatellite instability-high status; MSI-L, microsatellite instability-low status; MSS, microsatellite stable).
Prognostic value of genes in gastric cancer
To assess the predictive value for OS, we performed univariate Cox regression analysis for all the differentially expressed IRGs between the MSI-L/MSS or MSI-H samples. Our analysis identified 10 and 46 genes as prognostic factors in MSI-L/MSS (Figure 2A) and MSI-H (Figure 2B) GC patients, respectively.
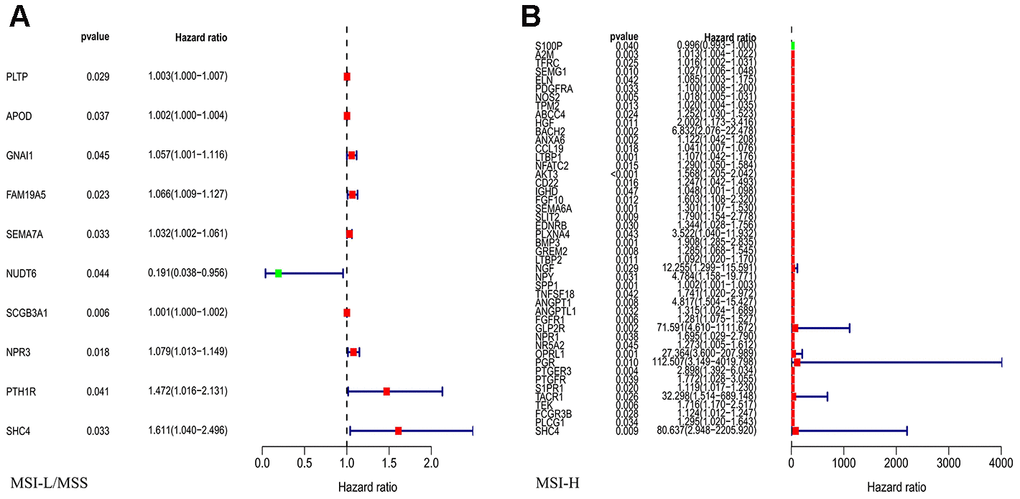
Figure 2. Univariate Cox regression analysis for the IRGs in MSI-L/MSS (A) or MSI-H (B) samples of gastric cancer to assess the prognostic value.
Prognostic model construction in GC
The prognostic factors for OS identified by univariate Cox analysis were further analyzed in a multivariate Cox model. As a result, 6 and 46 genes were separately selected to further establish a predictive model in MSI-L/MSS patients or MSI-H patients. The prognostic risk score for MSI -L/MSS samples were determined using the formula below: Risk score = 0.028771494*(expression of SEMA7A) + (-2.12419407)*(expression of NUDT6) + 0.001719489*(expression of SCGB3A1) + 0.074754971*(expression of NPR3) + 0.348798938*(expression of PTH1R) + 0.501115829*(expression of SHC4). MSI-L/MSS patients were divided into low-risk and high-risk groups according to the median prognostic risk score. (Figure 3A) Patients’ survival status indicated that high-risk patients tended to have a worse prognosis than low-risk patients. (Figure 3A) The five prognostic genes (SEMA7A, SCGB3A1, NPR3, PTH1R, and SHC4) were more enriched in the high-risk group affirmed that they were all independent risk factors while the lower enriched gene (NUDT6) was a protective factor. (Figure 3A) The model was significantly associated with OS in MSI-L/MSS samples (p<0.01), with the higher survival rates in low-risk group than high-risk group. (Figure 3B) The AUC of the 1, 3, and 5-year survival were 0.624 (Figure 3C), 0.7 and 0.729. (Supplementary Figure 1A, 1B)
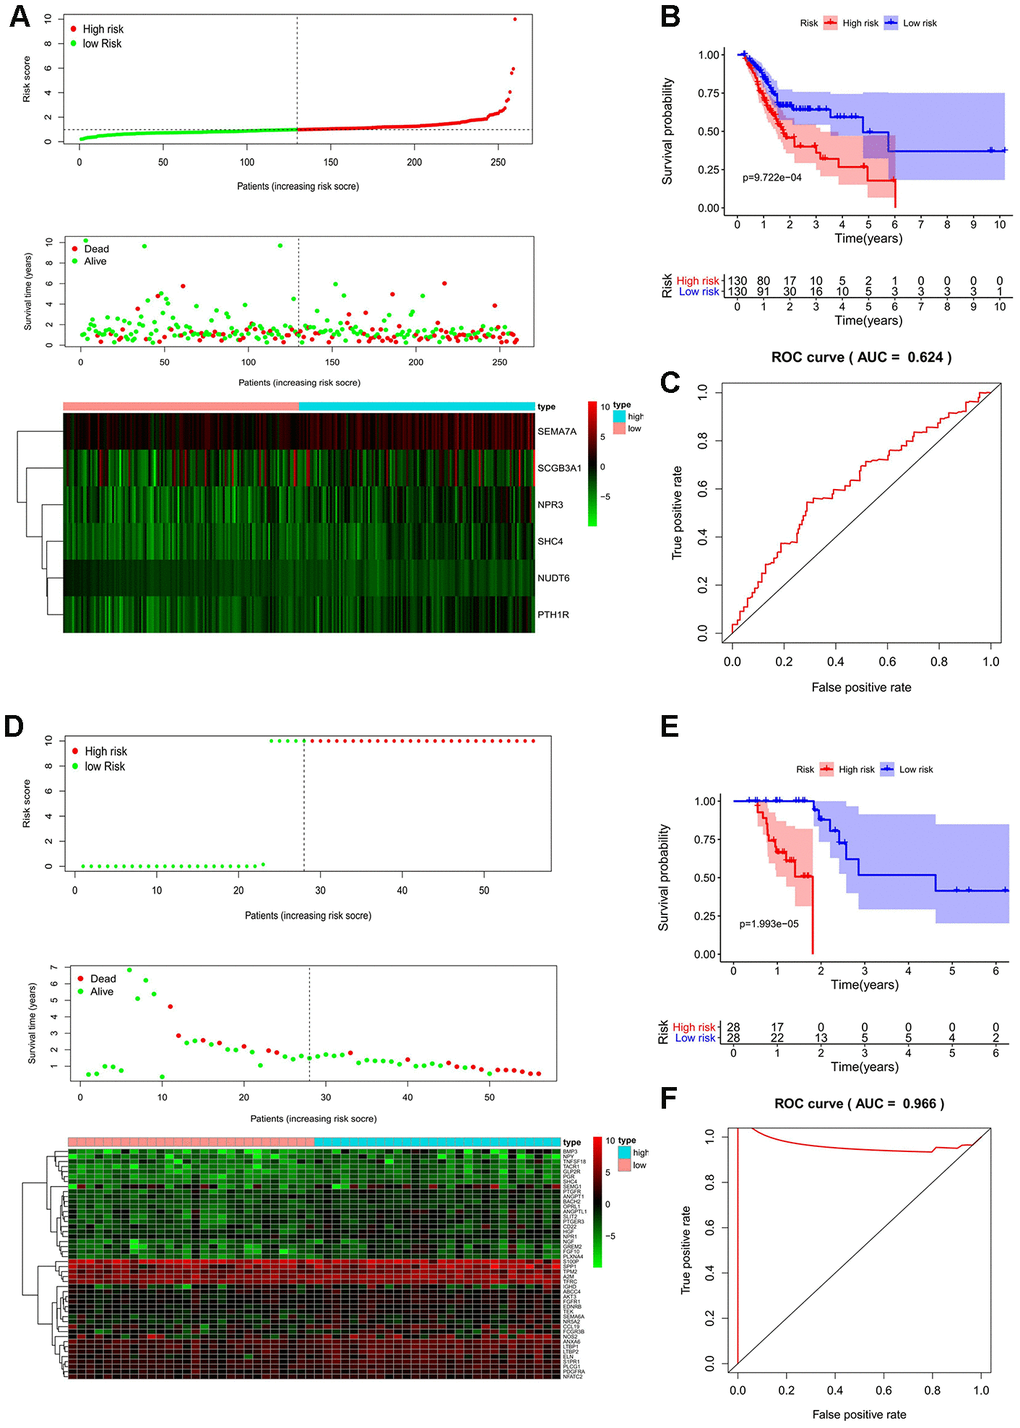
Figure 3. Prognostic analyses used risk score model. Candidate genes selected by univariate Cox regression were further analyzed in a multivariate Cox model for all MSI-L/MSS and MSI-H samples. The 17 prognostic genes of MSH patients determined by univariate Cox regression and Kaplan-Meier survival analysis were analyzed in a multivariate Cox model and 3 genes were acquired to construct a predictive model. (A, D, G) The distribution of risk score, survival status, and expression heat map. (B, E, H) The Kaplan-Meier curves for low-risk and high-risk groups. (C, F, I) The ROC curves for predicting OS by the risk score. AUC, area under the curve; ROC, receiver operator characteristic; OS, overall survival.
Candidate genes selected by univariate Cox regression were further analyzed in a multivariate Cox model for all MSI-L/MSS and MSI-H samples. The 17 prognostic genes of MSH patients determined by univariate Cox regression and Kaplan-Meier survival analysis were analyzed in a multivariate Cox model and 3 genes were acquired to construct a predictive model. (A, D, G) The distribution of risk score, survival status, and expression heat map. (B, E, H) The Kaplan-Meier curves for low-risk and high-risk groups. (C, F, I) The ROC curves for predicting OS by the risk score. AUC, area under the curve; ROC, receiver operator characteristic; OS, overall survival.
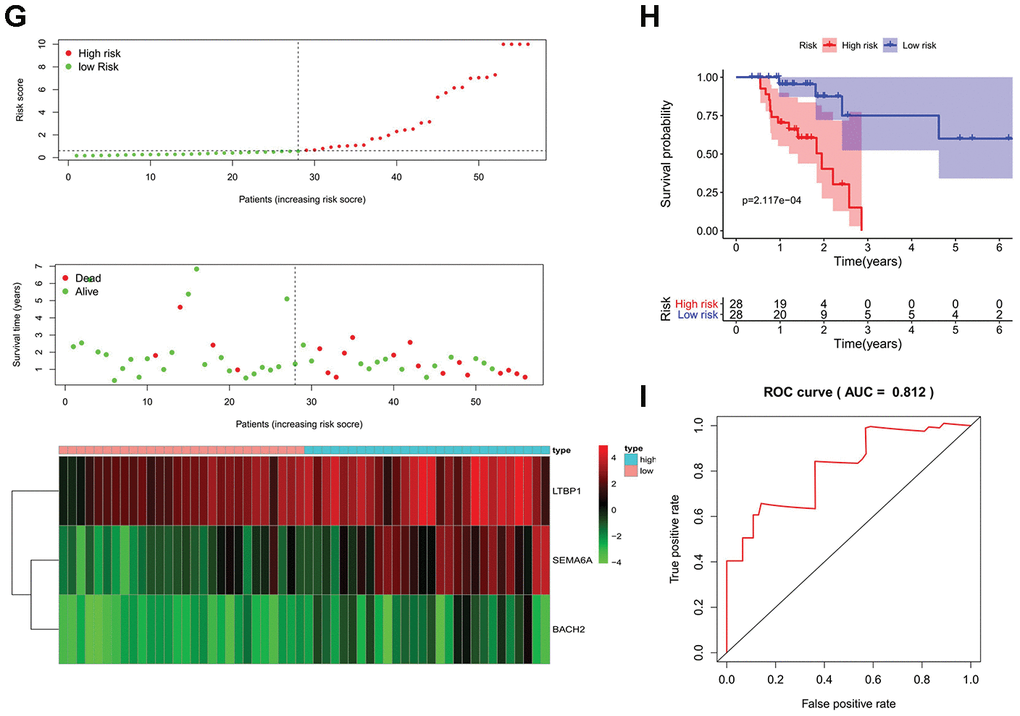
Figure 3. Prognostic analyses used risk score model. Candidate genes selected by univariate Cox regression were further analyzed in a multivariate Cox model for all MSI-L/MSS and MSI-H samples. The 17 prognostic genes of MSH patients determined by univariate Cox regression and Kaplan-Meier survival analysis were analyzed in a multivariate Cox model and 3 genes were acquired to construct a predictive model. (A, D, G) The distribution of risk score, survival status, and expression heat map. (B, E, H) The Kaplan-Meier curves for low-risk and high-risk groups. (C, F, I) The ROC curves for predicting OS by the risk score. AUC, area under the curve; ROC, receiver operator characteristic; OS, overall survival.
Next, a similar predictive model was established for patients with MSI-H status, (Figure 3D–3F). Furthermore, a newer reliable optimization model was established for increasing the stability of the model. Using this model, we observed that 17 of 46 prognostic genes analyzed by Kaplan-Meier survival were independent predictors of survival in GC patients with MSI-H (Supplementary Figure 2). These predictor genes were further analyzed using multivariate Cox regression model, and 3 genes were used to construct a predictive model based on the formula: Risk score = 0.363097478913475*(expression of SEMA6A) + 0.0923759499631374*(expression of LTBP1) + 1.84905247199979*(expression of BACH2). MSI-H patients were divided into low-risk and high-risk groups according to the median prognostic risk score (Figure 3G). And the survival analysis suggests that patients in high-risk group had an increased mortality risk (Figure 3G). The three prognostic genes were enriched in the high-risk group, suggesting that they were risk factors. (Figure 3G) The Kaplan-Meier curve showed higher survival rates in the low-risk group compared to the high-risk group. (Figure 3H) The AUC values of 1, 3, and 5 year survival of the model were 0.812, 0.891, and 0.832, respectively (Figure 3I, Supplementary Figure 1C, 1D), indicating that the predictive model had a high sensitivity and specificity.
Validation of predictive model (risk score)
Our univariate Cox regression analysis suggests a significant association of risk score with overall survival (OS) of GC patients in both MSI-L/MSS (P<0.001, Figure 4A) and MSI-H (P<0.001, Figure 4B). Furthermore, the multivariate regression Cox analysis suggests that risk score (Figure 4C), age and tumor grade are important factors that correlate with survival outcome in patients with MSI-L/MSS. Whereas, in case of MSI-H patients, only risk score (Figure 4D) and age serve as independent predictors of overall survival of the GC patients. And, both these analyses demonstrate the effective prognostic prediction by our model.
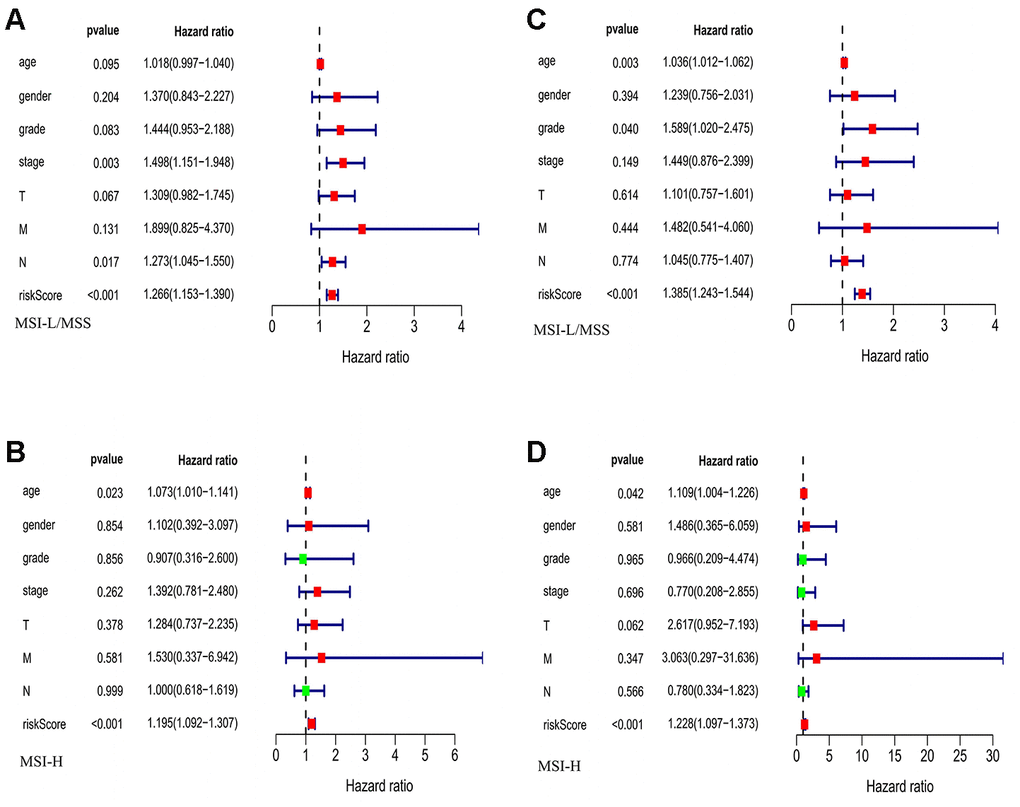
Figure 4. The evaluation of the risk score and other clinicopathological factors. (A, B) The Univariate regression analysis in MSI-L/MSS samples and MSI-H samples. (C, D) The multiple regression analysis in MSI-L/MSS samples and MSI-H samples.
Validation of immune cell infiltration for prognostic IRGs
To verify the prognostic immune-related gene, we investigated the correlation between IRGs and immune cell infiltration via TIMER. As expected, factors in the two prognostic models had different immune infiltration conditions. The five prognostic genes of MSI-L patients have poor correlation with immune infiltration. In addition, there was good agreement between SCH4 and PTH1R which had no correlation with Neutrophil and CD8+ T Cell. (Table 1, Figure 5A–5E) However, three prognostic genes for MSI-H patients were significantly correlated with immune infiltration. (Table 1, Figure 5F–5H).
Table 1. Correlation of prognostic IRGs expression with immune infiltration level.
| Gene | B Cell | CD8+ T Cell | CD4+ T Cell | Macrophage | Neutrophil | Dendritic Cell | |||||||||||||||||||||||||||||||||||||||||||||||||||||||||||||||||||||||||||||||||||||||||||||
| Cor 1 | p | Cor 1 | p | Cor 1 | p | Cor 1 | p | Cor 1 | p | Cor 1 | p | ||||||||||||||||||||||||||||||||||||||||||||||||||||||||||||||||||||||||||||||||||||||||
| MSI-L | PTH1R | 0.109 | <0.05 | 0.078 | 0.132 | 0.439 | <0.05 | 0.521 | <0.05 | 0.084 | 0.105 | 0.226 | <0.05 | ||||||||||||||||||||||||||||||||||||||||||||||||||||||||||||||||||||||||||||||||||||||
| SHC4 | 0.166 | <0.05 | 0.069 | 0.185 | 0.424 | <0.05 | 0.521 | <0.05 | 0.080 | 0.123 | 0.240 | <0.05 | |||||||||||||||||||||||||||||||||||||||||||||||||||||||||||||||||||||||||||||||||||||||
| NPR3 | 0.068 | 0.195 | 0.142 | <0.05 | 0.271 | <0.05 | 0.499 | <0.05 | 0.140 | <0.05 | 0.292 | <0.05 | |||||||||||||||||||||||||||||||||||||||||||||||||||||||||||||||||||||||||||||||||||||||
| NUDT6 | -0.076 | 0.148 | 0.050 | 0.340 | -0.041 | 0.437 | -0.042 | 0.418 | 0.124 | <0.05 | 0.076 | 0.145 | |||||||||||||||||||||||||||||||||||||||||||||||||||||||||||||||||||||||||||||||||||||||
| SCGB3A1 | 0.143 | <0.05 | -0.009 | 0.860 | 0.067 | 0.198 | 0.009 | 0.859 | -0.063 | 0.226 | -0.061 | 0.245 | |||||||||||||||||||||||||||||||||||||||||||||||||||||||||||||||||||||||||||||||||||||||
| SEMA7A | 0.031 | 0.559 | 0.193 | <0.05 | 0.200 | <0.05 | 0.164 | <0.05 | 0.269 | <0.05 | 0.305 | <0.05 | |||||||||||||||||||||||||||||||||||||||||||||||||||||||||||||||||||||||||||||||||||||||
| MSI-H | BACH2 | 0.281 | <0.05 | 0.230 | <0.05 | 0.580 | <0.05 | 0.461 | <0.05 | 0.268 | <0.05 | 0.414 | <0.05 | ||||||||||||||||||||||||||||||||||||||||||||||||||||||||||||||||||||||||||||||||||||||
| LTBP1 | 0.176 | <0.05 | 0.183 | <0.05 | 0.507 | <0.05 | 0.637 | <0.05 | 0.202 | <0.05 | 0.410 | <0.05 | |||||||||||||||||||||||||||||||||||||||||||||||||||||||||||||||||||||||||||||||||||||||
| SEMA6A | 0.242 | <0.05 | -0.191 | <0.05 | 0.368 | <0.05 | 0.240 | <0.05 | -0.161 | <0.05 | -0.059 | 0.253 | |||||||||||||||||||||||||||||||||||||||||||||||||||||||||||||||||||||||||||||||||||||||
| Abbreviations: 1 Correlation coefficient. | |||||||||||||||||||||||||||||||||||||||||||||||||||||||||||||||||||||||||||||||||||||||||||||||||||
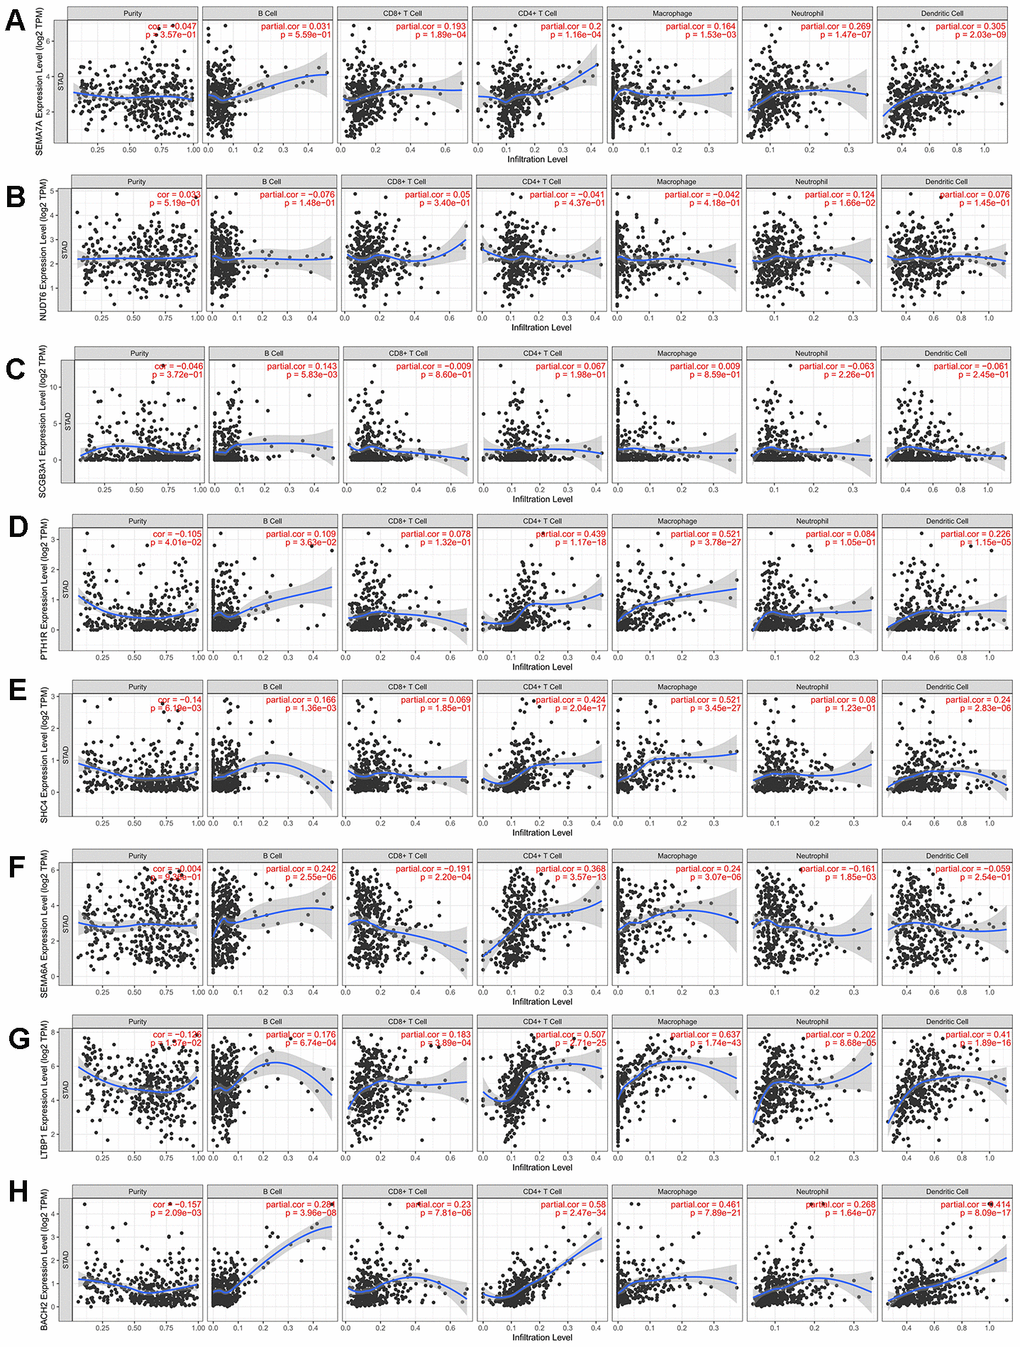
Figure 5. Correlation between prognosis immune-related genes and immune cell infiltration. (A–E) Expression levels of 5 prognosis immune-related genes for MSI-L patients have poor correlation with immune infiltration. (F–H) Three prognostic genes for MSI-H patients were significantly correlated with immune infiltration.
TF regulatory network
To investigate the potential molecular mechanisms of prognostic IRGs, we examined the expression profiles of transcription factors (TFs) and found that 51 were differentially expressed between MSI-H and MSI-L/MSS patients (Figure 6A, 6B). Further, we established the TF-gene regulatory network based on the correlation between TFs and prognostic genes (correlation score >0.4, P<0.01, Figure 6C, 6D).
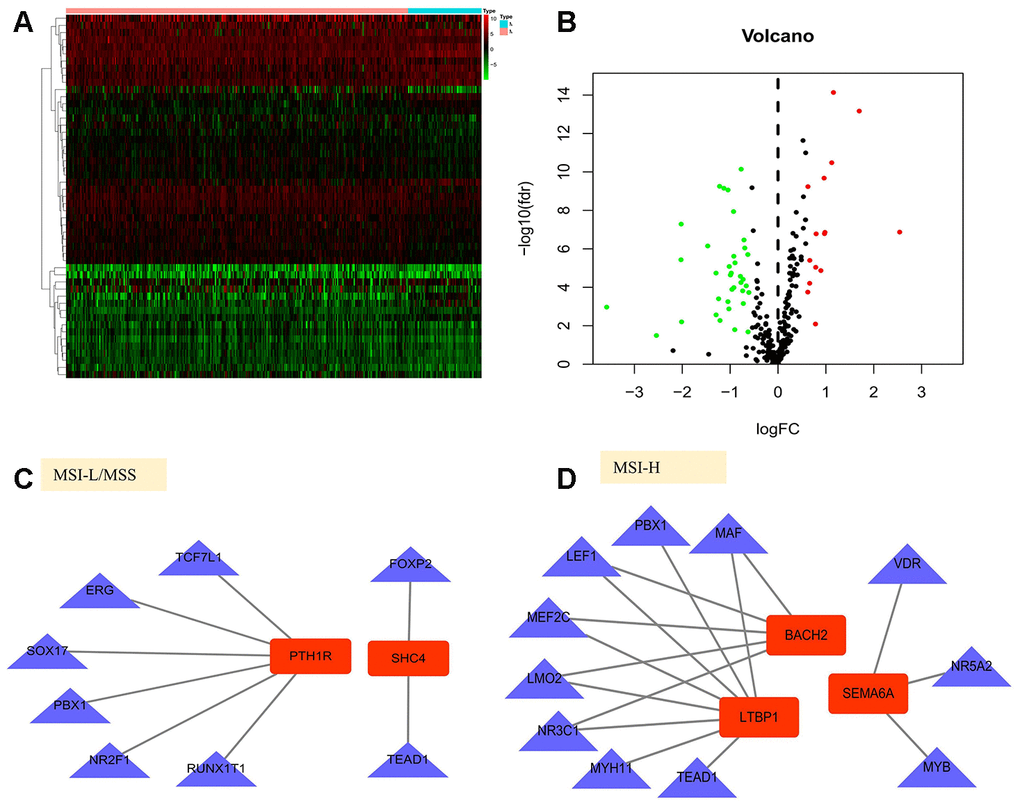
Figure 6. Gene regulatory network in gastric cancer. (A, B) Heatmap and volcano plot of the upregulated (red) and downregulated (green) transcription factors(TFs) between the MSI-L/MSS and MSI-H samples of gastric cancer. (C, D) TF-gene regulation networks in MSI-L/MSS or MSI-H samples. Red node stands for the hub gene and blue triangle stands for the transcription factor.
Clinical evaluation of SHC4/PTH1R for MSI-L/MSS patients
In the TF-IRG network, only SHC4 and PTH1R have connections with TF. In addition, for immune infiltration, there was good agreement between SCH4 and PTH1R which had no correlation with Neutrophil and CD8+ T Cell. The survival analysis suggests that in case of MSI-L/MSS patients, SHC4 and PTH1R can serve as risk factors (Figure 7A, 7B). Furthermore, patients with grade 3 (P=0.009) and T3+T4 stage (P=0.098) tumors showed increased expression levels of SHC4 (Figure 7C). Whereas, PTH1R was highly expressed only in patients with grade 3 tumors (P=0.003, Figure 7D).
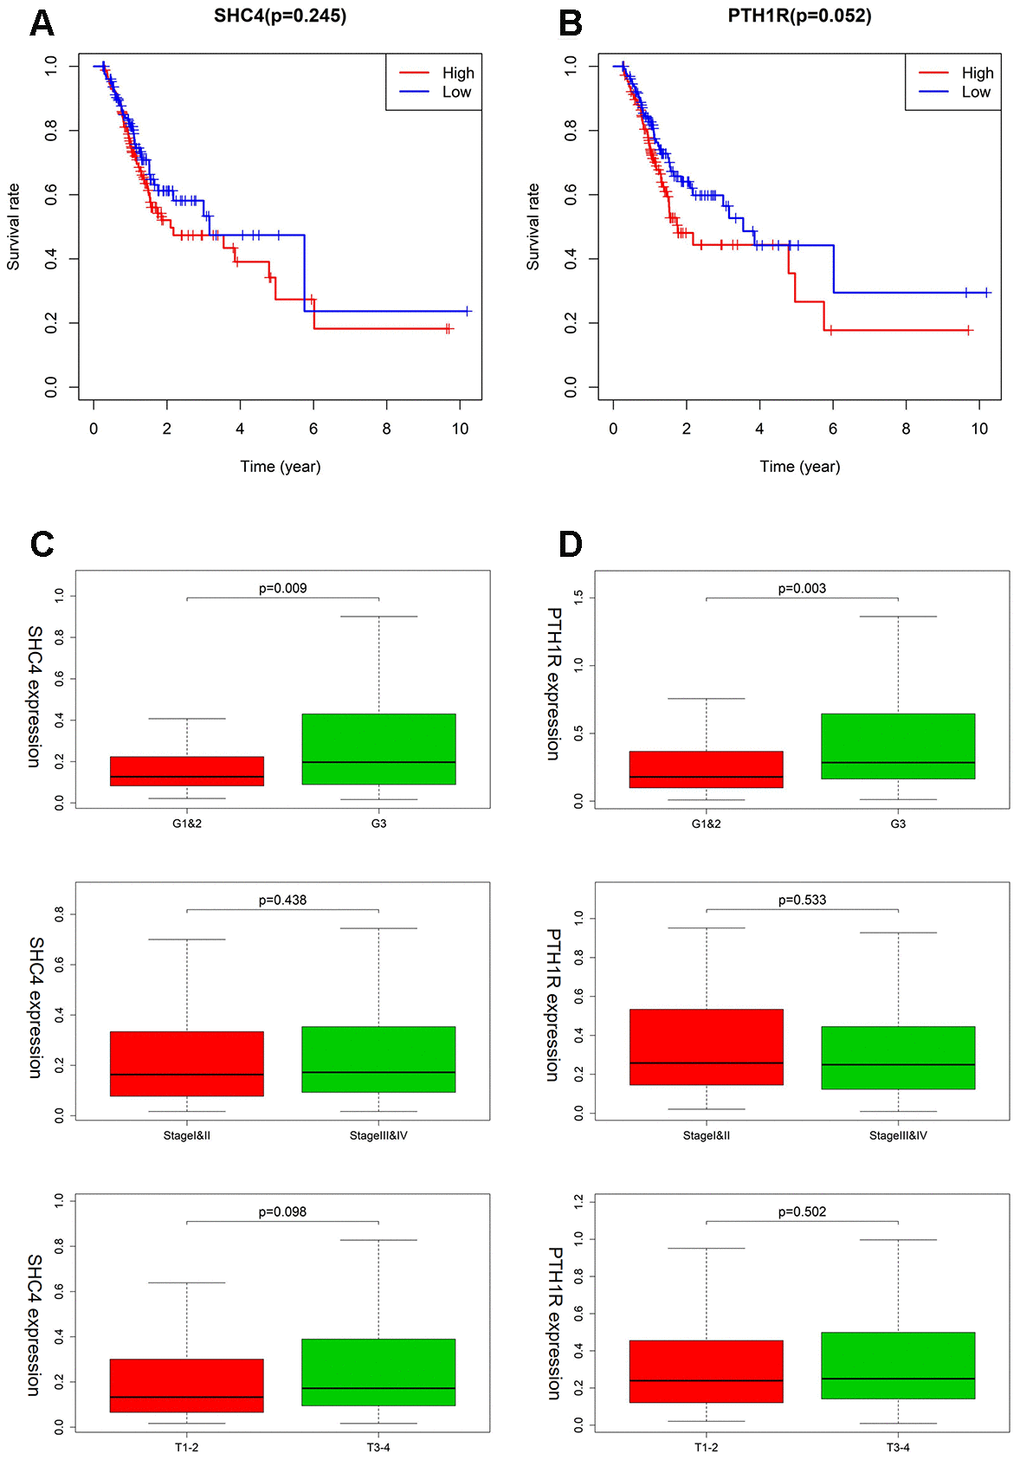
Figure 7. The clinical evaluation of SHC4/PTH1R for MSI-L/MSS patients. (A, B) Kaplan–Meier survival curves for SHC4/PTH1R in MSI-L/MSS patients. (C, D) Expression of SHC4/PTH1R in different grade stage, clinical stage, and T stage groups for MSI-L/MSS patients.
Clinical utility of prognostic signature (LTBP1, SEMA6A, and BACH2) for MSI-H patients
As shown in Figure 8A, higher expression of LTBP1, SEMA6A, BACH2 was significantly related to worse OS (Figure 8A–8C). LTBP1 displayed an upregulated status in MSI-H patients with worsening tumor status, including the Grade 3 (P =0.334), stage III/IV (P =0.245), and T3 + T4 stage (P = 0.236) (Figure 8D). For SEMA6A, higher expression was observed in patients with stage III/IV (P =0.363) and T3 + T4 stage (P = 0.366), but it showed a lower expression in the Grade 3 group. (Figure 8E) BACH2 showed an increased expression in GC patients with grade 3 (P=0.021) and T3+T4 stage (P=0.038) tumors (Figure 8F).
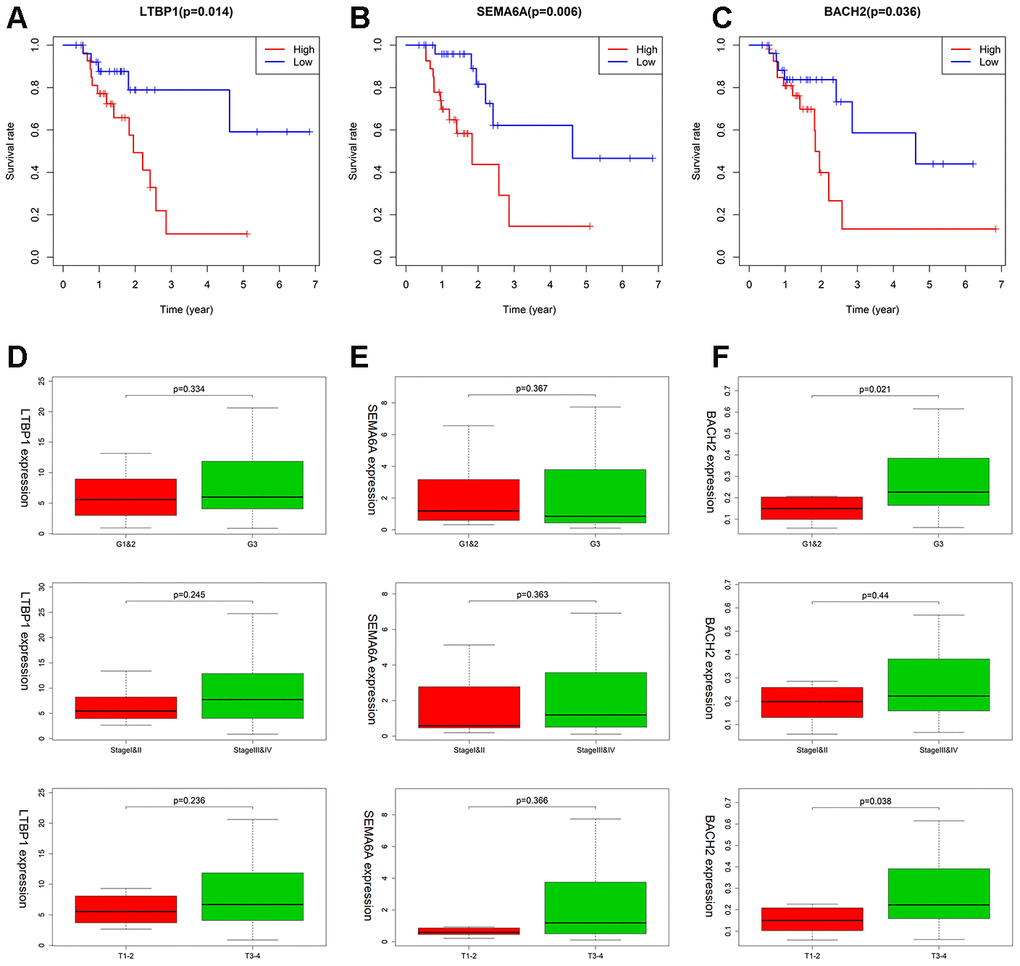
Figure 8. The association between LTBP1, SEMA6A, and BACH2 expression and different clinical signatures in MSI-H samples. (A–C) Kaplan–Meier survival curves for LTBP1, SEMA6A, and BACH2 in MSI-H samples. (D–F) Expression of LTBP1, SEMA6A, and BACH2 in different grade stage, clinical stage, and T stage groups.
Discussion
Although surgical resection, chemotherapy, and targeted therapy are effective treatment methods, tumor recurrence and metastasis post treatment result in poor prognosis of gastric cancer [10–12]. Studies have shown that both tumor staging and heterogeneous molecular characterization could affect survival of GC patients [3, 13]. Currently, there are two comprehensive molecular subtypes of gastric cancer established by The Cancer Genome Atlas (TCGA) and the Asian Cancer Research Group (ACRG) [2, 13]. Of note, in either of the classifications, MSI-H was described as a significant subgroup with specific histopathological features and better prognosis [2, 3, 13].
As evident from a retrospective study, GC patients with MSI-H have a better prognosis only for stage II tumors [6]. The results of the MAGIC trial suggest that compared to patients with MSI-L/MSS, the ones with MSI-H status have better overall survival outcomes when treated with surgery alone as opposed to combined treatment with chemotherapy and surgery [14]. These results are consistent with other retrospective studies having GC patients harboring MSI-H stage II and III tumors [7, 15]. Interestingly, the MAGIC trial also indicates that the MSI-H tumors show abundant immune infiltration [14], suggesting that they could serve as better candidates to check the efficacy of the immune checkpoint blockade therapies [16, 17]. Perhaps because of the small sample size of this study, the efficacy of checkpoint inhibitors in MSI-H GC is not satisfactory [18, 19].
Although several studies discuss the prognostic significance of MSI-associated genes in GC [20], our study focused on identifying an immune-related gene expression signature where we have screened and analyzed all the DEGs between MSI-H and MSI-L/MSS patient samples to build a risk model and allow better prediction of patient prognosis. And the genes identified in MSI -L/MSS samples and MSI-H samples were totally different. Moreover, the unique signature patterns for each of these subtypes identified in our study predicted prognosis of patients with high accuracy. Furthermore, based on this model, we constructed a TF-IRG regulatory network to understand the underlying molecular mechanisms to help delineate their potential use in the clinics. Furthermore, GSEA indicated that these prognostic genes are strongly associated with different pathway, which accounted for the different oncogenic mechanisms. And our analysis provides distinct gene signatures for the MSI-H (LTBP1, SEMA6A, BACH2) and MSI-L/MSS (SHC4, PTH1R) patients, which could serve as potential candidates in the clinics. (Figure 9).
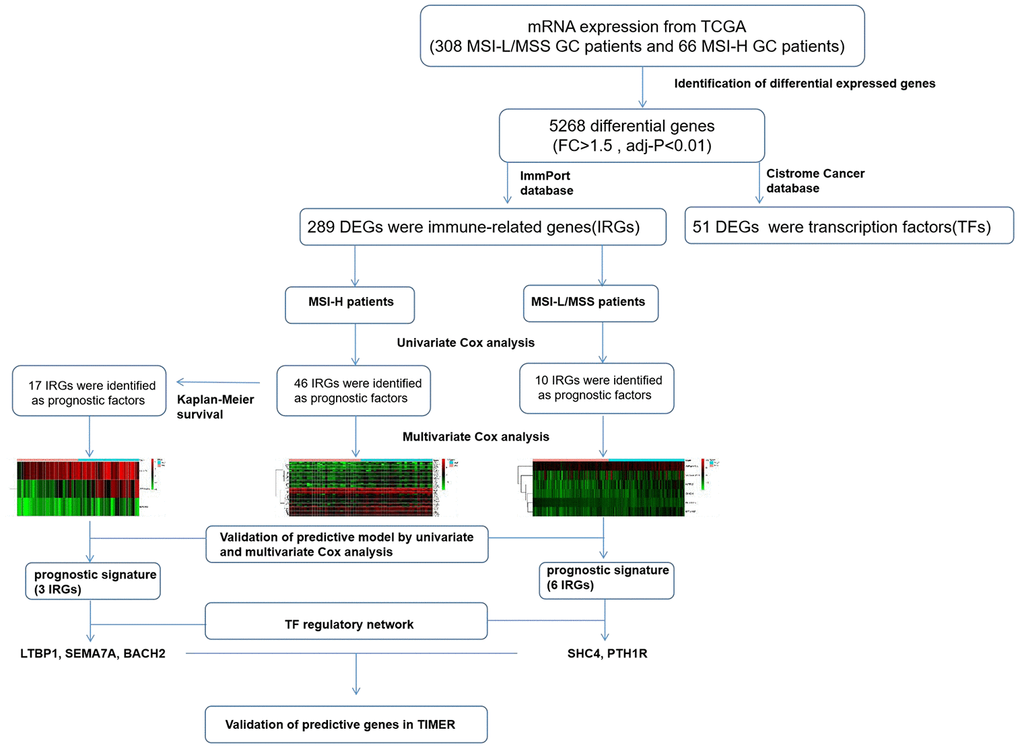
Figure 9. The workflow of construction and validation of the immune signature.
In case of the MSI-L/MSS subgroup, the significantly de-regulated gene PTH1R a member of the GPCR family of proteins, is defined as a type 1 parathyroid hormone receptor [21], which serves as an oncogene in breast cancer as silencing of PTH1R suppressed cell proliferation and induced apoptosis in breast cancer cells [22]. Furthermore, the co-expression of elevated levels of parathyroid hormone-related peptide (PTHrP) and PTH1R significantly correlated with cancer metastasis and mortality in patients with lung adenocarcinoma [23]. The results of our study are consistent with those reported by previous studies, where we observe that increased expression of the PTH1R correlated with an advanced tumor grade 3 and elevated mortality risk. However, these results are in contrast to another study with hepatocellular carcinoma where decreased expression of PTH1R was significantly associated with large tumor size and poor overall survival [24].
For MSI-H patients, our analysis indicated that the BACH2 gene was significantly up-regulated and correlated with high grade tumor (Grade 3 and T3+T4) and poor survival outcome in patients. BACH2 encodes a B-cell-specific transcription factor which plays an important role in regulating immune homeostasis and inflammatory responses. However, the role of BACH2 in tumorigenesis remains controversial and alters as per tissue and cancer type [25, 26, 27, 28]. For instance, BACH2 has been shown to function as tumor suppressor in mantle cell lymphoma (MCL) and diffuse large B-cell lymphoma (DLBCL), whereas in another study its expression has been associated with poor prognosis in DLBCL patients [29]. Consistent with this report, our study showed that higher expression of BACH2 was significantly related to worse OS. In addition, BACH2 promotes tumor growth through tumor immune suppression of Treg-mediated CD8+ T cells [30]. Therefore, studying the expression of BACH2 may provide newer insights for the prognosis and design of immune-based therapies in MSI-H gastric cancer.
While our study was primarily based on the analysis of the RNA-seq expression data from publicly available datasets, the gene signature identified should possibly facilitate development of immunotherapeutic targets and improve the response rate of GC patients with MSI to immunotherapy. However, there remain several limitations in our study. First, we have relied heavily on the TCGA dataset, which provides less information about the treatment regimen applied for the patients. Second, the sample size in our study was small and this may have affected the efficacy and stability of the prediction model. Third, the prognostic genes identified in our study remain to be validated in vitro and in vivo using a larger cohort of actual patient samples.
Conclusion
Our study provides a prognostic gene signature for predicting the OS of GC patients with MSI-H or MSI-L/MSS status. We have also explored the clinical utility of these prognostic IRGs by their statistically strong correlation with OS, tumor grad and clinical stage. We envision that the outcome of our study may help in understanding the underlying molecular mechanism, and interaction of immune microenvironment with tumor profile, which could allow patient-tailored treatment of GC patients.
Materials and Methods
Data acquisition
Gene expression data and clinical information of GC patient samples identified with MSI were collected from the TCGA database (https://cancergenome.nih.gov/), which includes 66 MSI-H patients and 308 MSI-L/MSS patients (Table 3, until September 18, 2019). The expression data was HTSeq-FPKM type, by using Trimmed mean of M values (TMM) implemented in the edgeR Bioconductor package and filtering out genes whose expression was less than 0.2, the data was normalized. 2498 IRGs were accessed from the ImmPort database (https://www.immport.org/), whereas 317 transcription factors (TFs) were accessed from the Cistrome Cancer database (http://cistrome.org/).
Table 3. Clinical and pathological characteristics of GC patients.
| Size | Characteristics | Count 374 | Percent (%) 100 |
| Sex | |||
| Male | 241 | 64.40 | |
| Female | 133 | 35.50 | |
| Age(years) | 65.80 ±10.65 | ||
| ≥60 | 251 | 67.11 | |
| <60 | 123 | 32.89 | |
| Stage | I-II | 163 | 43.58 |
| III-IV | 188 | 50.27 | |
| unknown | 23 | 6.15 | |
| T-stage | |||
| T1-T2 | 99 | 26.50 | |
| T3-T4 | 267 | 71.40 | |
| Tx | 8 | 2.10 | |
| Grade | |||
| G1 and G2 | 147 | 39.30 | |
| G3 | 218 | 58.29 | |
| Gx | 9 | 2.41 | |
| MSI | |||
| MSI-H | 66 | 17.65 | |
| MSI-L/MSS | 308 | 82.35 |
Identification of differentially expressed genes
Basing on a log2 transformation of fold-change, differential genes (DGs) between MSI-H and MSI-L/MSS samples were screened by the R 3.5.2 software and edgeR package, with a cut-off criteria set as fold-change (FC) >1.5, and adjusted P-value (adj.P) <0.01. The differentially expressed IRGs and TFs were identified from differentially expressed mRNAs in the TCGA cohort using R software. The pheatmap package in R software was used to generate the heat-maps and volcano plots to allow stratification of GC patients based on their MSI status.
Construction and validation of prognostic model
Univariate Cox regression analysis allowed the identification of 46 prognostic IRGs for 2498 genes of ImmPort database, which were then used to perform the Kaplan-Meier survival analysis in GC patients with MSI-H status, both using the Survival package of R software. Kaplan-Meier plots were generated to illustrate the relationship between patients’ overall survival and gene expression levels of IRGs which were stratified by the median. The relationship was tested by log-rank test, P values < 0.05 were considered to be statistically significant. These candidate genes were also analyzed using the multivariate Cox regression model to calculate the risk score (RS). GC patients with MSI-H or MSI-L/MSS status were distributed into either high-risk or low-risk disease groups based on their median prognostic RS. Furthermore, the pheatmap package (R software version 3.5.2) was used to distribute RS, survival status, and expression heat-maps for the high-risk and low-risk groups. The R 3.5.2 software also allowed analyses of the Kaplan-Meier survival curves (Survival R package) and the receiver-operating characteristic (ROC) curves (Survival ROC package). Prognostic independence was determined using univariate and multivariate Cox regression analysis of the RS and other clinic-pathological factors.
Construction of TF regulatory network
The interactions between prognostic IRGs and TFs were confirmed using R software. Correlation score >0.4 and P<0.01 were used as the cut-off values. TF-gene regulatory network was remodeled using the Cytoscape software (version 3.7.1).
The abundance of immune cells for prognostic IRGs
The abundance of six types of immune cells, ie, B cells, CD4+ T cells, CD8+ T cells, neutrophils, macrophages, and dendritic cells were determined using TIMER up to May 18, 2020 (https://cistrome.shinyapps.io/timer/). TIMER uses a previously reported statistical method to infer the abundance of tumor-infiltrating immune cells (TIICs) on the basis of gene expression profiles. A correlation between the expression levels of prognostic IRGs and the levels of TIICs were revealed via TIMER.
Gene set enrichment analysis (GSEA)
GSEA was performed using GSEA 3.0 (http://www.broadinstitute.org/gsea/). A total of 374 gastric samples inthe TCGA cohort were divided into two groups accordingto the expression of prognostic IRGs (divided by median value). For each analysis, gene set permutations were performed 1000 times to obtain a normalized enrichment score (NES) and a enrichment score (ES). A normalized P (NP) < 0.01 and a false discovery rate (FDR) < 0.25 were set as the cutoff.
Statistical analysis
All analyses were conducted using R software version 3.5.2. For all statistical tests, P values < 0.05 were considered to be statistically significant. The differentially expressed genes were confirmed by Wilcox test using R software. Associations between IRGs and OS were evaluated by Kaplan-Meier curves and univariate Cox Survival. Univariate and multivariate analyses were performed using Cox regression. AUC of the survival ROC curve was calculated by the survival ROC R software package. Wilcox test was performed to analyze correlations between prognostic IRGs and clinical features.
Availability of data and materials
The datasets analyzed during the current study are publicly available from the following online databases: TCGA (https://tcga-data.nci.nih.gov/tcga/); ImmPort database (https://www.immport.org/); the Cistrome Cancer database (http://cistrome.org/); TIMER (https://cistrome.shinyapps.io/timer/).
Ethics approval
The databases are publicly available and open to access, so this study did not need the approval from the ethics committee.
Supplementary Materials
Author Contributions
Ruyue Tian conceived the project and wrote the manuscript. Ruyue Tian, Jiexuan Hu, Xiao Ma participated in data analysis, discussion and language editing. Lei Liang contributed to the revision of the manuscript. Shuilong Guo reviewed the manuscript. All authors read and approved the final manuscript.
Conflicts of Interest
The authors have declared that no conflicts of interest.
Funding
This study was fully supported by Aero Space Central Hospital foundation (No.YN201710), National Natural Science Foundation of China(81670474) and Natural Science Foundation of Beijing (7152043).
References
- 1. Torre LA, Bray F, Siegel RL, Ferlay J, Lortet-Tieulent J, Jemal A. Global cancer statistics, 2012. CA Cancer J Clin. 2015; 65:87–108. https://doi.org/10.3322/caac.21262 [PubMed]
- 2. Cancer Genome Atlas Research Network. Comprehensive molecular characterization of gastric adenocarcinoma. Nature. 2014; 513:202–09. https://doi.org/10.1038/nature13480 [PubMed]
- 3. Sohn BH, Hwang JE, Jang HJ, Lee HS, Oh SC, Shim JJ, Lee KW, Kim EH, Yim SY, Lee SH, Cheong JH, Jeong W, Cho JY, et al. Clinical significance of four molecular subtypes of gastric cancer identified by the cancer genome atlas project. Clin Cancer Res. 2017; 10:1158. https://doi.org/10.1158/1078-0432.CCR-16-2211 [PubMed]
- 4. Vilar E, Gruber SB. Microsatellite instability in colorectal cancer-the stable evidence. Nat Rev Clin Oncol. 2010; 7:153–62. https://doi.org/10.1038/nrclinonc.2009.237 [PubMed]
- 5. Zhao P, Li L, Jiang X, Li Q. Mismatch repair deficiency/microsatellite instability-high as a predictor for anti-PD-1/PD-L1 immunotherapy efficacy. J Hematol Oncol. 2019; 12:54. https://doi.org/10.1186/s13045-019-0738-1 [PubMed]
- 6. Beghelli S, de Manzoni G, Barbi S, Tomezzoli A, Roviello F, Di Gregorio C, Vindigni C, Bortesi L, Parisi A, Saragoni L, Scarpa A, Moore PS. Microsatellite instability in gastric cancer is associated with better prognosis in only stage II cancers. Surgery. 2006; 139:347–56. https://doi.org/10.1016/j.surg.2005.08.021 [PubMed]
- 7. Fang WL, Chang SC, Lan YT, Huang KH, Chen JH, Lo SS, Hsieh MC, Li AF, Wu CW, Chiou SH. Microsatellite instability is associated with a better prognosis for gastric cancer patients after curative surgery. World J Surg. 2012; 36:2131–38. https://doi.org/10.1007/s00268-012-1652-7 [PubMed]
- 8. Prasad V, Kaestner V, Mailankody S. Cancer drugs approved based on biomarkers and not tumor type-FDA approval of pembrolizumab for mismatch repair-deficient solid cancers. JAMA Oncol. 2018; 4:157–58. https://doi.org/10.1001/jamaoncol.2017.4182 [PubMed]
- 9. Ratti M, Lampis A, Hahne JC, Passalacqua R, Valeri N. Microsatellite instability in gastric cancer: molecular bases, clinical perspectives, and new treatment approaches. Cell Mol Life Sci. 2018; 75:4151–62. https://doi.org/10.1007/s00018-018-2906-9 [PubMed]
- 10. Cunningham D, Allum WH, Stenning SP, Thompson JN, Van de Velde CJ, Nicolson M, Scarffe JH, Lofts FJ, Falk SJ, Iveson TJ, Smith DB, Langley RE, Verma M, et al. Perioperative chemotherapy versus surgery alone for resectable gastroesophageal cancer. N Engl J Med. 2006; 355:11–20. https://doi.org/10.1056/NEJMoa055531 [PubMed]
- 11. Siegel RL, Miller KD, Jemal A. Cancer statistics, 2017. CA Cancer J Clin. 2017; 67:7–30. https://doi.org/10.3322/caac.21387 [PubMed]
- 12. Aoyama T, Yoshikawa T, Watanabe T, Hayashi T, Ogata T, Cho H, Tsuburaya A. Survival and prognosticators of gastric cancer that recurs after adjuvant chemotherapy with S-1. Gastric Cancer. 2011; 14:150–54. https://doi.org/10.1007/s10120-011-0020-x [PubMed]
- 13. Cristescu R, Lee J, Nebozhyn M, Kim KM, Ting JC, Wong SS, Liu J, Yue YG, Wang J, Yu K, Ye XS, Do IG, Liu S, et al. Molecular analysis of gastric cancer identifies subtypes associated with distinct clinical outcomes. Nat Med. 2015; 21:449–56. https://doi.org/10.1038/nm.3850 [PubMed]
- 14. Smyth EC, Wotherspoon A, Peckitt C, Gonzalez D, Hulkki-Wilson S, Eltahir Z, Fassan M, Rugge M, Valeri N, Okines A, Hewish M, Allum W, Stenning S, et al. Mismatch repair deficiency, microsatellite instability, and survival: an exploratory analysis of the medical research council adjuvant gastric infusional chemotherapy (MAGIC) trial. JAMA Oncol. 2017; 3:1197–203. https://doi.org/10.1001/jamaoncol.2016.6762 [PubMed]
- 15. Kim SY, Choi YY, An JY, Shin HB, Jo A, Choi H, Seo SH, Bang HJ, Cheong JH, Hyung WJ, Noh SH. The benefit of microsatellite instability is attenuated by chemotherapy in stage II and stage III gastric cancer: results from a large cohort with subgroup analyses. Int J Cancer. 2015; 137:819–25. https://doi.org/10.1002/ijc.29449 [PubMed]
- 16. Le DT, Uram JN, Wang H, Bartlett BR, Kemberling H, Eyring AD, Skora AD, Luber BS, Azad NS, Laheru D, Biedrzycki B, Donehower RC, Zaheer A, et al. PD-1 blockade in tumors with mismatch-repair deficiency. N Engl J Med. 2015; 372:2509–20. https://doi.org/10.1056/NEJMoa1500596 [PubMed]
- 17. Le DT, Durham JN, Smith KN, Wang H, Bartlett BR, Aulakh LK, Lu S, Kemberling H, Wilt C, Luber BS, Wong F, Azad NS, Rucki AA, et al. Mismatch repair deficiency predicts response of solid tumors to PD-1 blockade. Science. 2017; 357:409–13. https://doi.org/10.1126/science.aan6733 [PubMed]
- 18. Muro K, Chung HC, Shankaran V, Geva R, Catenacci D, Gupta S, Eder JP, Golan T, Le DT, Burtness B, McRee AJ, Lin CC, Pathiraja K, et al. Pembrolizumab for patients with PD-L1-positive advanced gastric cancer (KEYNOTE-012): a multicentre, open-label, phase 1b trial. Lancet Oncol. 2016; 17:717–26. https://doi.org/10.1016/S1470-2045(16)00175-3 [PubMed]
- 19. Ott PA, Le DT, Kim JW, Ascierto PA, Sharma P, Bono P, Peltola K, Jäger D, Evans TRJ, de Braud F, Chau I, Bendell JC, Tschaika M, et al. Nivolumab (NIVO) in patients (pts) with advanced (adv) chemotherapy-refractory (CT-Rx) esophagogastric (EG) cancer according to microsatellite instability (MSI) status: checkmate 032. Ann Oncol. 2017; 28:674P. https://doi.org/10.1093/annonc/mdx369.058
- 20. Hang X, Li D, Wang J, Wang G. Prognostic significance of microsatellite instability-associated pathways and genes in gastric cancer. Int J Mol Med. 2018; 42:149–60. https://doi.org/10.3892/ijmm.2018.3643 [PubMed]
- 21. Gensure RC, Gardella TJ, Jüppner H. Parathyroid hormone and parathyroid hormone-related peptide, and their receptors. Biochem Biophys Res Commun. 2005; 328:666–78. https://doi.org/10.1016/j.bbrc.2004.11.069 [PubMed]
- 22. Liang H, Zhong Y, Huang Y, Chen G. Type 1 receptor parathyroid hormone (PTH1R) influences breast cancer cell proliferation and apoptosis induced by high levels of glucose. Med Oncol. 2012; 29:439–45. https://doi.org/10.1007/s12032-011-9851-x [PubMed]
- 23. Monego G, Lauriola L, Ramella S, D’Angelillo RM, Lanza P, Granone P, Ranelletti FO. Parathyroid hormone-related peptide and parathyroid hormone-related peptide receptor type 1 expression in human lung adenocarcinoma. Chest. 2010; 137:898–908. https://doi.org/10.1378/chest.09-1358 [PubMed]
- 24. Wang HJ, Wang L, Song SS, He XL, Pan HY, Hu ZM, Mou XZ. Decreased expression of PTH1R is a poor prognosis in hepatocellular carcinoma. Cancer Biomark. 2018; 21:723–30. https://doi.org/10.3233/CBM-170823 [PubMed]
- 25. Zhang H, Chen Z, Miranda RN, Medeiros LJ, McCarty N. Bifurcated BACH2 control coordinates mantle cell lymphoma survival and dispersal during hypoxia. Blood. 2017; 130:763–76. https://doi.org/10.1182/blood-2017-02-767293 [PubMed]
- 26. Sakane-Ishikawa E, Nakatsuka S, Tomita Y, Fujita S, Nakamichi I, Takakuwa T, Sugiyama H, Fukuhara S, Hino M, Kanamaru A, Soma T, Tsukaguchi M, Igarashi K, et al, and Osaka Lymphoma Study Group. Prognostic significance of BACH2 expression in diffuse large B-cell lymphoma: a study of the osaka lymphoma study group. J Clin Oncol. 2005; 23:8012–17. https://doi.org/10.1200/JCO.2005.02.1626 [PubMed]
- 27. Yang Z, Chen JS, Wen JK, Gao HT, Zheng B, Qu CB, Liu KL, Zhang ML, Gu JF, Li JD, Zhang YP, Li W, Wang XL, Zhang Y. Silencing of miR-193a-5p increases the chemosensitivity of prostate cancer cells to docetaxel. J Exp Clin Cancer Res. 2017; 36:178. https://doi.org/10.1186/s13046-017-0649-3 [PubMed]
- 28. Chen X, Yue B, Zhang C, Qi M, Qiu J, Wang Y, Chen J. MiR-130a-3p inhibits the viability, proliferation, invasion, and cell cycle, and promotes apoptosis of nasopharyngeal carcinoma cells by suppressing BACH2 expression. Biosci Rep. 2017; 37:BSR20160576. https://doi.org/10.1042/BSR20160576 [PubMed]
- 29. Ichikawa S, Fukuhara N, Katsushima H, Takahashi T, Yamamoto J, Yokoyama H, Sasaki O, Fukuhara O, Nomura J, Ishizawa K, Ichinohasama R, Muto A, Igarashi K, Harigae H. Association between BACH2 expression and clinical prognosis in diffuse large B-cell lymphoma. Cancer Sci. 2014; 105:437–44. https://doi.org/10.1111/cas.12361 [PubMed]
- 30. Roychoudhuri R, Eil RL, Clever D, Klebanoff CA, Sukumar M, Grant FM, Yu Z, Mehta G, Liu H, Jin P, Ji Y, Palmer DC, Pan JH, et al. The transcription factor BACH2 promotes tumor immunosuppression. J Clin Invest. 2016; 126:599–604. https://doi.org/10.1172/JCI82884 [PubMed]