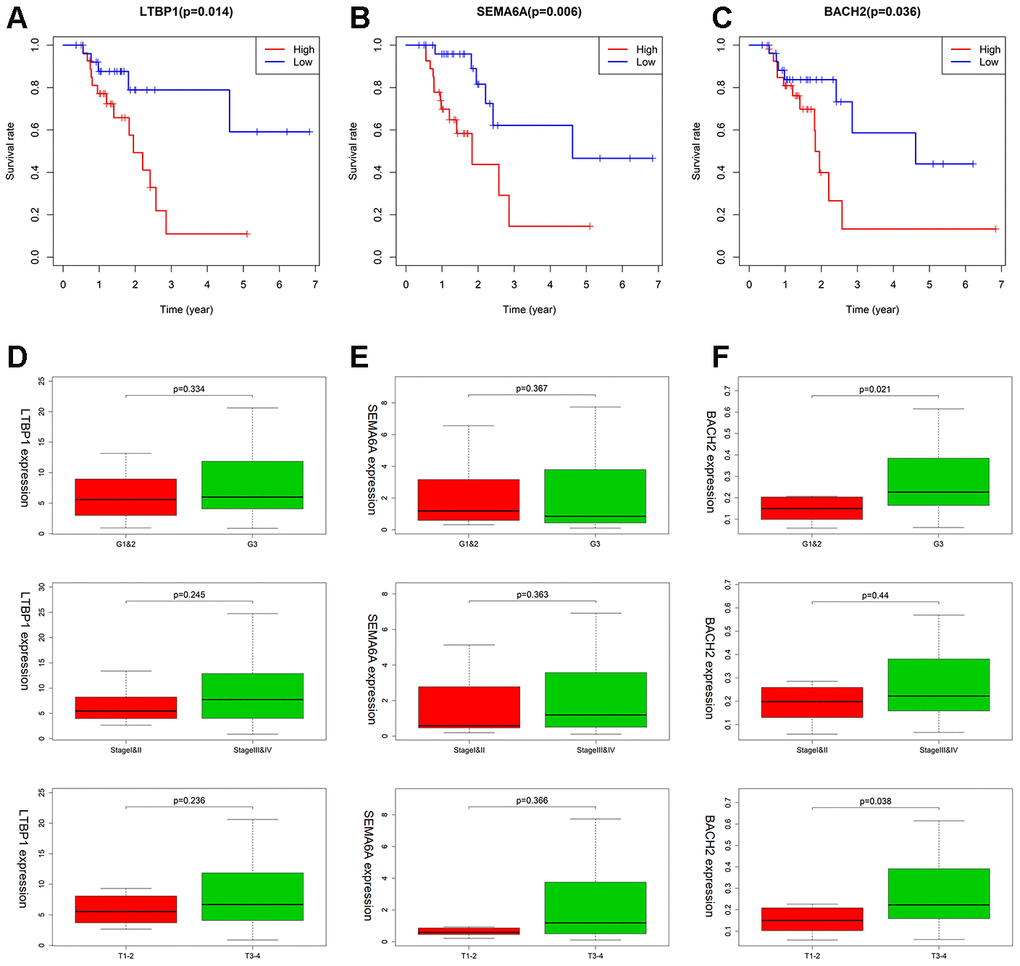
Figure 8.The association between LTBP1, SEMA6A, and BACH2 expression and different clinical signatures in MSI-H samples. (A–C) Kaplan–Meier survival curves for LTBP1, SEMA6A, and BACH2 in MSI-H samples. (D–F) Expression of LTBP1, SEMA6A, and BACH2 in different grade stage, clinical stage, and T stage groups.