


Introduction
Sarcopenia is a geriatric syndrome characterized by progressive loss of muscle mass and strength, placing the elderly at increased risk of disability, falls, and frailty [1]. The International Working Group on Sarcopenia [2], the European Working Group on Sarcopenia in Older People, the Asian Working Group for Sarcopenia (AWGS), and the Foundation for the National Institutes of Health Sarcopenia Project [3] recommend muscle function (strength or performance) and muscle mass measurements for a sarcopenia diagnosis [4, 5].
Optimal methods for modeling handgrip strength in statistical prediction remain controversial [6]. Although it has been suggested that low muscle mass is a poor indicator of functional outcomes when compared with muscle strength and performance [7], low muscle mass is a key component of the sarcopenia phenotype [3]. Pre-sarcopenia is characterized by the presence of low muscle mass with normal muscle strength and physical performance [8].
Previous studies have identified metabolites associated with lean mass or body mass index (BMI) [9–11]. These studies also reported the association between metabolic profiles and body composition. Metabolomics employs technologies aimed at better understanding the complexity of a living system. In translational research, a metabolomics approach may enable the detection of multiple disease risk factors and interactions, disease progression, and responses of patients to a particular therapy with or without side effects [12]. Amino acid metabolic disturbances [13] and anomalous energy metabolism [14] have been reported in patients with chronic fatigue syndrome, whereas abnormalities in 20 metabolic pathways have also has been reported [15]. Limited information is available regarding the effects of age-related sarcopenia on plasma metabolite levels [10, 16]. Recently, metabolomic and lipidomic analyses have been used to investigate gender differences under physiological and pathological conditions [17–19]. Gender is considered one of the most relevant biological variables influencing metabolomic and lipidomic profiles [20]. However, the relationship between circulating metabolites and gender, specifically in older adults with muscle mass loss, has not yet been characterized.
This study explores the association between metabolites and muscle mass in a healthy, elderly Taiwanese population. The independent subjects enrolled in our study lived in a retired home, without nursing assistance, and their score of activities of daily living (ADL) and instrumental activities of daily living (IADL) were intact. Although gender differences are identified in the metabolic signatures of muscle mass loss, and these metabolites are associated with the urea cycle. The higher catabolic rate of amino acids is linked with muscle mass loss. From these results, we can identify the metabolic biomarkers for age-related muscle mass loss or sarcopenia. Amino acid signatures can also be used to evaluate the beneficial effects of intervention.
Results
Enrollment of study participants
A total of 305 subjects were enrolled in our study; 173 women and 132 men were eligible for muscle function, composition, and other clinical parameters, including appendicular skeletal muscle mass, handgrip strength, and gait speed. The average age of all participants was 81.8 years old, and 56.7% of the subjects were women. The average age of the female and male participants was 80.15 ± 7.08 and 83.95 ± 6.78 years old, respectively.
Association of muscle mass with demographic and clinical characteristics
Female and male participants were divided into four groups each, based on their quartile, according to their appendicular skeletal muscle mass index (ASMI) values (appendicular skeletal muscle mass divided by height squared, kg/m2). ASMI cutoff values were: quartile 1 (Q1): > 7.153 kg/m2; quartile 2 (Q2): 6.659–7.128 kg/m2; quartile 3 (Q3): 6.155–6.658 kg/m2; and quartile 4 (Q4): < 6.155 kg/m2 in male participants, and Q1: > 6.125 kg/m2; Q2: 5.625–6.114 kg/m2; Q3: 5.149–5.604 kg/m2; and Q4: < 5.149 kg/m2 in female participants (Figure 1). Specifically, we used the sarcopenia cutoff values recommended by the AWGS for loss of muscle mass (ASMI: < 7.0 kg/m2 for men and < 5.4 kg/m2 for women) and loss of muscle function (handgrip strength: < 26 kg for men and < 18 kg for women; gait speed: < 0.8 m/s). According to AWGS criteria, participants in Q1 present normal ASMI values (> 7.153 kg/m2 for men and > 6.125 kg/m2 for women), however, participants in Q4 present muscle mass loss (< 6.155 kg/m2 for men and < 5.149 kg/m2 for women). ASMI Q1, Q2, Q3, and Q4 values were 7.60 ± 0.29, 6.89 ± 0.14, 6.39 ± 0.16, and 5.67 ± 0.35 kg/m2, respectively, in male participants, and 6.56 ± 0.53, 5.87 ± 0.15, 5.36 ± 0.14, and 4.70 ± 0.32 kg/m2, respectively, in female participants. Table 1 shows the proportion of loss of muscle mass and function in male and female participants in different quartiles. Higher muscle mass loss was observed in Q4 compared with that in Q1 (Table 1). In both male and female groups, handgrip strength declined in Q4 compared with that in Q1. However, in the female group, the gait speed of Q4 was not significantly lower than that of Q1 (Table 1).
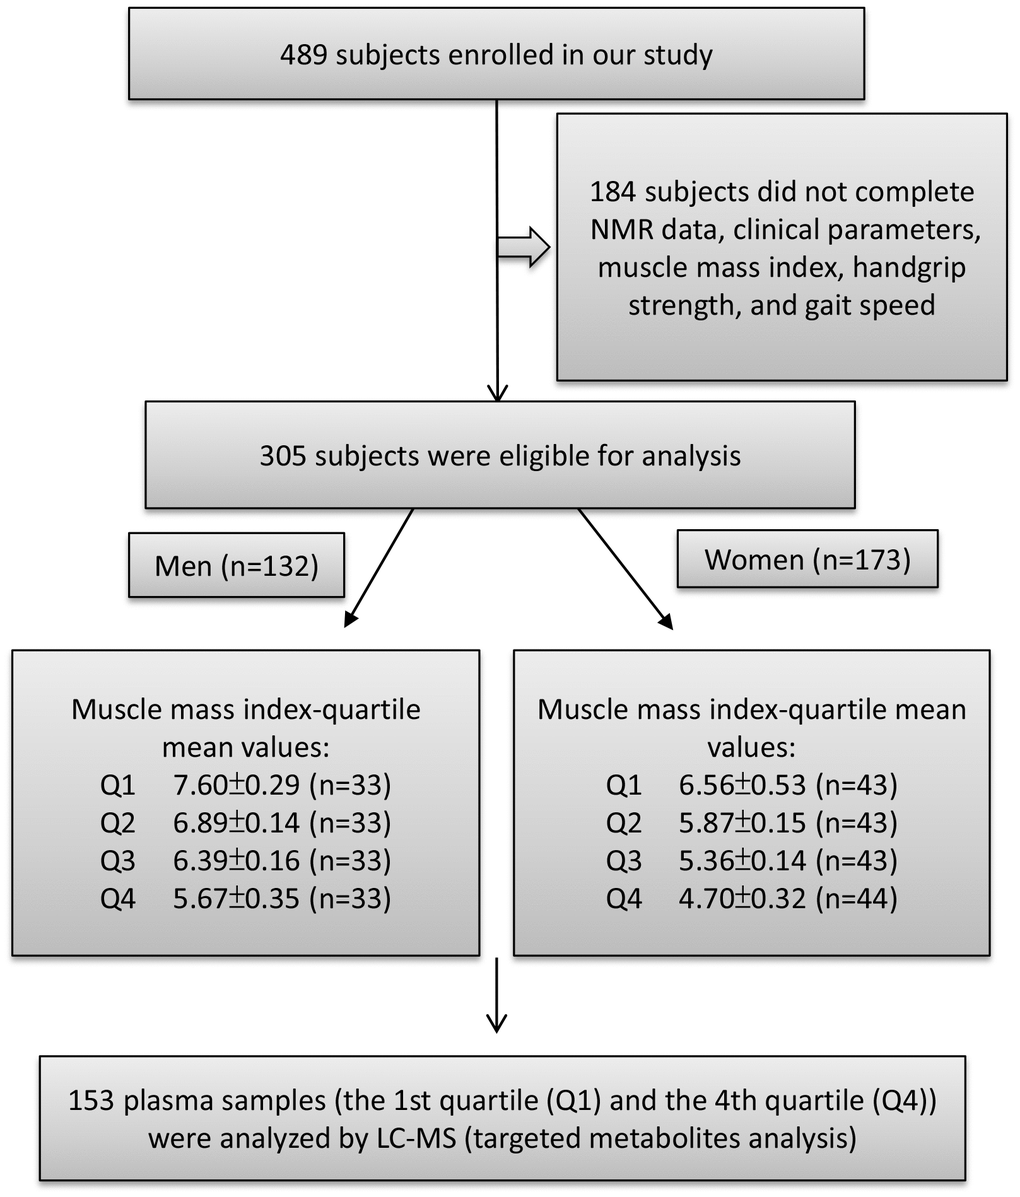
Figure 1. Study flow diagram shows number of participants for untargeted and targeted metabolite analysis. A total of 489 participants enrolled in this study of which 305 subjects were eligible to participate. According to appendicular skeletal muscle mass index (ASMI) values, we divided the male and female subjects into four groups each by quartile. The ASMI values of quartile 1, 2, 3, and 4 (Q1, Q2, Q3, and Q4) were 7.60±0.29, 6.89±0.14, 6.39±0.16, and 5.67±0.35 kg/m2, respectively. In the female group, quartile 1, 2, 3, and 4 (Q1, Q2, Q3, and Q4) ASMI values were: 6.56±0.53, 5.87±0.15, 5.36±0.14, and 4.70±0.32 kg/m2, respectively. The first quartile (Q1) was defined as the control group and the fourth quartile (Q4) as the muscle loss group. Both Q1 and Q4 were performed for metabolite analysis.
Table 1. Baseline demographics of men and women in Taiwanese elderly population.
| Quartile group | Men | Women | |||||||||||||||||||||||||||||||||||||||||||||||||||||||||||||||||||||||||||||||||||||||||||||||||
| Q1 | Q4 | P value | Adj PFDR | Q1 | Q4 | P value | Adj PFDR | ||||||||||||||||||||||||||||||||||||||||||||||||||||||||||||||||||||||||||||||||||||||||||||
| characteristics | (N=33) | (N=33) | (Q1 vs. Q4) | (Q1 vs. Q4) | (N=43) | (N=44) | (Q1 vs. Q4) | (Q1 vs. Q4) | |||||||||||||||||||||||||||||||||||||||||||||||||||||||||||||||||||||||||||||||||||||||||||
| Age | 82 | 87 | 0.0011 | 0.0319 | 81 | 81.5 | 0.7790 | ||||||||||||||||||||||||||||||||||||||||||||||||||||||||||||||||||||||||||||||||||||||||||||
| Muscle mass and strength | |||||||||||||||||||||||||||||||||||||||||||||||||||||||||||||||||||||||||||||||||||||||||||||||||||
| Walking speed, m/sec | 1.20 | 0.91 | 0.0076 | 0.0005 | 1 | 1.04 | 0.3395 | 0.0065 | |||||||||||||||||||||||||||||||||||||||||||||||||||||||||||||||||||||||||||||||||||||||||||
| Grip strength, kg | 25.5 | 21 | 0.0018 | 0.0034 | 15.9 | 13.15 | 0.0261 | 0.0129 | |||||||||||||||||||||||||||||||||||||||||||||||||||||||||||||||||||||||||||||||||||||||||||
| ASMI, Kg/m2 | 7.60 | 5.77 | 3.02E-12 | 9.86E-25 | 6.44 | 4.76 | 9.98E-16 | 4.95E-26 | |||||||||||||||||||||||||||||||||||||||||||||||||||||||||||||||||||||||||||||||||||||||||||
| Body mass | |||||||||||||||||||||||||||||||||||||||||||||||||||||||||||||||||||||||||||||||||||||||||||||||||||
| Height, cm | 165.7 | 164.1 | 0.7291 | 153.6 | 152.2 | 0.8022 | |||||||||||||||||||||||||||||||||||||||||||||||||||||||||||||||||||||||||||||||||||||||||||||
| Weight, kg | 71.9 | 55.8 | 8.17E-07 | 2.20E-05 | 62.8 | 46.65 | 2.81E-14 | 1.18E-13 | |||||||||||||||||||||||||||||||||||||||||||||||||||||||||||||||||||||||||||||||||||||||||||
| BMI, kg/m2 | 25.72 | 20.91 | 2.09E-08 | 2.75E-07 | 26.38 | 19.09 | 4.50E-15 | 7.45E-18 | |||||||||||||||||||||||||||||||||||||||||||||||||||||||||||||||||||||||||||||||||||||||||||
| waist, cm | 93 | 82 | 0.0003 | 0.0032 | 93 | 82 | 2.75E-09 | 4.19E-06 | |||||||||||||||||||||||||||||||||||||||||||||||||||||||||||||||||||||||||||||||||||||||||||
| Blood pressure, mmHg | |||||||||||||||||||||||||||||||||||||||||||||||||||||||||||||||||||||||||||||||||||||||||||||||||||
| Systolic | 128 | 126 | 0.9081 | 127 | 128.5 | 0.7309 | |||||||||||||||||||||||||||||||||||||||||||||||||||||||||||||||||||||||||||||||||||||||||||||
| Diastolic | 69 | 67 | 0.4640 | 69 | 66 | 0.0171 | |||||||||||||||||||||||||||||||||||||||||||||||||||||||||||||||||||||||||||||||||||||||||||||
| Laboratory data | |||||||||||||||||||||||||||||||||||||||||||||||||||||||||||||||||||||||||||||||||||||||||||||||||||
| WBC, 103/ml | 5.5 | 5.3 | 0.7975 | 5.3 | 5.35 | 0.8617 | |||||||||||||||||||||||||||||||||||||||||||||||||||||||||||||||||||||||||||||||||||||||||||||
| RBC, 106/ml | 4.46 | 4.16 | 0.0307 | 0.5276 | 4.46 | 4.12 | 0.0686 | ||||||||||||||||||||||||||||||||||||||||||||||||||||||||||||||||||||||||||||||||||||||||||||
| Hb, g/dl | 14.2 | 12.6 | 0.0008 | 0.2866 | 13.5 | 12.6 | 0.0313 | ||||||||||||||||||||||||||||||||||||||||||||||||||||||||||||||||||||||||||||||||||||||||||||
| Platelets, 103/ml | 179 | 193 | 0.4686 | 210 | 227 | 0.4078 | |||||||||||||||||||||||||||||||||||||||||||||||||||||||||||||||||||||||||||||||||||||||||||||
| Cholesterol, mg/dL | 166 | 175 | 0.3393 | 177 | 183 | 0.9831 | |||||||||||||||||||||||||||||||||||||||||||||||||||||||||||||||||||||||||||||||||||||||||||||
| Triglyceride, mg/dL | 91 | 78 | 0.0856 | 92 | 84.5 | 0.0360 | 0.0499 | ||||||||||||||||||||||||||||||||||||||||||||||||||||||||||||||||||||||||||||||||||||||||||||
| HDL-C, mg/dL | 49 | 50 | 0.6533 | 51 | 58.5 | 0.0122 | 0.2555 | ||||||||||||||||||||||||||||||||||||||||||||||||||||||||||||||||||||||||||||||||||||||||||||
| LDL-C, mg/dL | 96 | 105 | 0.2899 | 106 | 103 | 0.5898 | |||||||||||||||||||||||||||||||||||||||||||||||||||||||||||||||||||||||||||||||||||||||||||||
| Glucose, mg/dL | 96 | 95 | 0.8928 | 100 | 90.5 | 0.0030 | |||||||||||||||||||||||||||||||||||||||||||||||||||||||||||||||||||||||||||||||||||||||||||||
| HbA1c, % | 5.8 | 5.7 | 0.5671 | 5.75 | 5.8 | 0.2222 | |||||||||||||||||||||||||||||||||||||||||||||||||||||||||||||||||||||||||||||||||||||||||||||
| Uric acid, mg/dL | 5.6 | 6.2 | 0.0786 | 0.1272 | 5.3 | 4.75 | 0.0870 | ||||||||||||||||||||||||||||||||||||||||||||||||||||||||||||||||||||||||||||||||||||||||||||
| Albumin, g/dL | 4.32 | 4.19 | 0.0054 | 0.4556 | 4.41 | 4.375 | 0.8219 | ||||||||||||||||||||||||||||||||||||||||||||||||||||||||||||||||||||||||||||||||||||||||||||
| Total protein, g/dL | 7 | 7 | 0.6244 | 7 | 7.2 | 0.1811 | |||||||||||||||||||||||||||||||||||||||||||||||||||||||||||||||||||||||||||||||||||||||||||||
| AST/GOT, U/L | 25 | 23 | 0.0870 | 26 | 27 | 0.6552 | |||||||||||||||||||||||||||||||||||||||||||||||||||||||||||||||||||||||||||||||||||||||||||||
| ALT/GPT, U/L | 17 | 13 | 0.0072 | 18 | 15 | 0.0116 | |||||||||||||||||||||||||||||||||||||||||||||||||||||||||||||||||||||||||||||||||||||||||||||
| ALKP, U/L | 69 | 59 | 0.0551 | 0.1838 | 63 | 61.5 | 0.5077 | ||||||||||||||||||||||||||||||||||||||||||||||||||||||||||||||||||||||||||||||||||||||||||||
| Total bilirubin, mg/dL | 0.9 | 0.7 | 0.0147 | 0.5612 | 0.7 | 0.6 | 0.0406 | 0.2792 | |||||||||||||||||||||||||||||||||||||||||||||||||||||||||||||||||||||||||||||||||||||||||||
| BUN, mg/dL | 16.8 | 22.8 | 0.0003 | 0.0027 | 15.1 | 15.35 | 0.7696 | ||||||||||||||||||||||||||||||||||||||||||||||||||||||||||||||||||||||||||||||||||||||||||||
| Creatinine, mg/dL | 0.93 | 1.05 | 0.0993 | 0.0113 | 0.67 | 0.65 | 0.1585 | ||||||||||||||||||||||||||||||||||||||||||||||||||||||||||||||||||||||||||||||||||||||||||||
| Na, mEq/L | 142 | 142 | 0.3392 | 143 | 142.5 | 0.2223 | |||||||||||||||||||||||||||||||||||||||||||||||||||||||||||||||||||||||||||||||||||||||||||||
| K, mEq/L | 4.2 | 4.3 | 0.1747 | 4.1 | 4.25 | 0.8015 | |||||||||||||||||||||||||||||||||||||||||||||||||||||||||||||||||||||||||||||||||||||||||||||
| Cl, mEq/L | 105 | 105 | 0.7074 | 106 | 106 | 0.2949 | |||||||||||||||||||||||||||||||||||||||||||||||||||||||||||||||||||||||||||||||||||||||||||||
| Ca, mg/dL | 9.1 | 9 | 0.3438 | 9.2 | 9.2 | 0.9456 | |||||||||||||||||||||||||||||||||||||||||||||||||||||||||||||||||||||||||||||||||||||||||||||
| Comorbidity | Chi-square test P | Chi-square test P | |||||||||||||||||||||||||||||||||||||||||||||||||||||||||||||||||||||||||||||||||||||||||||||||||
| Hypertension (%) | 61% | 55% | 0.6184 | 63% | 43% | 0.0670 | |||||||||||||||||||||||||||||||||||||||||||||||||||||||||||||||||||||||||||||||||||||||||||||
| Diabetes (%) | 24% | 30% | 0.5804 | 33% | 23% | 0.3050 | |||||||||||||||||||||||||||||||||||||||||||||||||||||||||||||||||||||||||||||||||||||||||||||
| Hyperlipidemia (%) | 27% | 30% | 0.7857 | 42% | 25% | 0.0953 | |||||||||||||||||||||||||||||||||||||||||||||||||||||||||||||||||||||||||||||||||||||||||||||
| CAD (%) | 6% | 12% | 0.3918 | 14% | 5% | 0.1289 | |||||||||||||||||||||||||||||||||||||||||||||||||||||||||||||||||||||||||||||||||||||||||||||
| Cancer (%) | 9% | 9% | 1.0000 | 2% | 5% | 0.5705 | |||||||||||||||||||||||||||||||||||||||||||||||||||||||||||||||||||||||||||||||||||||||||||||
| Stroke (%) | 12% | 12% | 1.0000 | 14% | 0% | 0.0102 | |||||||||||||||||||||||||||||||||||||||||||||||||||||||||||||||||||||||||||||||||||||||||||||
| CKD (%) | 9% | 21% | 0.1697 | 9% | 7% | 0.6702 | |||||||||||||||||||||||||||||||||||||||||||||||||||||||||||||||||||||||||||||||||||||||||||||
| COPD (%) | 24% | 42% | 0.1178 | 9% | 20% | 0.1446 | |||||||||||||||||||||||||||||||||||||||||||||||||||||||||||||||||||||||||||||||||||||||||||||
| Osteoporosis (%) | 9% | 24% | 0.0986 | 33% | 57% | 0.0229 | |||||||||||||||||||||||||||||||||||||||||||||||||||||||||||||||||||||||||||||||||||||||||||||
| * Data are medians. Variables were analyzed by Mann-Whitney U tests. Multiple logistic regression models were used to analyze the effect of gender on the dependent variable controlling for age and comorbidities, including hypertension, diabetes, hyperlipidemia, coronary artery disease (CAD), cancer, stroke, chronic kidney disease (CKD), chronic obstructive pulmonary disease (COPD), and osteoporosis. Model significance was presented in adjusted P value. ASMI, appendicular skeletal muscle mass index; BMI, body mass index; WBC, white blood cell; RBC, red blood cell; Hb, hemoglobin; HDL-C, high-density lipoprotein-cholesterol; LDL-C, low density lipoprotein-cholesterol; HbAlc, hemoglobin A1c; AST, aspartate aminotransferase; ALT, alanine aminotransferase; ALKP, alkaline phosphatase; BUN, blood urea nitrogen. | |||||||||||||||||||||||||||||||||||||||||||||||||||||||||||||||||||||||||||||||||||||||||||||||||||
After multivariable adjustment, except for physical function, body composition parameters, including gait speed, handgrip strength, weight, BMI, waist circumference, age, and other parameters, such as blood urea nitrogen (BUN) and serum creatinine, were associated with ASMI in men; however, only triglyceride was related to ASMI in women. The proportion of subjects with osteoporosis was higher in Q4 than in Q1 in the female group (Table 1). Therefore, our results suggested that the clinical parameters associated with muscle mass loss were gender-specific in elderly Taiwanese population.
Association of muscle mass with metabolite profiles
We compared the metabolite profile of plasma between normal (Q1) and muscle mass loss (Q4) groups in elderly Taiwanese subjects by untargeted nuclear magnetic resonance (NMR) analysis of 153 plasma samples. The metabolites contributing to the distinction between Q1 and Q4, in both female and male participants, are shown in distribution plots, revealing amino acid-related metabolites as important discriminators between Q1 and Q4 (Figure 2).
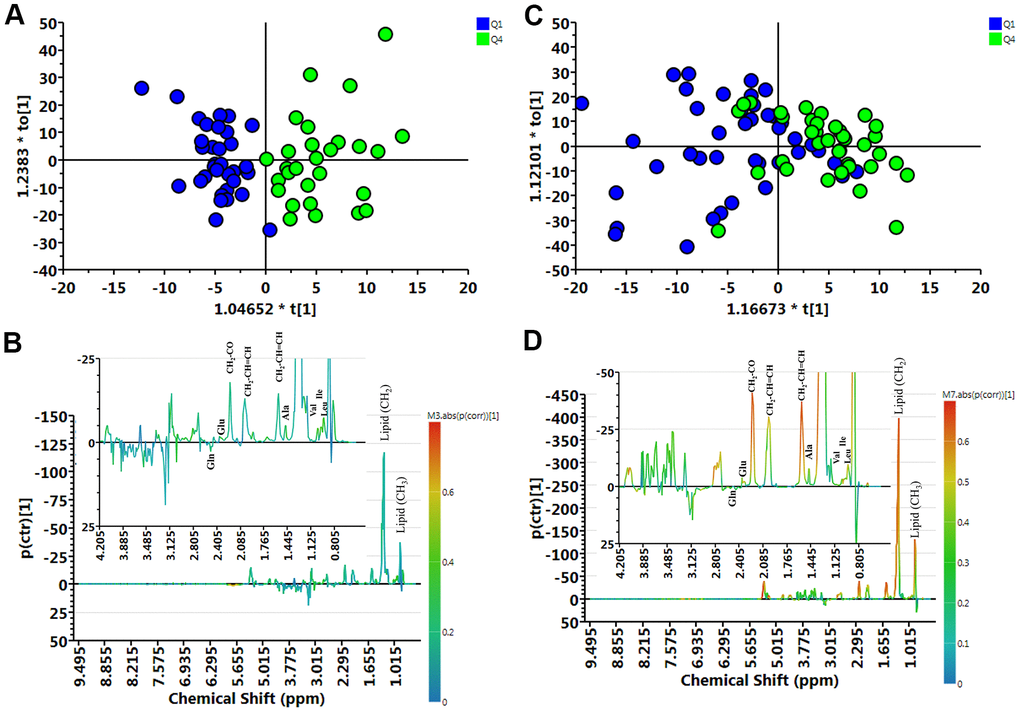
Figure 2. Muscle loss and control group samples analyzed by 1H NMR spectroscopy. (A) Orthogonal partial least-squares discriminant analysis plot (OPLS-DA) of the control (Q1) and muscle loss (Q4) subgroups in men showed considerable separation (R2X = 0.404, R2Y = 0.750, and Q2 = 0.316). (B) Contribution plots of control (Q1) and muscle loss (Q4). (C) OPLS-DA plot of control (Q1) and muscle loss (Q4) subgroups in women showed considerable separation (R2X = 0.362, R2Y = 0.360, and Q2 = 0.00307). (D) Contribution plots of control (Q1) and muscle loss (Q4). The results were revealing amino acid-related metabolites as important discriminators between Q1 and Q4.
Metabolites associated with muscle mass loss
Quantification of amino and biogenic amines was performed by liquid chromatography-mass spectrometry (LC-MS), and the results are shown in Table 2. In the female group, the levels of total amino acids, including essential and nonessential amino acids, decreased and significantly changed in Q4. In the male group, essential amino acids, aromatic amino acids (AAAs), branched amino acids (BCAAs), glutamate, aspartate, tryptophan, threonine, alpha-aminoadipate (alpha-AAA), and sarcosine levels decreased in Q4, whereas the levels of biogenic amines, such as symmetric dimethylarginine (SDMA), Dopa, kynurenine/tryptophan, citrulline/ornithine (Cit/Orn), and putrescine/Orn ratios increased in Q4 compared with those in Q1.
Table 2. Concentration of metabolites significantly differentially expressed between Q1 and Q4 groups.
| Men | Women | ||||||||||||||||||||||||||||||||||||||||||||||||||||||||||||||||||||||||||||||||||||||||||||||||||
| Amino acid (μM) | Q1 | Q4 | P | Q1 | Q4 | P | |||||||||||||||||||||||||||||||||||||||||||||||||||||||||||||||||||||||||||||||||||||||||||||
| (N=33) | (N=33) | (Q1 vs. Q4) | (N=43) | (N=44) | (Q1 vs. Q4) | ||||||||||||||||||||||||||||||||||||||||||||||||||||||||||||||||||||||||||||||||||||||||||||||
| Essential_AA | 1121.6 | 1056 | 0.0402 | 1006.4 | 916.4 | 0.0037 | |||||||||||||||||||||||||||||||||||||||||||||||||||||||||||||||||||||||||||||||||||||||||||||
| Ile | 82 | 75.7 | 0.0929 | 69.4 | 62.9 | 0.0219 | |||||||||||||||||||||||||||||||||||||||||||||||||||||||||||||||||||||||||||||||||||||||||||||
| Leu | 153 | 136 | 0.0085 | 131 | 116.5 | 0.0033 | |||||||||||||||||||||||||||||||||||||||||||||||||||||||||||||||||||||||||||||||||||||||||||||
| Met | 29 | 27.5 | 0.5682 | 26.2 | 23.45 | 0.0276 | |||||||||||||||||||||||||||||||||||||||||||||||||||||||||||||||||||||||||||||||||||||||||||||
| Phe | 77.6 | 71.7 | 0.0980 | 70.7 | 65.15 | 0.0253 | |||||||||||||||||||||||||||||||||||||||||||||||||||||||||||||||||||||||||||||||||||||||||||||
| Thr | 141 | 121 | 0.0202 | 118 | 107.5 | 0.1104 | |||||||||||||||||||||||||||||||||||||||||||||||||||||||||||||||||||||||||||||||||||||||||||||
| Val | 261 | 230 | 0.0183 | 248 | 217 | 0.0018 | |||||||||||||||||||||||||||||||||||||||||||||||||||||||||||||||||||||||||||||||||||||||||||||
| Non_essential_AA | 2219.48 | 2252.27 | 0.8878 | 2200.86 | 2057.44 | 0.0023 | |||||||||||||||||||||||||||||||||||||||||||||||||||||||||||||||||||||||||||||||||||||||||||||
| Ala | 387 | 369 | 0.5813 | 395 | 341.5 | 0.0028 | |||||||||||||||||||||||||||||||||||||||||||||||||||||||||||||||||||||||||||||||||||||||||||||
| Asp | 2.37 | 1.59 | 0.0236 | 2.2 | 1.515 | 0.0324 | |||||||||||||||||||||||||||||||||||||||||||||||||||||||||||||||||||||||||||||||||||||||||||||
| Glu | 49 | 44.5 | 0.1930 | 65.2 | 41.25 | 2.90E-05 | |||||||||||||||||||||||||||||||||||||||||||||||||||||||||||||||||||||||||||||||||||||||||||||
| His | 100 | 94.5 | 0.1074 | 97.2 | 90.45 | 0.0073 | |||||||||||||||||||||||||||||||||||||||||||||||||||||||||||||||||||||||||||||||||||||||||||||
| Pro | 170 | 169 | 0.8524 | 151 | 134 | 0.0069 | |||||||||||||||||||||||||||||||||||||||||||||||||||||||||||||||||||||||||||||||||||||||||||||
| Trp | 59.2 | 54.1 | 0.0141 | 56.7 | 53.9 | 0.1040 | |||||||||||||||||||||||||||||||||||||||||||||||||||||||||||||||||||||||||||||||||||||||||||||
| Total_AA | 3332.09 | 3311.84 | 0.4727 | 3221.82 | 3020.73 | 0.0014 | |||||||||||||||||||||||||||||||||||||||||||||||||||||||||||||||||||||||||||||||||||||||||||||
| BCAA | 496.7 | 442 | 0.0236 | 456.6 | 393.15 | 0.0027 | |||||||||||||||||||||||||||||||||||||||||||||||||||||||||||||||||||||||||||||||||||||||||||||
| AAA | 215 | 200 | 0.0257 | 206.9 | 189.05 | 0.0200 | |||||||||||||||||||||||||||||||||||||||||||||||||||||||||||||||||||||||||||||||||||||||||||||
| Gln/Glu | 14.70 | 18.01 | 0.2088 | 10.46 | 17.56 | 0.0001 | |||||||||||||||||||||||||||||||||||||||||||||||||||||||||||||||||||||||||||||||||||||||||||||
| Cit/Orn | 0.31 | 0.35 | 0.0031 | 0.30 | 0.35 | 0.0082 | |||||||||||||||||||||||||||||||||||||||||||||||||||||||||||||||||||||||||||||||||||||||||||||
| Orn/Arg | 1.73 | 1.35 | 0.0133 | 1.92 | 1.65 | 0.0288 | |||||||||||||||||||||||||||||||||||||||||||||||||||||||||||||||||||||||||||||||||||||||||||||
| Kynurenine/Trp | 0.04 | 0.05 | 0.0063 | 0.04 | 0.04 | 0.9560 | |||||||||||||||||||||||||||||||||||||||||||||||||||||||||||||||||||||||||||||||||||||||||||||
| Putrescine/Orn | 1.15E-03 | 1.36E-03 | 0.0667 | 9.71E-04 | 1.30E-03 | 0.0841 | |||||||||||||||||||||||||||||||||||||||||||||||||||||||||||||||||||||||||||||||||||||||||||||
| Glucogenic AA | 779 | 760.7 | 0.7004 | 786 | 749.4 | 0.0288 | |||||||||||||||||||||||||||||||||||||||||||||||||||||||||||||||||||||||||||||||||||||||||||||
| DOPA | 0.16 | 0.18 | 0.0736 | 0.18 | 0.17 | 0.7277 | |||||||||||||||||||||||||||||||||||||||||||||||||||||||||||||||||||||||||||||||||||||||||||||
| Sarcosine | 8.61 | 6.72 | 0.0037 | 7.56 | 7.40 | 0.8485 | |||||||||||||||||||||||||||||||||||||||||||||||||||||||||||||||||||||||||||||||||||||||||||||
| SDMA | 0.75 | 0.94 | 0.0052 | 0.69 | 0.65 | 0.4576 | |||||||||||||||||||||||||||||||||||||||||||||||||||||||||||||||||||||||||||||||||||||||||||||
| alpha_AAA | 1.03 | 0.82 | 0.0131 | 0.93 | 0.72 | 0.0017 | |||||||||||||||||||||||||||||||||||||||||||||||||||||||||||||||||||||||||||||||||||||||||||||
| ADMA/Arg | 0.01 | 0.01 | 0.7388 | 0.01 | 0.01 | 0.0157 | |||||||||||||||||||||||||||||||||||||||||||||||||||||||||||||||||||||||||||||||||||||||||||||
| Data are medians. Variables were analyzed by Mann-Whitney U tests. | |||||||||||||||||||||||||||||||||||||||||||||||||||||||||||||||||||||||||||||||||||||||||||||||||||
Alpha-AAA, Dopa, Cit/Orn ratio, and age were significantly associated with muscle mass loss after multivariable stepwise adjustment in men (Table 3A); however, only glutamate was significantly associated with muscle mass loss in women (Table 3B). After multivariable stepwise adjustment, glutamate and Cit/Orn ratio were significantly associated with muscle mass loss in all subjects (Table 3C). These metabolites are involved in the urea cycle. It is likely that a higher catabolic rate of amino acids is linked with muscle mass loss in elderly Taiwanese subjects.
Table 3A. Multivariable analyses of muscle mass and metabolite associations in men.
| Male | Q1 | Q4 | P | Parameter Estimate (SE) Before Adjustment | Parameter Estimate (SE) After Adjustment | Multivariable -Stepwise |
| (N=33) | (N=33) | (Q1 vs Q4) | P-value | |||
| Age, yrs | 80.52±7.83 | 87.03±4.22 | 0.0374 | 0.1797 (0.0556) | 0.2828 (0.0998) | 0.0046 |
| Glu, μM | 55.59±25.93 | 45.27±13.77 | 0.049 | -0.0259 (0.0136) | NA | |
| Cit/Orn | 0.30±0.08 | 0.39±0.12 | 0.0011 | 11.3751 (4.0146) | 18.0713 (7.0956) | 0.0109 |
| DOPA, μM | 0.15±0.06 | 0.18±0.05 | 0.0372 | 11.0399 (5.5216) | 22.1837 (9.1725) | 0.0156 |
| alpha_AAA, μM | 1.03±0.40 | 0.82±0.21 | 0.0087 | -2.5589 (1.0321) | -3.1661 (1.4556) | 0.0296 |
Table 3B. Multivariable analyses of muscle mass and metabolite associations in women.
| Female | Q1 | Q4 | P | Parameter Estimate (SE) Before Adjustment | Parameter Estimate (SE) After Adjustment | Multivariable -Stepwise |
| (N=43) | (N=44) | (Q1 vs Q4) | P-value | |||
| Age, yrs | 80.02±8.14 | 80.23±6.95 | 0.5132 | 0.0037 (0.0287) | NA | |
| Glu, μM | 67.80±31.00 | 40.88±14.30 | 2.84E-06 | -0.0524 (0.0133) | -0.0524 (0.0133) | 7.79E-05 |
| Cit/Orn | 0.29±0.10 | 0.35±0.11 | 0.0112 | 5.4286 (2.2554) | NA | |
| DOPA, μM | 0.17±0.04 | 0.17±0.04 | 0.4844 | -3.8584 (5.4678) | NA | |
| alpha_AAA, μM | 0.95±0.28 | 0.75±0.26 | 0.0009 | -2.7284 (0.8838) | NA |
Table 3C. Multivariable analyses of muscle mass and metabolite associations in all participants.
| All | Q1 | Q4 | P | Parameter Estimate (SE) Before Adjustment | Parameter Estimate (SE) After Adjustment | Multivariable –Stepwise | |||||||||||||||||||||||||||||||||||||||||||||||||||||||||||||||||||||||||||||||||||||||||||||
| (N=76) | (N=77) | (Q1 vs Q4) | P-value | ||||||||||||||||||||||||||||||||||||||||||||||||||||||||||||||||||||||||||||||||||||||||||||||||
| Age, yrs | 80.24±7.96 | 83.14±6.81 | 0.3969 | 0.0532 (0.0225) | NA | ||||||||||||||||||||||||||||||||||||||||||||||||||||||||||||||||||||||||||||||||||||||||||||||
| Glu, μM | 62.49±29.36 | 42.76±14.15 | 6.65E-07 | -0.0413 (0.0093) | -0.0440 (0.0102) | 4.07E-05 | |||||||||||||||||||||||||||||||||||||||||||||||||||||||||||||||||||||||||||||||||||||||||||||
| Cit/Orn | 0.29±0.09 | 0.37±0.12 | 4.82E-05 | 7.1674 (1.9484) | 6.7456 (2.1960) | 0.0021 | |||||||||||||||||||||||||||||||||||||||||||||||||||||||||||||||||||||||||||||||||||||||||||||
| DOPA, μM | 0.17±0.05 | 0.17±0.04 | 0.2747 | 3.9774 (3.6411) | 9.8519 (4.6787) | 0.0352 | |||||||||||||||||||||||||||||||||||||||||||||||||||||||||||||||||||||||||||||||||||||||||||||
| alpha_AAA, μM | 0.99±0.34 | 0.78±0.24 | 2.56E-05 | -2.6296 (0.6673) | NA | ||||||||||||||||||||||||||||||||||||||||||||||||||||||||||||||||||||||||||||||||||||||||||||||
| Data are mean ± SD. SE: Standard Error. Variables were analyzed by independent samples t-tests or Chi-square test (age). Multiple logistic regression models were used to analyze the effect of gender on the dependent variable controlling for age and comorbidities, including hypertension, diabetes, hyperlipidemia, coronary artery disease (CAD), cancer, stroke, chronic kidney disease (CKD), chronic obstructive pulmonary disease (COPD), and osteoporosis. Model significance was presented in adjusted P-value. | |||||||||||||||||||||||||||||||||||||||||||||||||||||||||||||||||||||||||||||||||||||||||||||||||||
Discussion
Some studies have analyzed age-related metabolite changes in humans [21], but rarely investigated gender-specific differences. Because gender has a great impact on plasma metabolic profiling [18], we used an NMR- and LC-MS-based metabolomics approach to detect muscle mass-associated plasma metabolites in each gender. Metabolite concentration, including essential amino acids, BCAA, AAA, glutamate, aspartate, as well as Cit/Orn and Orn/arginine ratios showed similar changes in both gender with muscle loss. Multivariate analyses indicated a gender-specific metabolite signature. The changes in Alpha-AAA, Dopa, and Cit/Orn ratio were associated with muscle mass loss in men, whereas the change in only glutamate was significantly associated with muscle mass loss in women. Evaluating the level of urea cycle-related metabolites, such as glutamate and Cit/Orn ratio may help to explore the possible role of muscle mass loss in the elderly population. The metabolite pathways, including the urea cycle, Orn-proline-glutamate pathways, transamination, and glutaminolysis, are shown in Figure 3.
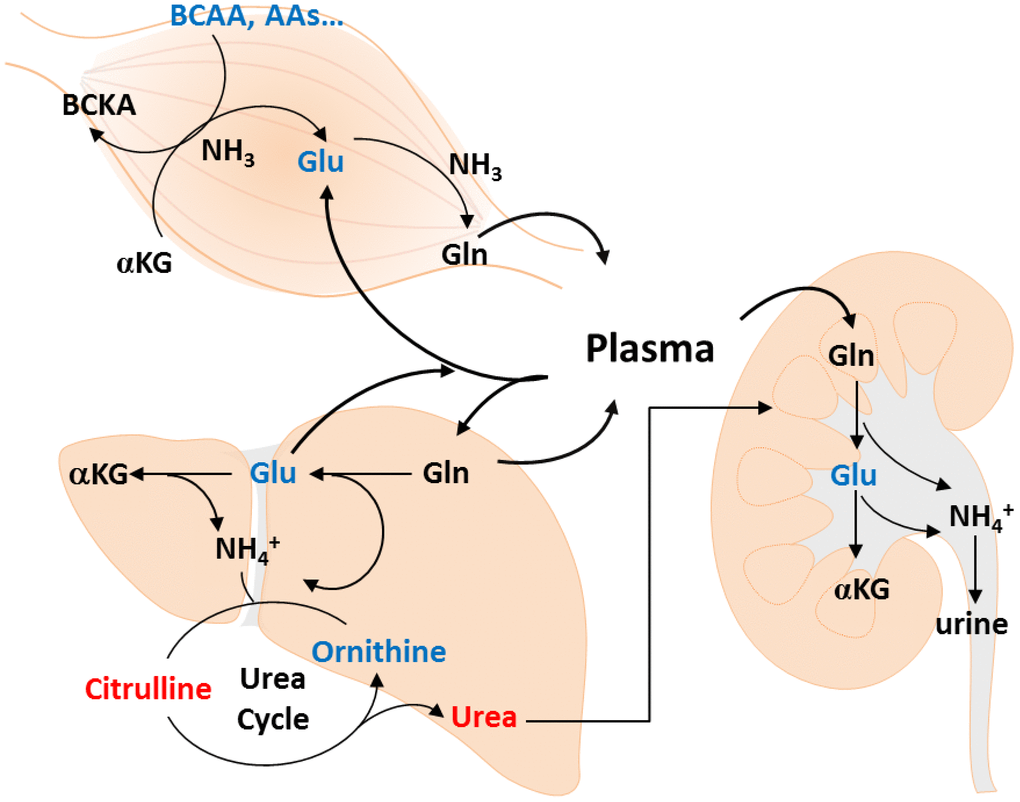
Figure 3. Metabolic changes of muscle loss in Taiwanese elderly population. Metabolic changes are mapped to pathways involved in amino acid catabolism, urea cycle, ornithine-proline-glutamate pathways, transamination, and glutaminolysis.
An increased glutamine/glutamate ratio in the Q4 female group indicated accelerated breakdown of amino acids and insufficient glutamine anaplerosis to restore glutamate. Glutamine-derived glutamate supports the levels of many amino acid pools in the cell through the action of aminotransferases; suppresses the amino acid-sensing kinase, general control nonderepressible 2; and inhibits the activating transcription factor 4 (ATF4). ATF4 is a key mediator of age-related muscle weakness and atrophy, including starvation, muscle disuse, and aging [22–24]. In addition to its role in transamination reactions, glutamate can be used to produce glutamine, used for extracellular matrix production [25]. Aspartate plays key role in both purine and pyrimidine biosynthesis to support cell division, and the biosynthesis relying on both glutamate flux through the tricarboxylic acid cycle and glutamate transamination [26].
Although it is still unclear how glutamine anaplerosis declines during muscle mass loss, a recent study indicated that glutamate significantly associates with muscle mass and strength in Caucasian women [27]. The reduction of mitochondrial glutaminase expression and suppression of glutamine anaplerosis in aging mesenchymal stem cells has also been reported [28].
Several studies have shown impaired mitochondrial function in aging muscle [29]. It is likely that restoration of impaired glutamate uptake in aged skeletal muscle may coordinately decrease mitochondrial function or impair amino acid delivery.
Citrulline, an intermediate of the urea cycle and an endogenous precursor of arginine, plays a role in regulating nitrogen homeostasis [30, 31]. In our study, Cit/Orn ratio increased in the Q4 male group, indicating high nitrogen load in the urea cycle during muscle mass loss. Both BUN and creatinine levels increased in the Q4 male group, suggesting that nitrogen overload results from catabolism in aging skeletal muscle. In addition, several reports have shown that Cit levels in human blood increase with age [32, 33]. Multivariate analysis demonstrated that age and Cit/Orn ratio are associated with muscle mass loss in men. However, no differences in liver function were observed between male and female groups. Further investigation on nitrogen homeostasis and amino acid catabolic pathways is needed to explain the higher Cit/Orn ratio in older men with muscle mass loss.
Because the muscle tissue is a major site for glutamine synthesis in the human body, glutamine can be replenished by six amino acids, including leucine, isoleucine, valine, asparagine, aspartate, and glutamate [34]. In addition, enhanced glutamine synthase activity was found in the skeletal muscle of aged rats, but their plasma level of glutamine remained unchanged [35]. It is apparent that normal plasma levels of glutamine are insufficient to meet increased demands under stress. In elderly Taiwanese subjects, there was no significant change in glutamine plasma levels; however, glutamine/total amino acids ratio was higher in the muscle mass loss group in both genders. This implies that the amino acids in skeletal muscle are stored in catabolic state. In aged individuals, nitrogen excretion is enhanced through increase urea excretion in men, and the inhibition of glutamate in women. Although previous data have demonstrated the role of glutamine in age-related loss of muscle mass, in this study, we demonstrated the potential role of glutamine in regulating nutritional state during aging.
This study has several limitations. First, the cohort size of participants was small, with or without muscle mass loss in different gender groups. Second, metabolic biomarkers were not confirmed by a validation study. A follow-up longitudinal study is ongoing, under way for data validation. Notably, our study suggests that amino acid-related metabolites may be used as indicators of nutritional status and as potential biomarkers for muscle mass loss or sarcopenia.
Materials and Methods
Setting
The retired home currently has about 700 residents. The average age of the residents is 81.2 years old, and 61.2% of the residents are female. Most residents have the same living environment and share similar lifestyles, including dietary habits and exercise routines. They also receive medical care at the same medical institutions. Healthy, independent subjects enrolled in our study lived in this retired home, requiring no nursing assistance and aging above 65 years. The residents managed their daily living activities, including light housework, preparing meals, taking medications, shopping, using the telephone, and managing money, using other technologies, as well as socializing and organizing social events. All of the criteria should be tallied that the Short Portable Mental Screening Questionnaire (SPMSQ) with a score of 0 indicates no error and the score of activities of daily living (ADL) and instrumental activities of daily living (IADL) were intact. Our participants, although they may have chronic diseases and need medication, they are a group of healthy people who can take care of their daily lives without the assistance of others. Meeting the above conditions is considered “healthy elderly”.
Ethics statement
The study protocol was approved by the Institutional Review Board of Chang Gung Memorial Hospital. Written informed consent was obtained from all subjects.
Study design and participants
This study was performed in 2014 at a retirement home in Northern Taiwan. Plasma samples were obtained from participants for hematological, biochemical, and metabolomics studies. In addition, handgrip strength, gait speed, and muscle mass were also measured to identify the risk factors of sarcopenia.
Muscle mass index
The muscle mass of each participant was measured using dual energy X-ray absorptiometry (GE Lunar iDXATM; GE Healthcare, Madison, WI, USA), and the ASMI was calculated as appendicular skeletal muscle mass divided by height squared (kg/m2) [4, 36].
Gait speed
Each participant was asked to walk a distance of 4 m to measure his or her gait speed [4].
Handgrip strength
A hand dynamometer (Jamar Plus+ Digital Hand Dynamometer; Sammons Preston, Bollingbrook, IL, USA) was used to evaluate handgrip strength of each participant’s dominant hand [4].
NMR analysis of plasma samples
Plasma samples from the aged cohort (n=153) were obtained in EDTA tubes (BD Vacutainer, Franklin Lakes, NJ, USA). Each plasma sample (350 μL) was mixed with 350 μL of plasma buffer solution [75 mM Na2HPO4, 0.08% TSP 3-(trimethylsilyl) propionic-2,2,3,3-d4 acid, 2 mM NaN3, and 20% D2O], and 600 μL of the supernatant was then transferred to 5 mm NMR tubes for analysis.
1H NMR spectra were acquired on a Bruker Avance III HD 600 MHz NMR spectrometer at 310 K using a 5-mm inverse triple resonance CryoProbe (1H/13C/15N) (Bruker Biospin GmbH, Rheinstetten, Germany). The spectra were acquired by Carr-Purcell-Meiboom-Gill spin-echo pulse sequence with water suppression, a 4-s relaxation delay, and 80-ms T2 relaxation time. All NMR spectra were phased and baseline-corrected using Topspin software (version 3.2.2; Bruker Biospin GmbH, Rheinstetten, Germany), and then referenced to the chemical shift of 1H α-glucose at 5.23 ppm [37]. After processing, NMR spectra should reach the criterion of quality control that the line width at half-height to lactate resonance at 1.32 ppm is < 1.15 Hz.
Each 1H NMR spectrum from the plasma samples was segmented into equal widths (0.01 ppm), corresponding to regions 9.5-0.5 ppm, and the spectral data were normalized to the reference compound TSP by AMIX (version 3.9.14; Bruker Biospin GmbH, Rheinstetten, Germany). The resulting data sets were analyzed by SIMCA-P+ (version 13.0; Umetrics, Umea, Sweden). Resonant frequencies of each metabolite were acquired from the in-house library and Chenomx NMR Suite 7.1 (Chenomx, Edomonton, Canada).
Amino acids and biogenic amines quantification by LC-MS
A total of 153 plasma samples were analyzed with a commercially available kit (AbsoluteIDQ p180 kit; Biocrates Life Sciences AG, Innsbruck, Austria) using an Acquity BEH C18 column (75 mm × 2.1 mm, particle size of 1.7 μm) in the ultra-pressure liquid chromatography system (Waters Corporation, Milford, MA, USA) coupled with multiple reaction monitoring on a triple-quadrupole mass spectrometer (Xevo TQS-MS; Waters Corporation, Milford USA) operating in the multiple reaction monitoring. Metabolite concentrations were calculated and expressed as micrometers [38].
Statistical analysis
Study subjects were divided into four groups, Q1, Q2, Q3, and Q4, based on the quartiles of their appendicular skeletal muscle mass levels. The baseline characteristics and metabolite concentrations were presented as medians for continuous variables, and as counts (percentages) for categorical variables. Comparisons between male and female participants were carried out using the Mann-Whitney U test. Multiple logistic regression models were used to analyze the difference between men and women in each baseline characteristic and metabolite concentration when controlling for age and comorbidities, including hypertension, diabetes, hyperlipidemia, coronary artery disease, cancer, stroke, chronic kidney disease, chronic obstructive pulmonary disease, and osteoporosis. Collinearity diagnostics and the variance inflation factor of the variables were investigated to avoid multicollinearity. Corresponding model significance was presented as “Adjusted P value”. In univariate analysis of metabolites, the visual infusion phlebitis score of each was evaluated and compared between the Q1 and Q4 groups. In addition, the combined effect of significantly differentially expressed metabolites was examined using multiple regression models for men and women. The “Multivariate P value” was calculated after controlling for age and the nine previously mentioned comorbidity factors. To account for multiple testing, the Benjamini and Hochberg linear step-up method was performed [39], and false discovery rate adjusted P values were calculated using the MULTTEST procedure in SAS software (SAS Institute, Cary, NC, USA). A corrected P value less than 0.05 was considered statistically significant.
Author Contributions
Chi-Jen Lo drafted the manuscript and generated the data. Yu-Shien Ko and Yu-Chen Huang collected the data. Su-Wei Chang and Cheng-Yu Huang provided statistical analysis support. Hsiang-Yu Tang and Chi-Jen Lo analyzed and interpreted the data. Hung-Yao Ho revised the manuscript. Mei-Ling Cheng and Chih-Ming Lin provided critical manuscript review for important intellectual content.
Acknowledgments
The authors would like to thank the Chang Gung Memorial Hospital and Chang Gung Health and Culture Village for the help in monitoring this research.
Conflicts of Interest
The authors have no conflicts of interest to declare.
Funding
The authors acknowledge support from Chang Gung Memorial Hospital (Grants CMRPD1F0513, CMRPD1H0512, and CMRPD1J0261) and the Ministry of Science and Technology, Taiwan (Grants 107-2320-B-182-030 and 108-2320-B-182-006). The metabolomics study also receives support from Metabolomics Core Laboratory, Healthy Aging Research Center, Chang Gung University (Grants EMRPD1K0481, EMRPD1K0441, EMRPD1I0461, and EMRPD1I0501), the Featured Areas Research Center Program within the framework of the Higher Education Sprout Project by the Ministry of Education in Taiwan.
References
- 1. Liu CK, Leng X, Hsu FC, Kritchevsky SB, Ding J, Earnest CP, Ferrucci L, Goodpaster BH, Guralnik JM, Lenchik L, Pahor M, Fielding RA. The impact of sarcopenia on a physical activity intervention: the Lifestyle Interventions and Independence for Elders Pilot Study (LIFE-P). J Nutr Health Aging. 2014; 18:59–64. https://doi.org/10.1007/s12603-013-0369-0 [PubMed]
- 2. Fielding RA, Vellas B, Evans WJ, Bhasin S, Morley JE, Newman AB, Abellan van Kan G, Andrieu S, Bauer J, Breuille D, Cederholm T, Chandler J, De Meynard C, et al, and International Working Group on Sarcopenia. Sarcopenia: an undiagnosed condition in older adults. Current consensus definition: prevalence, etiology, and consequences. International working group on sarcopenia. J Am Med Dir Assoc. 2011; 12:249–56. https://doi.org/10.1016/j.jamda.2011.01.003 [PubMed]
- 3. Studenski SA, Peters KW, Alley DE, Cawthon PM, McLean RR, Harris TB, Ferrucci L, Guralnik JM, Fragala MS, Kenny AM, Kiel DP, Kritchevsky SB, Shardell MD, et al. The FNIH sarcopenia project: rationale, study description, conference recommendations, and final estimates. J Gerontol A Biol Sci Med Sci. 2014; 69:547–58. https://doi.org/10.1093/gerona/glu010 [PubMed]
- 4. Chen LK, Liu LK, Woo J, Assantachai P, Auyeung TW, Bahyah KS, Chou MY, Chen LY, Hsu PS, Krairit O, Lee JS, Lee WJ, Lee Y, et al. Sarcopenia in Asia: consensus report of the Asian working group for sarcopenia. J Am Med Dir Assoc. 2014; 15:95–101. https://doi.org/10.1016/j.jamda.2013.11.025 [PubMed]
- 5. Cruz-Jentoft AJ, Bahat G, Bauer J, Boirie Y, Bruyère O, Cederholm T, Cooper C, Landi F, Rolland Y, Sayer AA, Schneider SM, Sieber CC, Topinkova E, et al, and Writing Group for the European Working Group on Sarcopenia in Older People 2 (EWGSOP2), and the Extended Group for EWGSOP2. Sarcopenia: revised European consensus on definition and diagnosis. Age Ageing. 2019; 48:601. https://doi.org/10.1093/ageing/afz046 [PubMed]
- 6. Whitney DG, Peterson MD. The association between differing grip strength measures and mortality and cerebrovascular event in older adults: national health and aging trends study. Front Physiol. 2019; 9:1871. https://doi.org/10.3389/fphys.2018.01871 [PubMed]
- 7. Visser M, Goodpaster BH, Kritchevsky SB, Newman AB, Nevitt M, Rubin SM, Simonsick EM, Harris TB. Muscle mass, muscle strength, and muscle fat infiltration as predictors of incident mobility limitations in well-functioning older persons. J Gerontol A Biol Sci Med Sci. 2005; 60:324–33. https://doi.org/10.1093/gerona/60.3.324 [PubMed]
- 8. Bianchi L, Ferrucci L, Cherubini A, Maggio M, Bandinelli S, Savino E, Brombo G, Zuliani G, Guralnik JM, Landi F, Volpato S. The predictive value of the EWGSOP definition of sarcopenia: results from the InCHIANTI study. J Gerontol A Biol Sci Med Sci. 2016; 71:259–64. https://doi.org/10.1093/gerona/glv129 [PubMed]
- 9. Lustgarten MS, Price LL, Chale A, Phillips EM, Fielding RA. Branched chain amino acids are associated with muscle mass in functionally limited older adults. J Gerontol A Biol Sci Med Sci. 2014; 69:717–24. https://doi.org/10.1093/gerona/glt152 [PubMed]
- 10. Murphy RA, Moore SC, Playdon M, Meirelles O, Newman AB, Milijkovic I, Kritchevsky SB, Schwartz A, Goodpaster BH, Sampson J, Cawthon P, Simonsick EM, Gerszten RE, et al, and Health ABC Study. Metabolites associated with lean mass and adiposity in older black men. J Gerontol A Biol Sci Med Sci. 2017; 72:1352–59. https://doi.org/10.1093/gerona/glw245 [PubMed]
- 11. Newgard CB, An J, Bain JR, Muehlbauer MJ, Stevens RD, Lien LF, Haqq AM, Shah SH, Arlotto M, Slentz CA, Rochon J, Gallup D, Ilkayeva O, et al. A branched-chain amino acid-related metabolic signature that differentiates obese and lean humans and contributes to insulin resistance. Cell Metab. 2009; 9:311–26. https://doi.org/10.1016/j.cmet.2009.02.002 [PubMed]
- 12. Bren L. Metabolomics: working toward personalized medicine. FDA Consum. 2005; 39:28–33. [PubMed]
- 13. Armstrong CW, McGregor NR, Sheedy JR, Buttfield I, Butt HL, Gooley PR. NMR metabolic profiling of serum identifies amino acid disturbances in chronic fatigue syndrome. Clin Chim Acta. 2012; 413:1525–31. https://doi.org/10.1016/j.cca.2012.06.022 [PubMed]
- 14. Armstrong CW, McGregor NR, Butt HL, Gooley PR. Metabolism in chronic fatigue syndrome. Adv Clin Chem. 2014; 66:121–72. https://doi.org/10.1016/b978-0-12-801401-1.00005-0 [PubMed]
- 15. Naviaux RK, Naviaux JC, Li K, Bright AT, Alaynick WA, Wang L, Baxter A, Nathan N, Anderson W, Gordon E. Metabolic features of chronic fatigue syndrome. Proc Natl Acad Sci USA. 2016; 113:E5472–80. https://doi.org/10.1073/pnas.1607571113 [PubMed]
- 16. Lu Y, Karagounis LG, Ng TP, Carre C, Narang V, Wong G, Tan CT, Zin Nyunt MS, Gao Q, Abel B, Poidinger M, Fulop T, Bosco N, Larbi A. Systemic and metabolic signature of sarcopenia in community-dwelling older adults. J Gerontol A Biol Sci Med Sci. 2020; 75:309–17. https://doi.org/10.1093/gerona/glz001 [PubMed]
- 17. Hartiala JA, Tang WH, Wang Z, Crow AL, Stewart AF, Roberts R, McPherson R, Erdmann J, Willenborg C, Hazen SL, Allayee H. Genome-wide association study and targeted metabolomics identifies sex-specific association of CPS1 with coronary artery disease. Nat Commun. 2016; 7:10558. https://doi.org/10.1038/ncomms10558 [PubMed]
- 18. Krumsiek J, Mittelstrass K, Do KT, Stückler F, Ried J, Adamski J, Peters A, Illig T, Kronenberg F, Friedrich N, Nauck M, Pietzner M, Mook-Kanamori DO, et al. Gender-specific pathway differences in the human serum metabolome. Metabolomics. 2015; 11:1815–33. https://doi.org/10.1007/s11306-015-0829-0 [PubMed]
- 19. Gonzalez-Covarrubias V, Beekman M, Uh HW, Dane A, Troost J, Paliukhovich I, van der Kloet FM, Houwing-Duistermaat J, Vreeken RJ, Hankemeier T, Slagboom EP. Lipidomics of familial longevity. Aging Cell. 2013; 12:426–34. https://doi.org/10.1111/acel.12064 [PubMed]
- 20. Audano M, Maldini M, De Fabiani E, Mitro N, Caruso D. Gender-related metabolomics and lipidomics: from experimental animal models to clinical evidence. J Proteomics. 2018; 178:82–91. https://doi.org/10.1016/j.jprot.2017.11.001 [PubMed]
- 21. Chaleckis R, Murakami I, Takada J, Kondoh H, Yanagida M. Individual variability in human blood metabolites identifies age-related differences. Proc Natl Acad Sci USA. 2016; 113:4252–59. https://doi.org/10.1073/pnas.1603023113 [PubMed]
- 22. Sacheck JM, Hyatt JP, Raffaello A, Jagoe RT, Roy RR, Edgerton VR, Lecker SH, Goldberg AL. Rapid disuse and denervation atrophy involve transcriptional changes similar to those of muscle wasting during systemic diseases. FASEB J. 2007; 21:140–55. https://doi.org/10.1096/fj.06-6604com [PubMed]
- 23. Ebert SM, Monteys AM, Fox DK, Bongers KS, Shields BE, Malmberg SE, Davidson BL, Suneja M, Adams CM. The transcription factor ATF4 promotes skeletal myofiber atrophy during fasting. Mol Endocrinol. 2010; 24:790–99. https://doi.org/10.1210/me.2009-0345 [PubMed]
- 24. Ebert SM, Dyle MC, Bullard SA, Dierdorff JM, Murry DJ, Fox DK, Bongers KS, Lira VA, Meyerholz DK, Talley JJ, Adams CM. Identification and small molecule inhibition of an activating transcription factor 4 (ATF4)-dependent pathway to age-related skeletal muscle weakness and atrophy. J Biol Chem. 2015; 290:25497–511. https://doi.org/10.1074/jbc.M115.681445 [PubMed]
- 25. Phang JM, Liu W, Hancock CN, Fischer JW. Proline metabolism and cancer: emerging links to glutamine and collagen. Curr Opin Clin Nutr Metab Care. 2015; 18:71–77. https://doi.org/10.1097/MCO.0000000000000121 [PubMed]
- 26. Birsoy K, Wang T, Chen WW, Freinkman E, Abu-Remaileh M, Sabatini DM. An essential role of the mitochondrial electron transport chain in cell proliferation is to enable aspartate synthesis. Cell. 2015; 162:540–51. https://doi.org/10.1016/j.cell.2015.07.016 [PubMed]
- 27. Sensi SL. Alzheimer’s disease, time to turn the tide. Aging (Albany NY). 2018; 10:2537–38. https://doi.org/10.18632/aging.101581 [PubMed]
- 28. Huang T, Liu R, Fu X, Yao D, Yang M, Liu Q, Lu WW, Wu C, Guan M. Aging reduces an ERRalpha-directed mitochondrial glutaminase expression suppressing glutamine anaplerosis and osteogenic differentiation of mesenchymal stem cells. Stem Cells. 2017; 35:411–24. https://doi.org/10.1002/stem.2470 [PubMed]
- 29. Gouspillou G, Bourdel-Marchasson I, Rouland R, Calmettes G, Biran M, Deschodt-Arsac V, Miraux S, Thiaudiere E, Pasdois P, Detaille D, Franconi JM, Babot M, Trézéguet V, et al. Mitochondrial energetics is impaired in vivo in aged skeletal muscle. Aging Cell. 2014; 13:39–48. https://doi.org/10.1111/acel.12147 [PubMed]
- 30. Breuillard C, Cynober L, Moinard C. Citrulline and nitrogen homeostasis: an overview. Amino Acids. 2015; 47:685–91. https://doi.org/10.1007/s00726-015-1932-2 [PubMed]
- 31. Calvani R, Picca A, Marini F, Biancolillo A, Gervasoni J, Persichilli S, Primiano A, Coelho-Junior HJ, Bossola M, Urbani A, Landi F, Bernabei R, Marzetti E. A distinct pattern of circulating amino acids characterizes older persons with physical frailty and sarcopenia: results from the BIOSPHERE study. Nutrients. 2018; 10:1691. https://doi.org/10.3390/nu10111691 [PubMed]
- 32. Kouchiwa T, Wada K, Uchiyama M, Kasezawa N, Niisato M, Murakami H, Fukuyama K, Yokogoshi H. Age-related changes in serum amino acids concentrations in healthy individuals. Clin Chem Lab Med. 2012; 50:861–70. https://doi.org/10.1515/cclm-2011-0846 [PubMed]
- 33. Pitkänen HT, Oja SS, Kemppainen K, Seppä JM, Mero AA. Serum amino acid concentrations in aging men and women. Amino Acids. 2003; 24:413–21. https://doi.org/10.1007/s00726-002-0338-0 [PubMed]
- 34. Cruzat V, Macedo Rogero M, Noel Keane K, Curi R, Newsholme P. Glutamine: metabolism and immune function, supplementation and clinical translation. Nutrients. 2018; 10:1564. https://doi.org/10.3390/nu10111564 [PubMed]
- 35. Pinel C, Coxam V, Mignon M, Taillandier D, Cubizolles C, Lebecque P, Darmaun D, Meynial-Denis D. Alterations in glutamine synthetase activity in rat skeletal muscle are associated with advanced age. Nutrition. 2006; 22:778–85. https://doi.org/10.1016/j.nut.2006.05.005 [PubMed]
- 36. Kim J, Wang Z, Heymsfield SB, Baumgartner RN, Gallagher D. Total-body skeletal muscle mass: estimation by a new dual-energy X-ray absorptiometry method. Am J Clin Nutr. 2002; 76:378–83. https://doi.org/10.1093/ajcn/76.2.378 [PubMed]
- 37. Dona AC, Jiménez B, Schäfer H, Humpfer E, Spraul M, Lewis MR, Pearce JT, Holmes E, Lindon JC, Nicholson JK. Precision high-throughput proton NMR spectroscopy of human urine, serum, and plasma for large-scale metabolic phenotyping. Anal Chem. 2014; 86:9887–94. https://doi.org/10.1021/ac5025039 [PubMed]
- 38. Cheng ML, Wang CH, Shiao MS, Liu MH, Huang YY, Huang CY, Mao CT, Lin JF, Ho HY, Yang NI. Metabolic disturbances identified in plasma are associated with outcomes in patients with heart failure: diagnostic and prognostic value of metabolomics. J Am Coll Cardiol. 2015; 65:1509–20. https://doi.org/10.1016/j.jacc.2015.02.018 [PubMed]
- 39. Benjamini Y, Hochberg Y. Controlling the False Discovery Rate: A Practical and Powerful Approach to Multiple Testing. J R Stat Soc Series B Stat Methodol. 1995; 57:289–300. https://doi.org/10.1111/j.2517-6161.1995.tb02031.x