


Introduction
Hepatocellular carcinoma (HCC) is one of the world's deadliest cancers [1]. HCC can be diagnosed in early stages by ultrasonography, when it may still be treated by liver resection or transplantation, resulting in a 5-year survival rate above 50%. [2] In fact, several other therapies can treat early-stage HCC, including radiofrequency ablation, radioembolization and transarterial chemo embolization [3]. However, 70% of patients are diagnosed with HCC when the disease is already in a late stage. Only one systemic therapy is available for advanced HCC: sorafenib [4], which inhibits the proliferation of tumor cells by inhibiting Raf kinase and several receptor tyrosine kinases [5]. Unfortunately, sorafenib provides benefit to only 30% of patients with advanced HCC, in part because many patients develop resistance to the drug within 6 months [4].
The mechanism of sorafenib resistance (SR) in HCC is poorly understood. Some studies have identified individual molecules that may confer SR, such as PHGDH [6], the Akt pathway activator SNHG1 [7] and PMPCB [8]. This led us to hypothesize that SR is caused by multiple molecular modules. To explore this possibility, we used two HCC cell lines to identify genes differentially expressed in the presence of SR, based on which we developed a comprehensive transcription regulatory network.
Results
Using HepG2 and Huh7 cell lines, we compared SR and sorafenib-sensitive (SS) cells in order to identify Differentially expressed genes (DEGs) associated with SR. The DEGs common to both cell lines were then used to identify functional modules and regulatory molecules that may help identify molecular pathways and networks associated with SR (Figure 1).
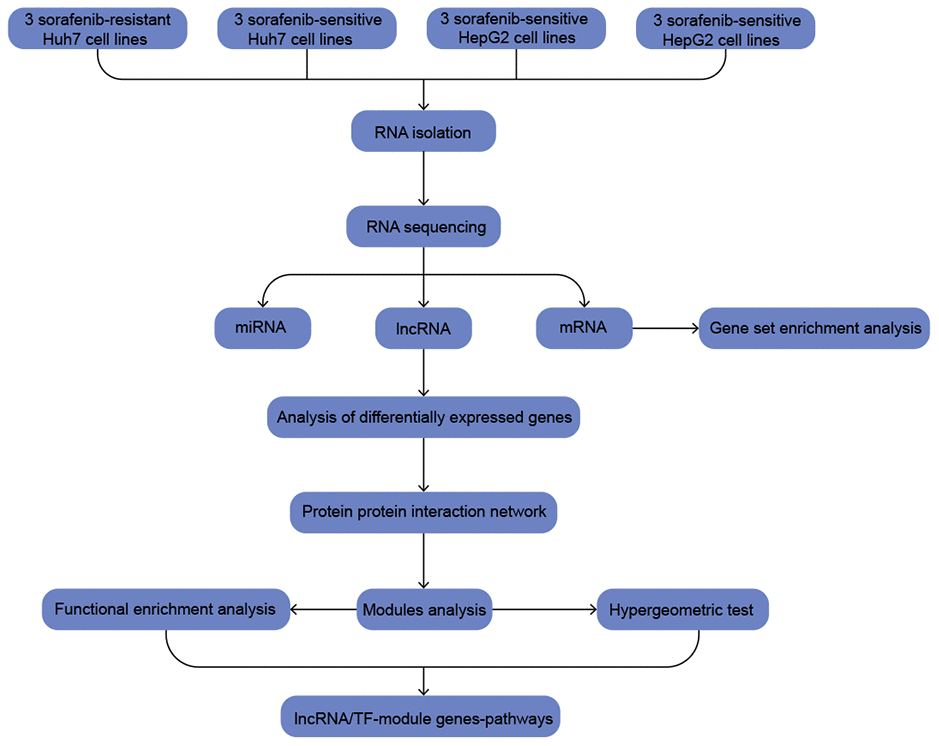
Figure 1. The workflow of the present study.
SR is associated with multiple genes and pathways in the two HCC cell lines
In the HepG2 cell line, 3075 genes were up-regulated and 638 down-regulated in association with SR. The corresponding numbers in Huh7 cells were 6946 and 2310 (Figure 2A). The sorafenib-targeted genes up-regulated in association with SR were ABCB1, ABCC4, ABCG2, BRAF and RALBP1 in the HepG2 line (Figure 2B); and ABCC2, ABCG2, CYP2B6, CYP2C19, CYP3A7, RAF1, RALBP1, and UGT1A1 in the Huh7 line (Figure 2C). Cluster analysis showed clear separation of DEGs between SR and SS cells of both lines (Figure 2D, 2E). We extracted 1630 up-regulated DEGs common to the two cell lines (Figure 2F) and 132 down-regulated genes common to the two lines (Figure 2G). Gene set enrichment analysis identified enrichment of the following pathways in SR HepG2 cells: apoptosis, the MAPK signaling pathway, and the p53 signaling pathway. Pathways enriched in SR Huh7 cells were the p53 signaling pathway, pathways in cancer, and the VEGF signaling pathway (Figure 2H).
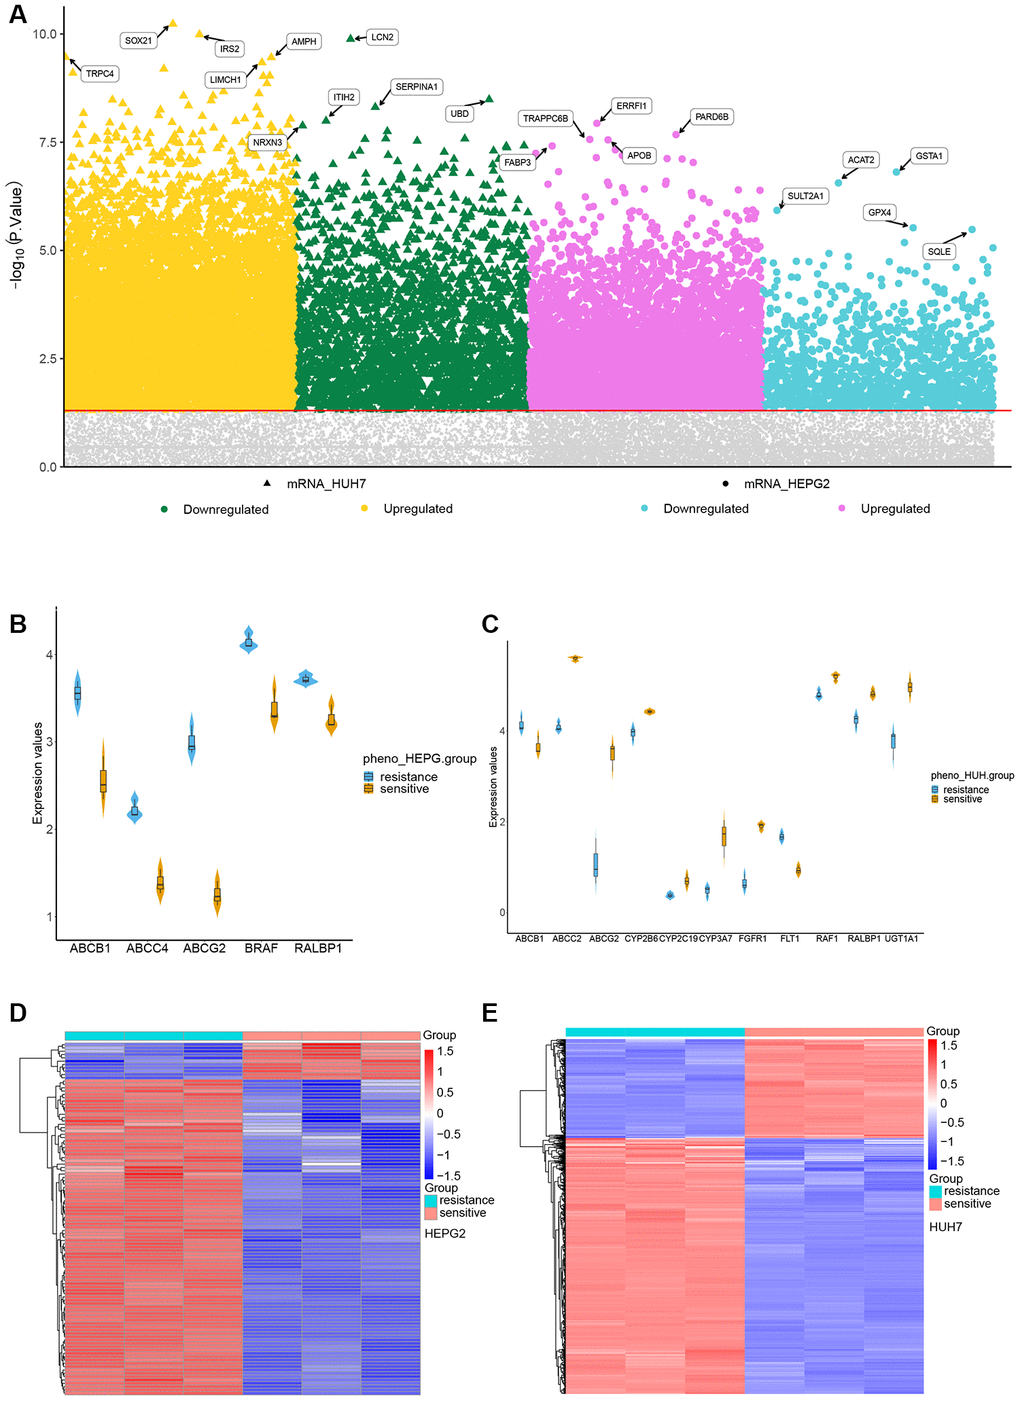
Figure 2. Identification of differentially expressed genes (DEGs) in sorafenib resistance. (A) DEGs in sorafenib resistance. (B) Expression of sorafenib-targeted genes in sorafenib-sensitive and -resistant HepG2 cells. (C) Expression of sorafenib-targeted genes in sorafenib-sensitive and -resistant Huh7 cells. (D) Cluster heatmap of DEGs between sorafenib-sensitive and -resistant HepG2 cells. (E) Cluster heatmap between sorafenib-sensitive and -resistant Huh7 cells.
(F) Genes up-regulated in association with sorafenib resistance in HepG2 and Huh7 cells. (G) Genes down-regulated in association with sorafenib resistance in HepG2 and Huh7 cells. (H) Gene set enrichment analysis of genes up- or down-regulated in association with sorafenib resistance in both HCC cell lines.
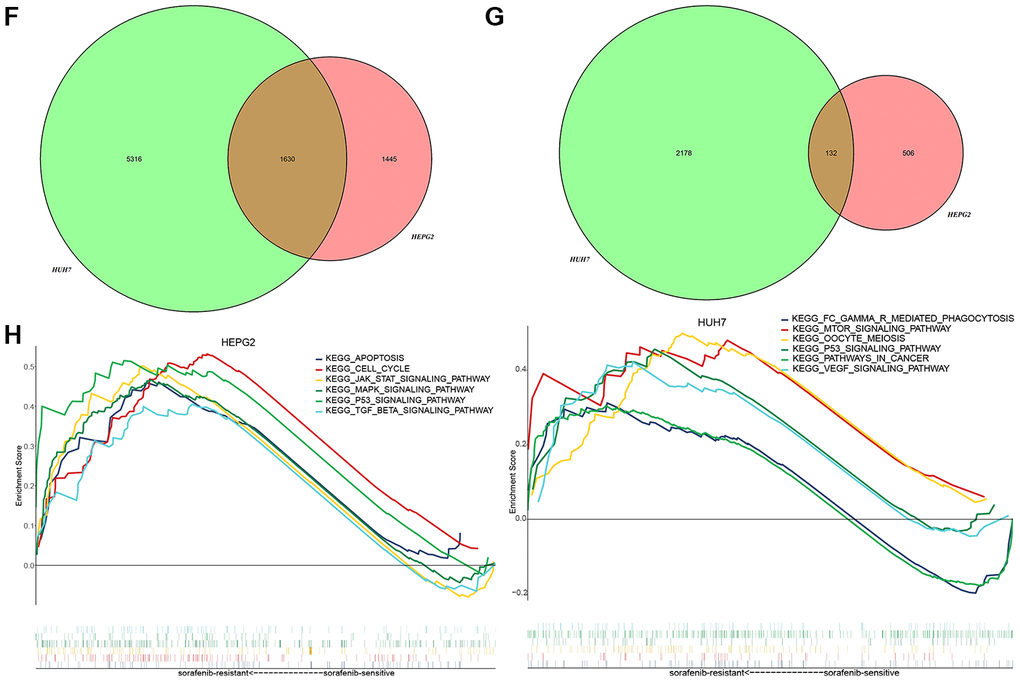
Figure 2. Identification of differentially expressed genes (DEGs) in sorafenib resistance. (F) Genes up-regulated in association with sorafenib resistance in HepG2 and Huh7 cells. (G) Genes down-regulated in association with sorafenib resistance in HepG2 and Huh7 cells. (H) Gene set enrichment analysis of genes up- or down-regulated in association with sorafenib resistance in both HCC cell lines.
SR is associated with perturbations in multiple functional modules
Nine functional modules were identified in protein-protein interaction (PPI) networks derived from the common DEGs (Supplementary Figure 1, Supplementary Table 1). Nearly all module genes in these two HCC cell lines were up-regulated in SR cells (Figure 3A), suggesting that SR results from dysfunction in multiple modules. There were 2503 biological processes (BPs) (Supplementary Table 2), 560 cellular components (CCs) (Supplementary Table 3), 407 molecular functions (MFs) (Supplementary Table 4) and 57 Kyoto Encyclopedia of Genes and Genomes (KEGG) pathways (Supplementary Table 5). DEGs were involved in various mitosis-related BPs, such as regulation of cytoskeleton organization, microtubule-associated proteins, and the establishment of minimal bundle localization (Figure 3B). The DEGs were involved in various cancer-related pathways as well as virus-associated pathways, such as the cell cycle, Hippo signaling pathway, viral carcinogenesis, and hepatitis C (Figure 3C).
Figure 3. KEGG pathways and biological processes (BPs) predicted to be perturbed in sorafenib-resistant HCC cells. (A) Modules with similar functions in HepG2 and Huh7 cells. (B) Perturbed BPs in HepG2 and Huh7 cells. (C) Perturbed KEGG pathways in HepG2 and Huh7 cells.
microRNAs (miRNAs) and transcription factor (TF) may promote the functional modules involved in SR
The hypergeometric test was used to predict miRNAs and TFs participating in the target functional modules. About 27 miRNAs were identified as potentially regulating functional modules involved in SR (Figure 4A). We did not identify any long non-coding RNAs (lncRNAs) involved in SR. In the network linking TFs with target genes and KEGG pathways, the up-regulated RB1 TF was predicted to promote modules related to SR (Figure 4B). These results suggest that 27 miRNAs and one TF may help mediate SR in HCC.
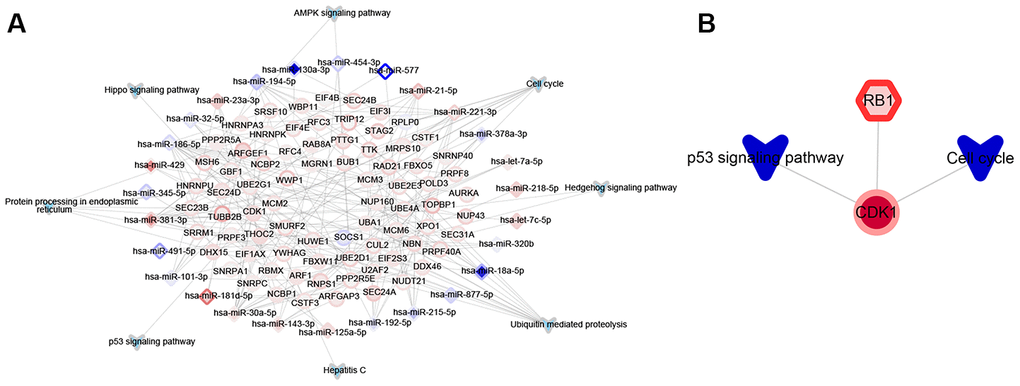
Figure 4. Significant upstream regulators of functional modules associated with sorafenib resistance in HCC cells. (A) Significant miRNA regulators. The border color of nodes reflects the log (fold change) in HepG2 cells; the inside color reflects the log (fold change) in Huh7 cells. (B) Significant transcription factor (TF) regulators. Nodes are colored as in panel A.
Comprehensive landscape of SR in HCC
A heatmap of miRNAs identified several likely to function in SR in both HCC cell lines (Figure 5A). The comprehensive landscape of miRNAs and one TF promoting KEGG pathways (Figure 5B) identified numerous pathways that may contribute to SR in HCC (Figure 5C). These pathways included the cell cycle, hepatitis C, Hippo signaling pathway, p53 signaling pathway, protein processing in the endoplasmic reticulum, and ubiquitin-mediated proteolysis. In the p53 signaling pathway, we found that CDK1 was up-regulated, which might inhibit cell cycle arrest. We also found that in ubiquitin-mediated proteolysis, miRNAs promoted mainly different types of E3 enzymes, while the expression of UBE2G1 in the E2 enzyme was up-regulated. The E2 and E3 enzymes are involved mainly in substrate transfer. In our study, UBE2G1 was up-regulated in the ubiquitin ligase complex, which might further promote protein processing in the endoplasmic reticulum. YWHAG was also up-regulated, which might inhibit hepatitis C replication within cells, as well as promote anti-apoptotic genes, pro-proliferation genes, cell contact inhibition and organ size control by the Hippo signaling pathway. The cell cycle genes TTK, BUB1, CDK, YWHAG, MCM2, MCM3 and MCM6 were up-regulated, and nearly all were up-regulated by miRNAs, except for SOCS1 in the multi-subunit ring-finger type E3 enzyme of ubiquitin-mediated proteolysis. These miRNAs might promote and activate pathways that contribute to SR in HCC.
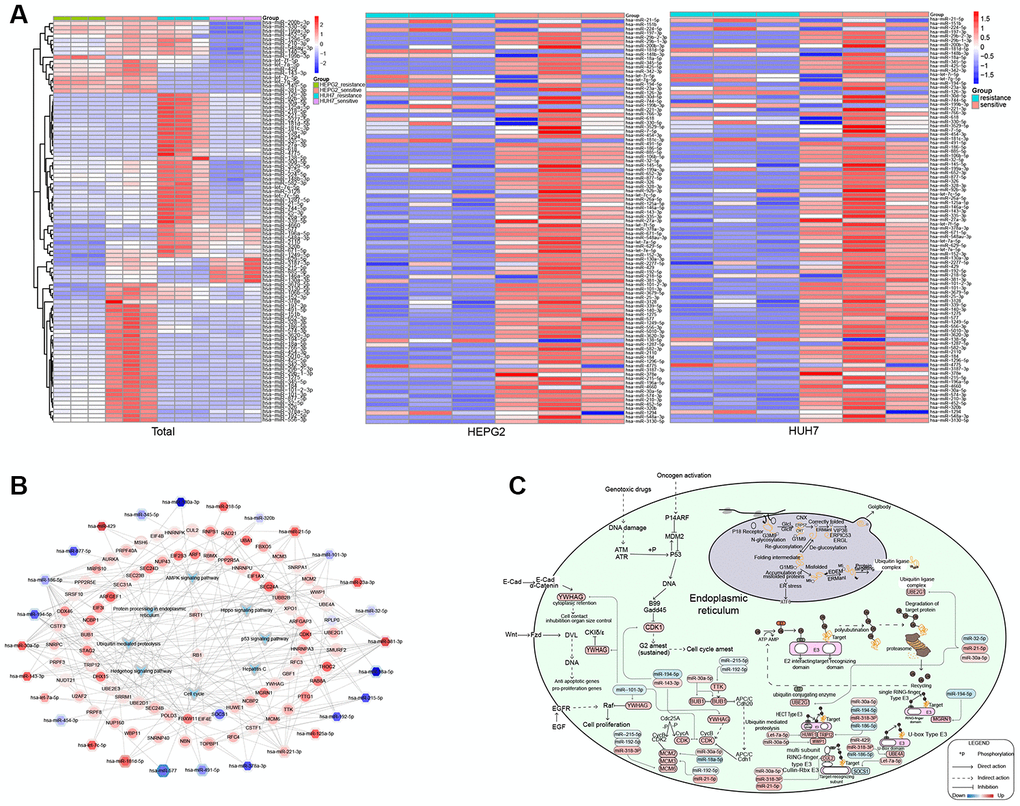
Figure 5. Potential mechanisms of resistance to sorafenib in hepatocellular carcinoma (HCC). (A) Expression of microRNAs (miRNAs) associated with resistance. (B) Comprehensive landscape of miRNAs and transcription factors (TFs) regulating pathways perturbed in sorafenib-resistant HCC. The border color of nodes reflects the log (fold change) in HepG2 cells; the inside color reflects the log (fold change) in Huh7 cells. (C) Potential mechanisms of resistance to sorafenib.
Discussion
Sorafenib remains the only drug approved to treat late-stage HCC, yet its efficacy is limited by primary or acquired resistance. The analyses in the present study identified molecular pathways and networks, as well as their regulators, that may contribute to such resistance. This may guide efforts to reverse resistance, increasing the efficacy of sorafenib.
In the p53 signaling pathway, genetic drugs can inhibit CDK1 and promote the cell cycle. However, in HCC, miR-194-5p and miR-143-3p can mediate high expression of CDK1 and inhibit cell cycle arrest, thus promoting HCC. The increase in MCM2, MCM3, and MCM6 is related to poor performance of the tumor. Removing MCM6 can delay the s/G2 phase of hepatoma cells [9]. Simultaneously, TTK and BUB1 may promote the occurrence of HCC separately [10, 11]. We found that down-regulation of miR-192-5p was associated with SR, consistent with the ability of the miRNA to inhibit HCC [12].
Hepatitis C virus (HCV) is a major cause of HCC [13], and abnormal activation of the Hippo signaling pathway can cause HCC [14]. We found that miR-101-3p negatively regulated YWHAG in the hepatitis C pathway, and that the Hippo signaling pathway promoted HCC. Chaperones in the lumen aid endoplasmic reticulum of protein folding in that compartment. Correctly folded proteins are packaged into transport vesicles, which ferry them to the Golgi complex. In this pathway, miR-32-5p, miR-21-5p and miR-30a-5p up-regulates UBE2G1 in the ubiquitin ligase complex. Thus, abnormalities in the endoplasmic reticulum may contribute to many human diseases [15].
Studies found that SPOP can inhibit the metastasis of HCC cells through the ubiquitin-dependent proteolysis of SENP7 [16]. We identified several SR-associated DEGs related to the E2 (ubiquitin-conjugating) enzymes and E3 (ubiquitin ligase) enzymes. These E2 and E3 DEGs are predicted to be up-regulated by miRNAs, implying that SR involves an increase in ubiquitin-mediated proteolysis. Conversely, the SOCS1 component of the E3 enzyme was down-regulated in SR cells, and lower expression of SOCS1 has been linked to deeper infiltration of HCC cells [17].
We identified several miRNAs that were associated with SR in HCC. Some studies have linked HCC to down-regulation of miR-194-5p [18] and up-regulation of miR-21-5p [19], while miR-192-5p may be clinically useful in diagnosis of the disease [20]. In contrast, miR-221-3p may be unrelated to HCC prognosis [21], whereas miR-429 may be a target in HCC treatment [22], and miR-877-5p may be involved in the pathogenesis of HCC [23]. Relatively few studies have examined miRNAs related to HCC. The present work suggests that miRNAs may promote HCC by altering gene expression, leading to SR in HCC.
Although the present study may provide new insights into SR in HCC, some limitations should be noted. First, the study was based primarily on bioinformatics analysis, so our results should be verified and extended in molecular experiments. Second, we focused on transcriptional regulatory mechanisms of SR, so further work is needed to examine additional mechanisms at the genome level.
Conclusions
We identified several functional modules and their potential miRNA and TF that may contribute to SR in HCC. Our results provide numerous leads to guide future mechanistic studies of resistance.
Materials and Methods
Cell lines
The HCC cell lines HepG2 and Huh7 were obtained (ScienCell, San Diego, California, USA). Three SR and three SS HCC cell lines of HepG2 and Huh7 were obtained based on prior studies [24, 25] SR-HCC cell lines were established through incubation with sorafenib initially at 5 μM, which was increased by 1 μM per week for 1-2 months. SR-HCC cells were maintained in culture in the presence of sorafenib.
RNA isolation and characterization
Total RNA was isolated from SR- and SS-HCC cell lines using TRIzolTM (Invitrogen, USA) and the RNeasy Mini Kit (Qiagen) according to the manufacturers’ instructions. RNA concentration and purity were assessed using the RNA Nano 6000 Assay Kit on the Agilent 2100 Bioanalyzer (Agilent Technologies, Palo Alto, CA, USA), the NanoDrop system (Thermo Fisher Scientific Inc. Waltham, USA) and 1% agarose gel electrophoresis.
Strand-specific RNA-seq library preparation and sequencing
Samples (1 μg) with an RNA integrity number ≥ 7 were deep-sequenced using Ribo-Zero™ rRNA removal Kit (Human/Mouse/Rat) /(Yeast) /(Bacteria) (Illumina, San Diego, USA) according to the manufacturer's protocol. Each sample was used to generate a strand-specific RNA-seq library as follows. First the ribosomal RNA in the sample of total RNA was removed, then the RNA was fragmented and reverse-transcribed using ProtoScript II Reverse Transcriptase (New England Biolabs, USA) with random primers and actinomycin D (Solarbio life sciences, USA). The second strand of cDNA was prepared using the Second Strand Synthesis Enzyme Mix with dACG-TP/dUTP (New England Biolabs, USA), then the double-stranded cDNA was purified using the AxyPrep Mag PCR Clean-up (Axygen Biosciences, Inc.), and both ends were repaired using the End Prep Enzyme Mix (NGS Fast DNA Library Prep Set for Illumina, Illumina, San Diego, USA), which added dA-tails. Subsequent T-A ligation created adaptors on both ends.
Adaptor-ligated DNA that contained inserts approximately 300 bp long and that was altogether approximately 360 bp long was isolated, and the second strand (marked with dUTP) was digested using Uracil-Specific Excision Reagent (New England Biolabs, USA). Every sample was amplified by PCR for 11 cycles using primers P5 and P7, which contained sequences that could anneal with the flow cell to perform a bridge PCR. The P7 primer also contained a six-base signature allowing for multiplexing. The PCR products were purified, and library quality was assessed. The resulting libraries were sequenced in 2 × 150 bp paired-end mode on a HiSeq X Ten System (Illumina, San Diego, USA).
Reading of alignments and transcript assembly
The original sequencing data were subjected to base recognition using the software Bcl2fastq 2.17.1.14 (https://support.illumina.com/content/dam/illuminasupport/documents/documentation/software_documentation/bcl2fastq), yielding “pass filter data”, which were stored in FASTQ file format. Linker and low-quality sequences were deleted from the pass filter data, and the remaining data were compared to the reference genome (GRCH 37) using BWA 0.7.12.
Sequence alignment and gene expression profiling
Data were cleaned using Cutadapt 1.9.1 and short reads were compared using Hisat2 2.0.1 with default parameters, and the results were stored in SAM file format. Data were reformatted into BAM format using Samtools, and featureCount was used to profile the expression of lncRNAs, miRNAs, and messenger RNAs (mRNAs). The three profiles were normalized using the limma package [26] in R 3.5.3.
Differentially expressed genes (DEGs)/miRNAs/lncRNAs and KEGG pathways associated with SR in HCC
Genes whose expression differences between SR- and SS-HCC cell lines were associated with P < 0.05 after adjustment by the false discovery rate (FDR) were considered DEGs. Up- and down-regulated DEGs common to SR-HepG2 and SR-Huh7 lines were subjected to further analyses. Targets of sorafenib in the DrugBank database (https://www.drugbank.ca/) [27] were obtained. We also identified differentially expressed miRNAs and lncRNAs in SR-HepG2 and SR-Huh7 compared to SS-HepG2 and SS-Huh7 cell lines, respectively. Normalized mRNA expression profiles were subjected to gene set enrichment analysis using GSEA software [11] in JAVA. The reference gene set c2.cp.kegg.v6.2. symbols.gmt was taken from the Molecular Signatures Database (MSigDB) [12]. A nominal value of P < 0.05 was considered to be statistically significant.
Exploring upstream regulators of the functional modules and transcription regulatory network associated with SR in HCC
Interactions between lncRNAs or miRNAs and their target genes were obtained from the RNAInter database [32], and interactions between TFs and their target genes were obtained from the TRRUST v2 database [33]. Interactions between regulators and target functional modules were identified using the hypergeometric test in R, and interactions showing a quantity >2 and P < 0.05 were considered significant. All these results were used to construct a transcription regulatory network associated with SR in HCC.
Supplementary Materials
Author Contributions
Zhi Zhang, Steven Mo and Cheng-Zu He performed the experiments, and acquired, analyzed, and interpreted the data; Ya-Qin Qin and Jian-Jun Liao critically revised the manuscript; Shang-Tao Huang drafted the manuscript; Hong-Mian Li and Jian-Yan Lin designed, coordinated, and supervised the study; All authors approved the final version of the article.
Conflicts of Interest
These authors declare no conflicts of interest.
Funding
This research was supported by the Scientific Research and Technology Development Plan of Nanning (20193100, Z20191065).
References
- 1. Som PM, Braun IF, Shapiro MD, Reede DL, Curtin HD, Zimmerman RA. Tumors of the parapharyngeal space and upper neck: MR imaging characteristics. Radiology. 1987; 164:823–29. https://doi.org/10.1148/radiology.164.3.3039571 [PubMed]
- 2. Forner A, Llovet JM, Bruix J. Hepatocellular carcinoma. Lancet. 2012; 379:1245–55. https://doi.org/10.1016/S0140-6736(11)61347-0 [PubMed]
- 3. Raza A, Sood GK. Hepatocellular carcinoma review: current treatment, and evidence-based medicine. World J Gastroenterol. 2014; 20:4115–27. https://doi.org/10.3748/wjg.v20.i15.4115 [PubMed]
- 4. Llovet JM, Ricci S, Mazzaferro V, Hilgard P, Gane E, Blanc JF, de Oliveira AC, Santoro A, Raoul JL, Forner A, Schwartz M, Porta C, Zeuzem S, et al, and SHARP Investigators Study Group. Sorafenib in advanced hepatocellular carcinoma. N Engl J Med. 2008; 359:378–90. https://doi.org/10.1056/NEJMoa0708857 [PubMed]
- 5. Liu L, Cao Y, Chen C, Zhang X, McNabola A, Wilkie D, Wilhelm S, Lynch M, Carter C. Sorafenib blocks the RAF/MEK/ERK pathway, inhibits tumor angiogenesis, and induces tumor cell apoptosis in hepatocellular carcinoma model PLC/PRF/5. Cancer Res. 2006; 66:11851–58. https://doi.org/10.1158/0008-5472.CAN-06-1377 [PubMed]
- 6. Wei L, Lee D, Law CT, Zhang MS, Shen J, Chin DW, Zhang A, Tsang FH, Wong CL, Ng IO, Wong CC, Wong CM. Genome-wide CRISPR/Cas9 library screening identified PHGDH as a critical driver for sorafenib resistance in HCC. Nat Commun. 2019; 10:4681. https://doi.org/10.1038/s41467-019-12606-7 [PubMed]
- 7. Li W, Dong X, He C, Tan G, Li Z, Zhai B, Feng J, Jiang X, Liu C, Jiang H, Sun X. LncRNA SNHG1 contributes to sorafenib resistance by activating the Akt pathway and is positively regulated by miR-21 in hepatocellular carcinoma cells. J Exp Clin Cancer Res. 2019; 38:183. https://doi.org/10.1186/s13046-019-1177-0 [PubMed]
- 8. Zheng JF, He S, Zeng Z, Gu X, Cai L, Qi G. PMPCB silencing sensitizes HCC tumor cells to sorafenib therapy. Mol Ther. 2019; 27:1784–95. https://doi.org/10.1016/j.ymthe.2019.06.014 [PubMed]
- 9. Liu Z, Li J, Chen J, Shan Q, Dai H, Xie H, Zhou L, Xu X, Zheng S. MCM family in HCC: MCM6 indicates adverse tumor features and poor outcomes and promotes S/G2 cell cycle progression. BMC Cancer. 2018; 18:200. https://doi.org/10.1186/s12885-018-4056-8 [PubMed]
- 10. Liu X, Liao W, Yuan Q, Ou Y, Huang J. TTK activates Akt and promotes proliferation and migration of hepatocellular carcinoma cells. Oncotarget. 2015; 6:34309–20. https://doi.org/10.18632/oncotarget.5295 [PubMed]
- 11. Li L, Lei Q, Zhang S, Kong L, Qin B. Screening and identification of key biomarkers in hepatocellular carcinoma: evidence from bioinformatic analysis. Oncol Rep. 2017; 38:2607–18. https://doi.org/10.3892/or.2017.5946 [PubMed]
- 12. Gu Y, Wei X, Sun Y, Gao H, Zheng X, Wong LL, Jin L, Liu N, Hernandez B, Peplowska K, Zhao X, Zhan QM, Feng XH, et al. miR-192-5p silencing by genetic aberrations is a key event in hepatocellular carcinomas with cancer stem cell features. Cancer Res. 2019; 79:941–53. https://doi.org/10.1158/0008-5472.CAN-18-1675 [PubMed]
- 13. Plissonnier ML, Herzog K, Levrero M, Zeisel MB. Non-coding RNAs and hepatitis C virus-induced hepatocellular carcinoma. Viruses. 2018; 10:591. https://doi.org/10.3390/v10110591 [PubMed]
- 14. Kim W, Khan SK, Gvozdenovic-Jeremic J, Kim Y, Dahlman J, Kim H, Park O, Ishitani T, Jho EH, Gao B, Yang Y. Hippo signaling interactions with Wnt/β-catenin and notch signaling repress liver tumorigenesis. J Clin Invest. 2017; 127:137–52. https://doi.org/10.1172/JCI88486 [PubMed]
- 15. Wang M, Kaufman RJ. Protein misfolding in the endoplasmic reticulum as a conduit to human disease. Nature. 2016; 529:326–35. https://doi.org/10.1038/nature17041 [PubMed]
- 16. Ji P, Liang S, Li P, Xie C, Li J, Zhang K, Zheng X, Feng M, Li Q, Jiao H, Chi X, Zhao W, Zhang S, Wang X. Speckle-type POZ protein suppresses hepatocellular carcinoma cell migration and invasion via ubiquitin-dependent proteolysis of SUMO1/sentrin specific peptidase 7. Biochem Biophys Res Commun. 2018; 502:30–42. https://doi.org/10.1016/j.bbrc.2018.05.115 [PubMed]
- 17. Gui Y, Khan MG, Bobbala D, Dubois C, Ramanathan S, Saucier C, Ilangumaran S. Attenuation of MET-mediated migration and invasion in hepatocellular carcinoma cells by SOCS1. World J Gastroenterol. 2017; 23:6639–49. https://doi.org/10.3748/wjg.v23.i36.6639 [PubMed]
- 18. Jiang Y, Gao H, Liu M, Mao Q. Sorting and biological characteristics analysis for side population cells in human primary hepatocellular carcinoma. Am J Cancer Res. 2016; 6:1890–905. [PubMed]
- 19. Pu C, Huang H, Wang Z, Zou W, Lv Y, Zhou Z, Zhang Q, Qiao L, Wu F, Shao S. Extracellular vesicle-associated mir-21 and mir-144 are markedly elevated in serum of patients with hepatocellular carcinoma. Front Physiol. 2018; 9:930. https://doi.org/10.3389/fphys.2018.00930 [PubMed]
- 20. Tan Y, Ge G, Pan T, Wen D, Chen L, Yu X, Zhou X, Gan J. A serum microRNA panel as potential biomarkers for hepatocellular carcinoma related with hepatitis B virus. PLoS One. 2014; 9:e107986. https://doi.org/10.1371/journal.pone.0107986 [PubMed]
- 21. Wang X, Liao X, Huang K, Zeng X, Liu Z, Zhou X, Yu T, Yang C, Yu L, Wang Q, Han C, Zhu G, Ye X, Peng T. Clustered microRNAs hsa-miR-221-3p/hsa-miR-222-3p and their targeted genes might be prognostic predictors for hepatocellular carcinoma. J Cancer. 2019; 10:2520–33. https://doi.org/10.7150/jca.29207 [PubMed]
- 22. Xue H, Tian GY. MiR-429 regulates the metastasis and EMT of HCC cells through targeting RAB23. Arch Biochem Biophys. 2018; 637:48–55. https://doi.org/10.1016/j.abb.2017.11.011 [PubMed]
- 23. Xiong DD, Dang YW, Lin P, Wen DY, He RQ, Luo DZ, Feng ZB, Chen G. A circRNA-miRNA-mRNA network identification for exploring underlying pathogenesis and therapy strategy of hepatocellular carcinoma. J Transl Med. 2018; 16:220. https://doi.org/10.1186/s12967-018-1593-5 [PubMed]
- 24. Zhai B, Hu F, Jiang X, Xu J, Zhao D, Liu B, Pan S, Dong X, Tan G, Wei Z, Qiao H, Jiang H, Sun X. Inhibition of Akt reverses the acquired resistance to sorafenib by switching protective autophagy to autophagic cell death in hepatocellular carcinoma. Mol Cancer Ther. 2014; 13:1589–98. https://doi.org/10.1158/1535-7163.MCT-13-1043 [PubMed]
- 25. Han P, Li H, Jiang X, Zhai B, Tan G, Zhao D, Qiao H, Liu B, Jiang H, Sun X. Dual inhibition of Akt and c-met as a second-line therapy following acquired resistance to sorafenib in hepatocellular carcinoma cells. Mol Oncol. 2017; 11:320–34. https://doi.org/10.1002/1878-0261.12039 [PubMed]
- 26. Ritchie ME, Phipson B, Wu D, Hu Y, Law CW, Shi W, Smyth GK. Limma powers differential expression analyses for RNA-sequencing and microarray studies. Nucleic Acids Res. 2015; 43:e47. https://doi.org/10.1093/nar/gkv007 [PubMed]
- 27. Wishart DS, Feunang YD, Guo AC, Lo EJ, Marcu A, Grant JR, Sajed T, Johnson D, Li C, Sayeeda Z, Assempour N, Iynkkaran I, Liu Y, et al. DrugBank 5.0: a major update to the DrugBank database for 2018. Nucleic Acids Res. 2018; 46:D1074–82. https://doi.org/10.1093/nar/gkx1037 [PubMed]
- 28. Szklarczyk D, Morris JH, Cook H, Kuhn M, Wyder S, Simonovic M, Santos A, Doncheva NT, Roth A, Bork P, Jensen LJ, von Mering C. The STRING database in 2017: quality-controlled protein-protein association networks, made broadly accessible. Nucleic Acids Res. 2017; 45:D362–68. https://doi.org/10.1093/nar/gkw937 [PubMed]
- 29. Nepusz T, Yu H, Paccanaro A. Detecting overlapping protein complexes in protein-protein interaction networks. Nat Methods. 2012; 9:471–72. https://doi.org/10.1038/nmeth.1938 [PubMed]
- 30. Shannon P, Markiel A, Ozier O, Baliga NS, Wang JT, Ramage D, Amin N, Schwikowski B, Ideker T. Cytoscape: a software environment for integrated models of biomolecular interaction networks. Genome Res. 2003; 13:2498–504. https://doi.org/10.1101/gr.1239303 [PubMed]
- 31. Yu G, Wang LG, Han Y, He QY. clusterProfiler: an R package for comparing biological themes among gene clusters. OMICS. 2012; 16:284–87. https://doi.org/10.1089/omi.2011.0118 [PubMed]
- 32. Lin Y, Liu T, Cui T, Wang Z, Zhang Y, Tan P, Huang Y, Yu J, Wang D. RNAInter in 2020: RNA interactome repository with increased coverage and annotation. Nucleic Acids Res. 2020; 48:D189–97. https://doi.org/10.1093/nar/gkz804 [PubMed]
- 33. Han H, Cho JW, Lee S, Yun A, Kim H, Bae D, Yang S, Kim CY, Lee M, Kim E, Lee S, Kang B, Jeong D, et al. TRRUST v2: an expanded reference database of human and mouse transcriptional regulatory interactions. Nucleic Acids Res. 2018; 46:D380–86. https://doi.org/10.1093/nar/gkx1013 [PubMed]