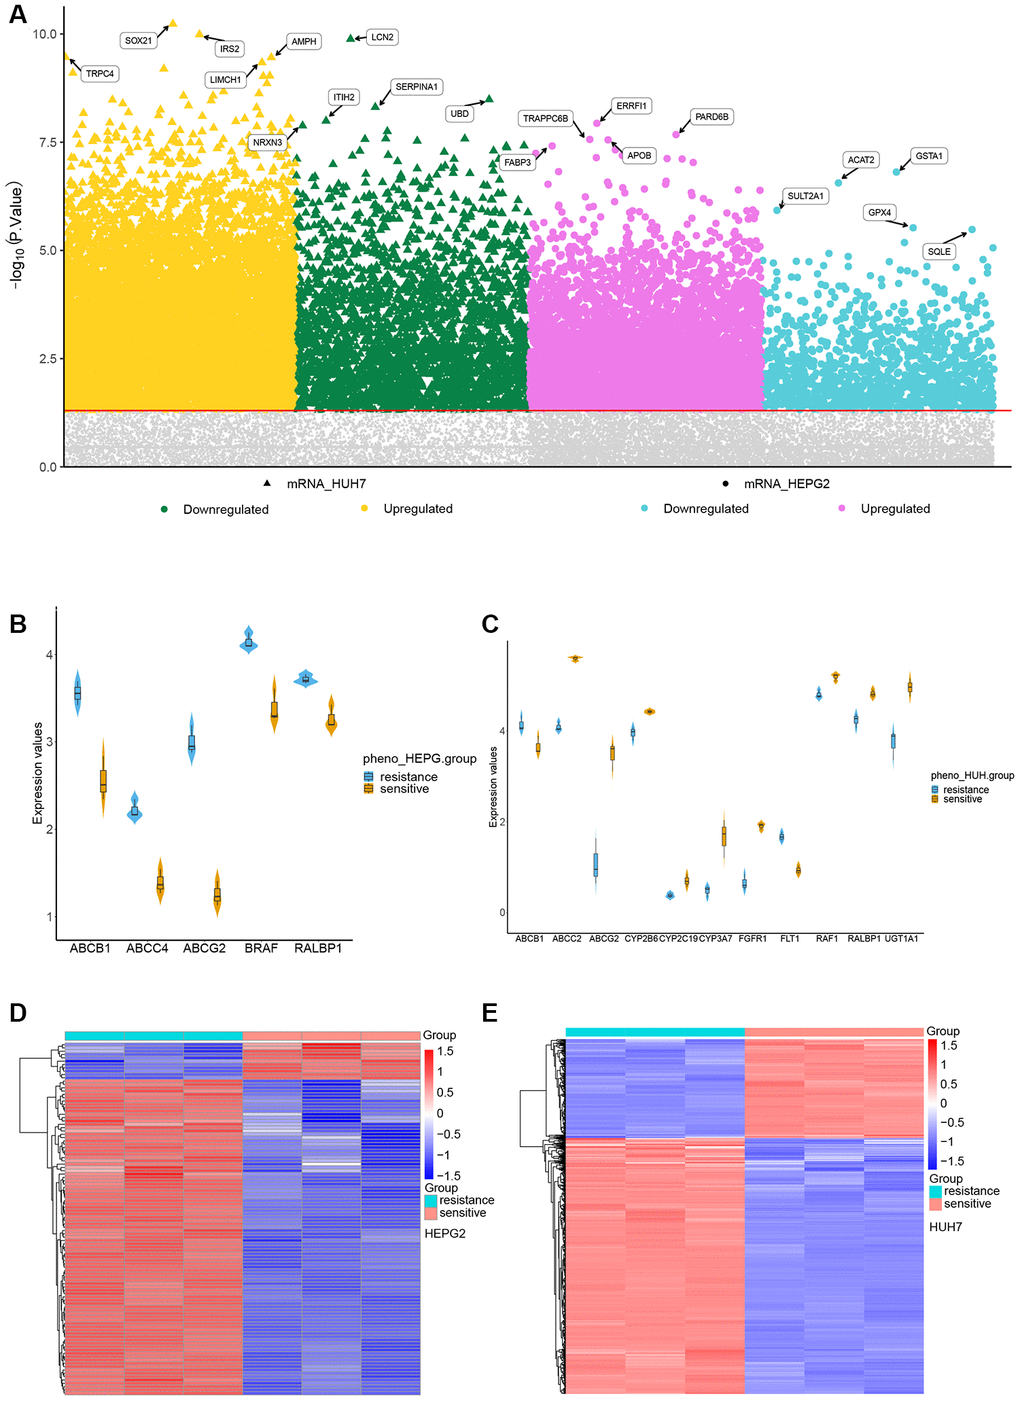
Figure 2.Identification of differentially expressed genes (DEGs) in sorafenib resistance. (A) DEGs in sorafenib resistance. (B) Expression of sorafenib-targeted genes in sorafenib-sensitive and -resistant HepG2 cells. (C) Expression of sorafenib-targeted genes in sorafenib-sensitive and -resistant Huh7 cells. (D) Cluster heatmap of DEGs between sorafenib-sensitive and -resistant HepG2 cells. (E) Cluster heatmap between sorafenib-sensitive and -resistant Huh7 cells.
(F) Genes up-regulated in association with sorafenib resistance in HepG2 and Huh7 cells. (G) Genes down-regulated in association with sorafenib resistance in HepG2 and Huh7 cells. (H) Gene set enrichment analysis of genes up- or down-regulated in association with sorafenib resistance in both HCC cell lines.