


Introduction
Pancreatic cancer (PC) is the eighth leading cause of cancer-related deaths worldwide with a 1-year survival rate of less than 5% [1]. The risk factors associated with pancreatic cancer include smoking, heavy alcohol drinking, diabetes, obesity, chronic pancreatitis, family history, and genetic factors [2]. Genetic mutations in TERT, UGT2B4, XRCC4, XPC, SLC22A3, NR5A2, ABO and XPD genes are associated with susceptibility to pancreatic cancer [3–10]. Single nucleotide polymorphisms (SNPs) in several genes correlate with increased risk of pancreatic cancer [11]. SNPs in protein-coding genes and non-coding RNAs are the most common type of gene mutations implicated in several human disease. Specific SNPs are associated with increased or decreased risk of multiple cancer types because of a genetic phenomenon called linkage disequilibrium (LD) [12]. Variants in insulin-like growth factor, platelet-derived growth factor subunit B, atopy-related immunologic candidate genes, taste-related genes, and inflammatory genes are associated with pancreatic cancer (PC) risk [5, 11, 13–16]. However, the results of many SNP-related studies are often inconclusive because of small sample sizes. Therefore, systematic review of multiple studies is required to analyze the relationship between pancreatic cancer and SNPs [17–20]. There are very few systematic reviews regarding the relationship between SNPs and pancreatic cancer. Therefore, we performed this meta-analysis to identify prominent SNPs associated with greater PC risk. We then selected the most suitable genetic model by comparing data for these PC-related SNPs from network meta-analysis and Thakkinstian algorithm. We then evaluated the reliability of the meta-analysis results using the false positive report probability (FPRP) to determine the most strongly associated SNPs with pancreatic cancer susceptibility.
Results
Description of included studies
This study included 45 studies with 36,360 PC patients and 54,752 non-cancer controls. Supplementary Table 2 shows the data characteristics of the meta-analysis. Initial screening identified 178 genes and 419 SNPs in the included studies, but, only 27 genes and 54 SNPs met the final selection criteria. The genes and SNPs identified in the 45 studies are shown in the Supplementary Table 2. See Table 1 for more details. A total of 45 articles were included [2, 3, 5, 9, 21–60]. The results of the quality evaluation of the included studies are shown in Supplementary Table 1. The evaluation criteria of this study include the following nine aspects: (1) whether to describe genotyping methods; (2) Whether to describe the population stratification method; (3) Whether to describe genotype inference method; (4) Whether the genotype distribution of the control group conforms to HWE; (5) Whether to emphasize the repeatability of research; (6) Whether to describe the inclusion and exclusion criteria and matching methods for the research objects; (7) Whether the statistical method and software version are explained; (8) Correlation judgment method; (9) Whether the data is sufficient
Table 1. Included SNPS and their corresponding literatures.
| Gene | SNP |
| X-ray repair cross-complementing protein 4 (XRCC4) | rs2075685, rs18053775, 24 |
| X-ray repair cross-complementing protein 1 (XRCC1) | rs25487, rs179978225, 26 |
| xeroderma pigmentosum group C (XPC) | rs3731055, rs2228001, rs2228000, rs260777527-29 |
| vascular endothelial growth factor (VEGF) | rs833061, rs201096330, 31 |
| vitamin D receptor (VDR) | rs2228570, rs154441032, 33 |
| Tumor protein p53 (TP53) | rs989582934, 35 |
| fat mass and obesity-associated (FTO) | rs993960936, 37 |
| excision repair cross-complementary group 1 (ERCC1) | rs11615, rs3212986 37,38 |
| excision repair cross complementation group 2 (ERCC2) | rs1318129, 38 |
| excision repair cross complementation group 4 (ERCC4) | rs649848629, 38 |
| cytotoxic T-lymphocyte antigen-4 (CTLA-4) | rs23177539, 40 |
| cyclooxygenase-2 (COX-2) | rs2041741, 42 |
| cyclin dependent kinase inhibitor 2A/B (CDKN2A/B) | rs3731257, rs3731249, rs3731239,rs3731211,rs3218009, rs3217992, rs3217986, rs2811710, rs2811708,rs2518719, rs11515, rs106319243 |
| ABO blood groups (ABO) | rs657152, rs505922, rs49582844-47 |
| Telomerase reverse transcriptase (TERT) | rs2736098, rs401681, rs285367745, 48-50 |
| sterile alpha motif domain containing 12-TNF receptor superfamily member 11 (SAMD12–TNFRSF11B) | rs1198899751 |
| Serine protease 1/2 (PRSS1-PRSS2) | rs1027363951, 52 |
| KIAA1462-mitochondrial poly(A) polymerase (KIAA1462-MTPAP) | rs299527151 |
| MUM1-like 1(MUM1L1-CXorf57) | rs37974251 |
| MORC family CW-type zinc finger 4(MORC4) | rs1283702451 |
| 8-oxoguanine DNA glycosylase 1 (OGG1) | rs105213325, 53 |
| strand of HoxC gene (HOTAIR) | rs475931454, 55 |
| epithelial cadherin (E-cadherin) | rs1626056, 57 |
| Tumor necrosis factor-α (TNF-α) | rs180062958-61 |
| methylenetetrahydrofolate reductase (MTHFR) | rs180113362, 63 |
| Insulin-like growth factor 1 (IGF-1) | rs2288378, rs574271464, 65 |
| hypoxia inducible factor-1alpha (HIF-1α) | rs11549467, rs1154946566, 67 |
Pairwise meta-analysis
Supplementary Table 3 shows the results of the direct meta-analysis to determine the correlation between 54 SNPs and PC risk. We evaluated 6 genetic models for all SNPs to determine the most optimal genetic model that shows correlation with PC risk. The GG and AA genotypes of TP53 rs9895829 showed significant correlation with higher PC risk compared to the GA genotype (GG+AA vs. GA: pooled OR =1.231, 95% CI: 1.143-1.326). The CC and GG genotypes of COX2-765 showed significant correlation with reduced PC risk compared to the CG allele (CC+GG vs. CG: pooled OR = 0.398, 95% CI: 0.273-0.579). According to the fixed effects model, AA and GG genotypes of HIF-1α rs11549467 correlated with increased PC risk compared to the AG genotype (AA+GG vs. AG: pooled OR = 0.343, 95% CI: 0.216-0.545). According to the fixed effects model, the CC genotype of VDR rs2228570 was associated with increased PC risk compared to the TT genotype (CC vs. TT: pooled OR =0.326 95% CI: 0.218-0.488). The homozygous AA genotype of CTLA-4 rs231775 was associated with increased PC risk compared to the GG genotype (AA vs. GG: pooled OR = 1.976, 95% CI: 1.496-2.611). The fixed effects model showed that the TT and TC genotypes of MTHFR rs1801133 showed increased PC risk than the CC genotype (TT+TC vs. CC; pooled OR = 1.905, 95% CI: 1.355-2.677). In addition to this, direct meta-analysis of other meaningful models showed the following in Table 2.
Table 2. Results of direct meta-analysis of SNPS in different gene models.
| Gene | Genetic model | OR 95%CI |
| TP53 rs9895829 | ||
| G vs A | Allele model | 0.815(0.759-0.874) |
| GA vs AA | Heterozygous gene model | 0.811(0.754-0.874) |
| GG+GA vs AA | Dominant gene model | 0.808(0.751-0.870) |
| GG+AA vs GA | Additive gene model | 1.231(1.143-1.326) |
| COX-2 -765 | ||
| C vs G | Allele model | 2.439(1.687-3.524) |
| CG vs GG | Heterozygous gene model | 2.514(1.728-3.657) |
| CC+CG vs GG | Dominant gene model | 2.514(1.728-3.657) |
| CC+GG vs CG | Additive gene model | 0.398(0.273-0.579) |
| HIF-1α rs11549467 | ||
| A vs G | Allele model | 3.075(1.981-4.775) |
| AG vs GG | Heterozygous gene model | 2.946(1.853-4.683) |
| AA+AG vs GG | Dominant gene model | 3.142(1.987-4.970) |
| AA+GG vs AG | Additive gene model | 0.343(0.216-0.545) |
| VDR rs2228570 | ||
| C vs T | Allele model | 0.530(0.433-0.649) |
| CC vs TT | Homozygous gene model | 0.326(0.218-0.488) |
| CC vs CT+TT | Recessive gene model | 0.403(0.297-0.547) |
| CC+CT vs TT | Dominant gene model | 0.571(0.363-0.737) |
| CC+TT vs TC | Additive gene model | 0.667(0.503-0.884) |
| CTLA-4 rs231775 | ||
| A vs G | Allele model | 1.378(1.221-1.555) |
| AA vs GG | Homozygous gene model | 1.976(1.496-2.611) |
| AG vs GG | Heterozygous gene model | 1.391(1.167-1.658) |
| AA vs AG+GG | Recessive gene model | 1.668(1.286-2.164) |
| AA+AG vs GG | Dominant gene model | 1.491(1.262-1.763) |
| AA+GG vs AG | Additive gene model | 0.831(0.706-0.979) |
| MTHFR rs1801133 | ||
| T vs C | Allele model | 1.674(1.337-2.095) |
| TT vs CC | Homozygous gene model | 2.979(1.844-4.812) |
| TC vs CC | Heterozygous gene model | 1.669(1.163-2.395) |
| TT vs TC+CC | Recessive gene model | 2.096(1.397-3.146) |
| TT+TC vs CC | Dominant gene model | 1.905(1.355-2.677) |
Network meta-analysis and Thakkinstian algorithm analysis of the most appropriate genetic models for SNPs associated with PC risk
We performed network meta-analysis with the consistency model to compare the genetic models of different SNPs that show significant correlation with PC risk in order to select the most suitable genetic model for studying PC susceptibility. The results showed that some SNPs were linked to a network, whereas the others were linked only with their genetic models (Figure 1). There are altogether 14 networks, among which 6 networks are formed according to different SNPS, while the other 8 networks are formed within SNPS only with different models as nodes due to insufficient data. After comparing the genetic models with network meta-analysis and paired meta-analysis (Supplementary Tables 1–14, Supplementary Materials 1), we selected 14 SNPs (COX2-765, HIF-1α rs11549467, VDR rs2228570, TP53 rs9895829, CTLA-4 rs231775, MTHFR rs1801133, ABO rs495828, FTO rs9939609, CDKN2A/B rs2518719, XRCC4 rs2075685, XRCC1 rs25487, XPC rs2607775, MORC4 rs12837024, VEGF +405G/C rs2010963, MTHFR rs1801133) and their the most suitable gene model. Based on the rank probabilities, the optimal models for most genes were either additive or dominant (Figure 1). The results of Thakkinstian analysis showed that the co-dominant model was most optimal for these 14 SNPs (Table 2). The prior probability FPRP values for these 14 SNPs are summarized in Table 2.
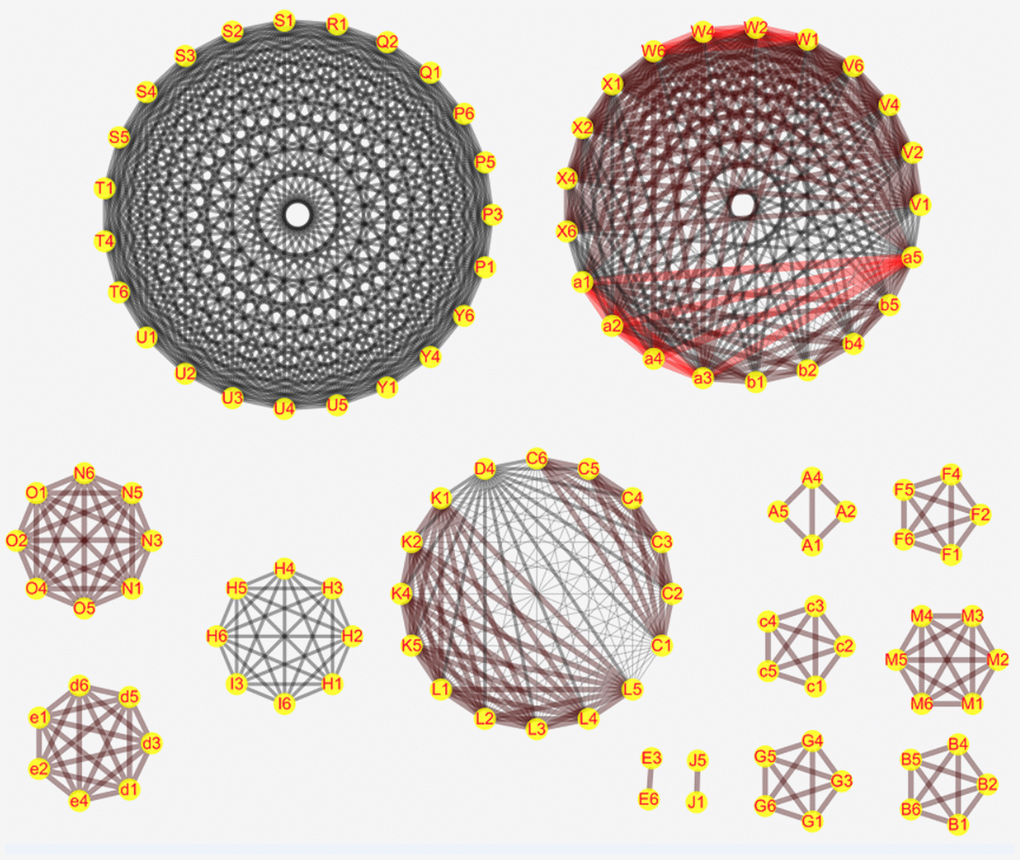
Figure 1. Network meta-analysis results for the genetic models of the PC risk-related SNPs. The figure shows the network meta-analysis results for the (1) Allele (2) Homozygous (3) Heterozygous (4) Dominant (5) Recessive and (6) Additive genetic models of the following SNPs: (C) XPC rs2607775; (D) XPC rs2228001; (K) ERCC2 rs13181; (L) ERCC1 rs3212986; (V) ABO rs657152; (W) ABO rs505922; (X) ABO rs495828; (V) ABO rs657152; (N) COX2-765; (O) COX2-1195; (H) MUM1L1-CXorf57 rs379742; (I) MORC4 rs12837024; (d) HIF-1α G1790A rs11549467; (e) HIF-1α C1772T rs11549465; (P) CDKN2A/B rs3731249; (Q) CDKN2A/B rs3731211; (R) CDKN2A/B rs3218009; (S) CDKN2A/B rs3217992; (T) CDKN2A/B rs2518719; (U) CDKN2A/B rs1063192; (Y) CDKN2A/B rs1063192; (A) XRCC4 rs2075685; (B) XRCC1 rs25487; (F) VDR rs2228570; (G) TP53 rs9895829; (M) CTLA-4 rs231775; (E) VEGF +405 rs2010963; (c) MTHFR rs1801133; (J) FTO rs9939609; (b) TERT rs2853677. D.
Both network meta-analysis and the Thakkinstian's criteria showed different optimal gene models for the 14 SNPs, but the model that showed significant correlation when the FPRP value was less than 0.2 was selected as the most optimal one to determine PC risk (Supplementary Table 3, Tables 2, 3). A SNP consists of a dominant allele (G) and a recessive allele (g). Pairwise differences of GG versus gg (D1), Gg versus gg (D2), and GG versus Gg (D3) were calculated as pooled OR1, OR2, and OR3, respectively, along with 95% CIs, in the pairwise meta-analysis. The most appropriate genetic model was determined to be: recessive model if OR1 = OR3 ≠ 1 and OR2 =1, dominant model if OR1 = OR2 ≠ 1 and OR3 =1, a complete over-dominant model if OR2 = 1/OR3 ≠1 and OR1 = 1, or codominant model if OR1 > OR2 > 1 and OR1 > OR3 > 1 (or if OR1 < OR2 < 1, and OR1 < OR3 < 1). For example, network meta-analysis and Thakkinstian's analysis of the HIF-1α rs11549467 SNP suggested that the additive and co-dominant gene models were most optimal, respectively. However, the FPRP value for the dominant gene model was below 0.2 and for the co-dominant model was above 0.2. Therefore, the additive gene model was considered as the best gene model for HIF-1α rs11549467 to determine PC risk. Similarly, we determined the most optimal genetic models to correlate with PC risk for ABO rs495828, FTO rs9939609, CDKN2A/B rs2518719, XRCC4 rs2075685, XRCC1 rs25487, XPC rs2607775, MORC4 rs12837024, VEGF +405 rs2010963, and MTHFR rs1801133 using the criteria of FPRP value < 0.2 as indicating significant PC risk.
Table 3. Eleven snps’s best suitable gene model.
| Gene | OR 95%CI | Thakkinstian’s algorithm results | the value of FPRP# | Optimal genetic model | |||||||||||||||||||||||||||||||||||||||||||||||||||||||||||||||||||||||||||||||||||||||||||||||
| ABO rs495828 | |||||||||||||||||||||||||||||||||||||||||||||||||||||||||||||||||||||||||||||||||||||||||||||||||||
| GGvsTT* | 0.721(0.523-0.994) | 0.869 | |||||||||||||||||||||||||||||||||||||||||||||||||||||||||||||||||||||||||||||||||||||||||||||||||
| GGvsGT | D3 | 0.738(0.624-0.872) | 0.039 | ||||||||||||||||||||||||||||||||||||||||||||||||||||||||||||||||||||||||||||||||||||||||||||||||
| GTvsTT | D2 | 0.979(0.705-1.359) | codominant model | 0.989 | |||||||||||||||||||||||||||||||||||||||||||||||||||||||||||||||||||||||||||||||||||||||||||||||
| GGvsTT | D1 | 0.721(0.523-0.994) | 0.869 | ||||||||||||||||||||||||||||||||||||||||||||||||||||||||||||||||||||||||||||||||||||||||||||||||
| COX-2 -765 | |||||||||||||||||||||||||||||||||||||||||||||||||||||||||||||||||||||||||||||||||||||||||||||||||||
| CC+GGvsCG* | 2.514(1.728-3.657) | 0.039 | |||||||||||||||||||||||||||||||||||||||||||||||||||||||||||||||||||||||||||||||||||||||||||||||||
| CCvsCG | D3 | ||||||||||||||||||||||||||||||||||||||||||||||||||||||||||||||||||||||||||||||||||||||||||||||||||
| CGvsCC | D2 | codominant model | Additive gene model | ||||||||||||||||||||||||||||||||||||||||||||||||||||||||||||||||||||||||||||||||||||||||||||||||
| CCvsGG | D1 | ||||||||||||||||||||||||||||||||||||||||||||||||||||||||||||||||||||||||||||||||||||||||||||||||||
| FTO rs9939609 | |||||||||||||||||||||||||||||||||||||||||||||||||||||||||||||||||||||||||||||||||||||||||||||||||||
| AA+ATvsTT* | 1.168(1.006-1.357) | 0.808 | |||||||||||||||||||||||||||||||||||||||||||||||||||||||||||||||||||||||||||||||||||||||||||||||||
| AAvsAT | D3 | 1.097(0.868-1.387) | 0.978 | ||||||||||||||||||||||||||||||||||||||||||||||||||||||||||||||||||||||||||||||||||||||||||||||||
| ATvsTT | D2 | 1.151(0.983-1.347) | codominant model | 0.067 | |||||||||||||||||||||||||||||||||||||||||||||||||||||||||||||||||||||||||||||||||||||||||||||||
| AAvsTT | D1 | 1.194(0.939-1.518) | 0.938 | ||||||||||||||||||||||||||||||||||||||||||||||||||||||||||||||||||||||||||||||||||||||||||||||||
| HIF-1α rs11549467 | |||||||||||||||||||||||||||||||||||||||||||||||||||||||||||||||||||||||||||||||||||||||||||||||||||
| AA+GGvsAG* | 0.343(0.216-0.545) | 0.193 | |||||||||||||||||||||||||||||||||||||||||||||||||||||||||||||||||||||||||||||||||||||||||||||||||
| AAvsAG | D3 | 29.4(1.119-772.373) | 0.991 | ||||||||||||||||||||||||||||||||||||||||||||||||||||||||||||||||||||||||||||||||||||||||||||||||
| AGvsGG | D2 | 2.946(1.853-4.683) | codominant model | 0.184 | Additive gene model | ||||||||||||||||||||||||||||||||||||||||||||||||||||||||||||||||||||||||||||||||||||||||||||||
| AAvsGG | D1 | 18.303(0.930-360.191) | 0.991 | ||||||||||||||||||||||||||||||||||||||||||||||||||||||||||||||||||||||||||||||||||||||||||||||||
| CDKN2A/B rs2518719 | |||||||||||||||||||||||||||||||||||||||||||||||||||||||||||||||||||||||||||||||||||||||||||||||||||
| GG+AAvsGA* | 1.124(1.002-1.262) | 0.826 | |||||||||||||||||||||||||||||||||||||||||||||||||||||||||||||||||||||||||||||||||||||||||||||||||
| GGvsGA | D3 | 1.129(1.005-1.267) | 0.795 | ||||||||||||||||||||||||||||||||||||||||||||||||||||||||||||||||||||||||||||||||||||||||||||||||
| GAvsAA | D2 | 1.048(0.729-1.508) | codominant model | 0.988 | |||||||||||||||||||||||||||||||||||||||||||||||||||||||||||||||||||||||||||||||||||||||||||||||
| GGvsAA | D1 | 1.183(0.831-1.685) | 0.975 | ||||||||||||||||||||||||||||||||||||||||||||||||||||||||||||||||||||||||||||||||||||||||||||||||
| XRCC4 rs2075685 | |||||||||||||||||||||||||||||||||||||||||||||||||||||||||||||||||||||||||||||||||||||||||||||||||||
| GG+GTvsTT* | 0.695(0.534-0.904) | 0.515 | |||||||||||||||||||||||||||||||||||||||||||||||||||||||||||||||||||||||||||||||||||||||||||||||||
| GGvsGT | D3 | 0.739(0.565-0.967) | 0.779 | ||||||||||||||||||||||||||||||||||||||||||||||||||||||||||||||||||||||||||||||||||||||||||||||||
| GTvsTT | D2 | 0.781(0.589-1.036) | codominant model | 0.908 | |||||||||||||||||||||||||||||||||||||||||||||||||||||||||||||||||||||||||||||||||||||||||||||||
| GGvsTT | D1 | 0.578(0.423-0.790) | 0.238 | ||||||||||||||||||||||||||||||||||||||||||||||||||||||||||||||||||||||||||||||||||||||||||||||||
| XRCC1 rs25487 | |||||||||||||||||||||||||||||||||||||||||||||||||||||||||||||||||||||||||||||||||||||||||||||||||||
| GG+GAvsAA* | 0.627(0.401-0.980) | 0.911 | |||||||||||||||||||||||||||||||||||||||||||||||||||||||||||||||||||||||||||||||||||||||||||||||||
| GGvsGA | D3 | 0.718(0.558-0.923) | 0.573 | ||||||||||||||||||||||||||||||||||||||||||||||||||||||||||||||||||||||||||||||||||||||||||||||||
| GAvsAA | D2 | 0.767(0.479-1.230) | codominant model | 0.974 | |||||||||||||||||||||||||||||||||||||||||||||||||||||||||||||||||||||||||||||||||||||||||||||||
| GGvsAA | D1 | 0.545(0.345-0.863) | 0.83 | ||||||||||||||||||||||||||||||||||||||||||||||||||||||||||||||||||||||||||||||||||||||||||||||||
| VDR rs2228570 | |||||||||||||||||||||||||||||||||||||||||||||||||||||||||||||||||||||||||||||||||||||||||||||||||||
| CC+CTvsTT* | 0.571(0.363-0.737) | 0.014 | |||||||||||||||||||||||||||||||||||||||||||||||||||||||||||||||||||||||||||||||||||||||||||||||||
| CCvsCT | D3 | 0.442(0.319-0.612) | 0.013 | ||||||||||||||||||||||||||||||||||||||||||||||||||||||||||||||||||||||||||||||||||||||||||||||||
| CTvsTT | D2 | 0.737(0.504-1.076) | codominant model | 0.942 | Recessive gene model | ||||||||||||||||||||||||||||||||||||||||||||||||||||||||||||||||||||||||||||||||||||||||||||||
| CCvsTT | D1 | 0.326(0.218-0.488) | 0.02 | ||||||||||||||||||||||||||||||||||||||||||||||||||||||||||||||||||||||||||||||||||||||||||||||||
| TP53 rs9895829 | |||||||||||||||||||||||||||||||||||||||||||||||||||||||||||||||||||||||||||||||||||||||||||||||||||
| GG+AAvsGA* | 1.231(1.143-1.326) | 0.0001 | |||||||||||||||||||||||||||||||||||||||||||||||||||||||||||||||||||||||||||||||||||||||||||||||||
| GGvsGA | D3 | 0.852(0.539-1.344) | 0.983 | ||||||||||||||||||||||||||||||||||||||||||||||||||||||||||||||||||||||||||||||||||||||||||||||||
| GAvsAA | D2 | 0.811(0.754-0.874) | codominant model | 0.0001 | Additive gene model | ||||||||||||||||||||||||||||||||||||||||||||||||||||||||||||||||||||||||||||||||||||||||||||||
| GGvsAA | D1 | 0.691(0.440-1.086) | 0.951 | ||||||||||||||||||||||||||||||||||||||||||||||||||||||||||||||||||||||||||||||||||||||||||||||||
| CTLA-4 rs231775 | |||||||||||||||||||||||||||||||||||||||||||||||||||||||||||||||||||||||||||||||||||||||||||||||||||
| AA+AGvsGG* | 1.491(1.261-1.763) | 0.001 | |||||||||||||||||||||||||||||||||||||||||||||||||||||||||||||||||||||||||||||||||||||||||||||||||
| AAvsAG | D3 | 1.433(1.093-1.879) | 0.593 | ||||||||||||||||||||||||||||||||||||||||||||||||||||||||||||||||||||||||||||||||||||||||||||||||
| AGvsGG | D2 | 1.391(1.167-1.658) | codominant model | 0.028 | Dominant gene model | ||||||||||||||||||||||||||||||||||||||||||||||||||||||||||||||||||||||||||||||||||||||||||||||
| AAvsGG | D1 | 1.976(1.496-2.611) | 0.006 | ||||||||||||||||||||||||||||||||||||||||||||||||||||||||||||||||||||||||||||||||||||||||||||||||
| MORC4 rs12837024 | |||||||||||||||||||||||||||||||||||||||||||||||||||||||||||||||||||||||||||||||||||||||||||||||||||
| TT+CCvsTC* | 1.176(1.029-1.344) | 0.632 | |||||||||||||||||||||||||||||||||||||||||||||||||||||||||||||||||||||||||||||||||||||||||||||||||
| TTvsTC | D3 | 1.225(1.035-1.449) | 0.641 | ||||||||||||||||||||||||||||||||||||||||||||||||||||||||||||||||||||||||||||||||||||||||||||||||
| TCvsCC | D2 | 0.860(0.751-0.986) | codominant model | 0.752 | |||||||||||||||||||||||||||||||||||||||||||||||||||||||||||||||||||||||||||||||||||||||||||||||
| TTvsCC | D1 | 1.064(0.934-1.212) | 0.972 | ||||||||||||||||||||||||||||||||||||||||||||||||||||||||||||||||||||||||||||||||||||||||||||||||
| VEGF +405 rs2010963 | |||||||||||||||||||||||||||||||||||||||||||||||||||||||||||||||||||||||||||||||||||||||||||||||||||
| GG+CCvsGC* | 2.838(1.765-4.563) | 0.28 | |||||||||||||||||||||||||||||||||||||||||||||||||||||||||||||||||||||||||||||||||||||||||||||||||
| GGvsGC | D3 | 2.033(1.185-3.488) | 0.88 | ||||||||||||||||||||||||||||||||||||||||||||||||||||||||||||||||||||||||||||||||||||||||||||||||
| GCvsCC | D2 | 0.265(0.075-0.937) | codominant model | 0.981 | |||||||||||||||||||||||||||||||||||||||||||||||||||||||||||||||||||||||||||||||||||||||||||||||
| GGvsCC | D1 | 0.495(0.073-3.366) | 0.992 | ||||||||||||||||||||||||||||||||||||||||||||||||||||||||||||||||||||||||||||||||||||||||||||||||
| MTHFR rs1801133 | |||||||||||||||||||||||||||||||||||||||||||||||||||||||||||||||||||||||||||||||||||||||||||||||||||
| TT+TCvsCC* | 1.905(1.355-2.677) | 0.194 | |||||||||||||||||||||||||||||||||||||||||||||||||||||||||||||||||||||||||||||||||||||||||||||||||
| TTvsTC | D3 | 1.218(0.409-3.621) | 0.991 | ||||||||||||||||||||||||||||||||||||||||||||||||||||||||||||||||||||||||||||||||||||||||||||||||
| TCvsCC | D2 | 1.669(1.163-2.395) | codominant model | 0.657 | Dominant gene model | ||||||||||||||||||||||||||||||||||||||||||||||||||||||||||||||||||||||||||||||||||||||||||||||
| TTvsCC | D1 | 2.979(1.844-4.812) | 0.242 | ||||||||||||||||||||||||||||||||||||||||||||||||||||||||||||||||||||||||||||||||||||||||||||||||
| XPC rs2607775 | |||||||||||||||||||||||||||||||||||||||||||||||||||||||||||||||||||||||||||||||||||||||||||||||||||
| GG+CCvsGC* | 0.573(0.403-0.814) | 0.483 | |||||||||||||||||||||||||||||||||||||||||||||||||||||||||||||||||||||||||||||||||||||||||||||||||
| GGvsCG | D3 | 1.952(0.628-6.071) | 0.987 | ||||||||||||||||||||||||||||||||||||||||||||||||||||||||||||||||||||||||||||||||||||||||||||||||
| CGvsCC | D2 | 1.797(1.263-2.555) | codominant model | 0.409 | |||||||||||||||||||||||||||||||||||||||||||||||||||||||||||||||||||||||||||||||||||||||||||||||
| GGvsCC | D1 | 3.523(1.176-10.551) | 0.974 | ||||||||||||||||||||||||||||||||||||||||||||||||||||||||||||||||||||||||||||||||||||||||||||||||
| Note: | |||||||||||||||||||||||||||||||||||||||||||||||||||||||||||||||||||||||||||||||||||||||||||||||||||
| 1. *: This gene model is the most suitable gene model obtained by the network meta-analysis. | |||||||||||||||||||||||||||||||||||||||||||||||||||||||||||||||||||||||||||||||||||||||||||||||||||
| 2. #: FPRP was used to detect the gene models obtained through the network meta-analysis and Thakkinstian’s algorithm respectively. The codominant gene model was replaced by the results of homozygous gene model and heterozygous gene model. | |||||||||||||||||||||||||||||||||||||||||||||||||||||||||||||||||||||||||||||||||||||||||||||||||||
| 3. Optimal genetic model: the final genetic model was obtained after FPRP detection of two possible genetic models. | |||||||||||||||||||||||||||||||||||||||||||||||||||||||||||||||||||||||||||||||||||||||||||||||||||
| 4. D1, D2, D3 were defined by Thakkinstian’s algorithm. D1: Heterozygous gene model; D2: Heterozygous gene model; D3: mutant homozygote vs heterozygote. | |||||||||||||||||||||||||||||||||||||||||||||||||||||||||||||||||||||||||||||||||||||||||||||||||||
The additive gene models for COX2-765, HIF-1α rs11549467, and TP53 rs9895829, the recessive gene model for VDR rs2228570 and TP53 rs9895829, the recessive gene model for VDR rs2228570, as well as dominant gene models for VDR rs2228570, CTLA-4 rs231775 and MTHFR rs1801133 were the most optimal for determining PC susceptibility. Moreover, when the prior probability was 0.00001, the additive gene model for TP53 rs9895829 showed a FPRP value below 0.2, whereas, the remaining showed FPRP values above 0.2. Therefore, we concluded that TP53 rs9895829 was the most optimal gene for predicting PC risk among all candidate genes and SNPs.
Diagnostic meta-analysis
We performed diagnostic meta-analysis of the additive gene model of TP53 rs9895829 to evaluate the efficacy of this SNP to diagnose pancreatic cancer. As shown in Figure 2, the results of the diagnostic meta analysis for the additive gene model of TP53 rs9895829 based on the random effects model were: DOR: 1.42 (95% CI, 1.27–1.59); pooled sensitivity: 0.55 (95% CI, 0.55 - 0.56); pooled specificity: 0.50 (95% CI, 0.48 - 0.52); +LR: 1.10 (95% CI, 1.06 - 1.14), and –LR: 0.90 (95% CI, 0.86 - 0.93).
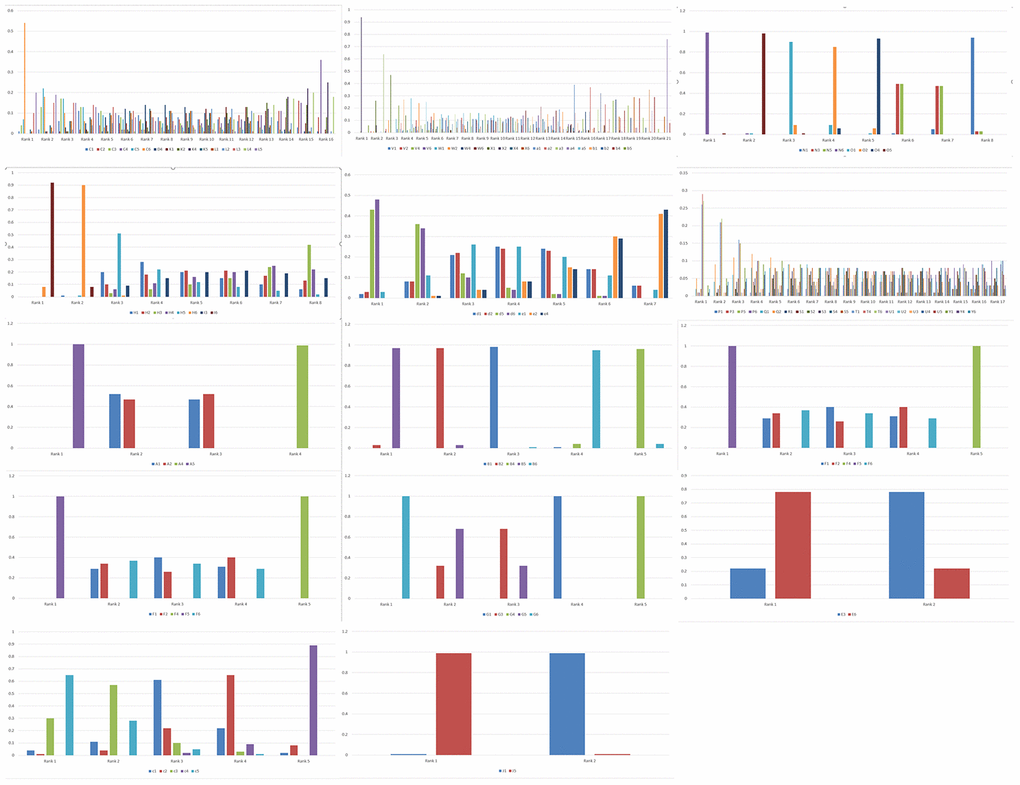
Figure 2. Rank probabilities for the six genetic models of the SNPs related to PC risk. The rank probabilities for the allele (1), homozygous (2), heterozygous (3), dominant (4), recessive (5) and additive (6) genetic models for the following SNPs: (C) XPC rs2607775; (D) XPC rs2228001; (K) ERCC2 rs13181; (L) ERCC1 rs3212986; (V) ABO rs657152; (W) ABO rs505922; (X) ABO rs495828; (V) ABO rs657152; (N) COX2-765; (O) COX2-1195; (H) MUM1L1-CXorf57 rs379742; (I) MORC4 rs12837024; (d) HIF1α-G1790A rs11549467; (e) HIF1α-C1772T rs11549465; (P) CDKN2A/B rs3731249; (Q) CDKN2A/B rs3731211; (R) CDKN2A/B rs3218009; (S) CDKN2A/B rs3217992; (T) CDKN2A/B rs2518719; (U) CDKN2A/B rs1063192; (Y) CDKN2A/B rs1063192; (A) XRCC4 rs2075685; (B) XRCC1 rs25487; (F) VDR rs2228570; (G) TP53 rs9895829; (M) CTLA-4 rs231775; (E) VEGF +405 rs2010963; (c) MTHFR rs1801133; (J) FTO rs9939609; (b) TERT rs2853677. Note: Genetic model of an SNP with best mean probability is considered the optimal genetic model.
Discussion
Several studies have investigated genetic susceptibility in PC, but the relationship between PC and SNPs is not conclusive. In this meta-analysis, we combined the results of several published studies to evaluate the association between PC and SNPs. We performed network meta-analysis, which is similar to pairwise meta-analysis, but is validated based on the quality of evidenceThe ranking probability was obtained by combining direct and indirect evidences with a Bayesian approach. A previous study successfully applied this approach to select the best genetic model for detecting the risk of hepatocellular carcinoma [61].
In our study, TP53 rs9895829 showed stronger association with PC risk compared with COX2-765, HIF-1α rs11549467, VDR rs2228570, TP53 rs9895829, CTLA-4 rs231775, and MTHFR rs1801133. However, we were unable to conduct further subgroup analysis on TP53 rs9895829 to explore its specific association with PC because of smaller sample size.
In this study, we aimed to identify the most optimal genetic models among the six genetic models for the 30 SNPs that associate with PC risk by using network meta-analysis and Thakkinstian algorithm. Network meta-analysis is an extension to pairwise meta-analysis and, similar to pairwise meta-analysis, its validity is based on quality of evidence. The ranking probability was obtained from a combination of direct and indirect evidence with a Bayesian approach. dIn our study, COX2-765, HIF-1α rs11549467, VDR rs2228570, TP53 rs9895829, CTLA-4 rs231775, MTHFR rs1801133, ABO rs49582, FTO rs9939609, CDKN2A/B rs2518719, XRCC4 rs2075685, XRCC1 rs25487, XPC rs2607775, MORC4 rs12837024, VEGF +405 rs2010963, and MTHFR rs1801133 were associated with greater risk of pancreatic cancer. The co-dominance model was the best genetic model to predict PC risk based on Thakkinstian's algorithm, but this model was not used in the pairwise meta-analysis (Table 2). We analyzed the correlation between PC and the genetic model based on the available data and did not consider any extrinsic factors that may affect the results in the study.
We then used FPRP values to determine the most plausible genetic model for the genes listed in Table 1. The three determinants of FPRP are prior probability, observed P value or α level, and statistical power, Wacholder et al. suggested that large studies or pooled analyses should use a stringent FPRP value below 0.2, prior probability as high (≈0.1), moderate (≈0.01), or low (≈0.001), and statistical power of 1.5 for alleles with higher cancer risk to obtain meaningful results [61, 62]. We chose moderate prior probability of 0.01 for FPRP and analyzed the 14 genes associated with pancreatic cancer. Our analysis showed that TP53 rs9895829 was the best susceptibility gene for PC because it demonstrated a FPRP value of less than 0.2 even when the prior probability was 0.00001. The remaining 13 candidates showed FPRP values above 0.2 when prior probability value of 0.00001 was used.
Pancreatic cancer (PC) is a highly malignant cancer and is caused by a variety of factors of unknown etiology. The death rate of PC ranks eighth among all cancers worldwide and fourth among developed countries, with more than 260,000 deaths reported each year [63]. Most patients survive for less than a year after diagnosis and only 5% of PC patients survive for more than 5 years [64, 65]. The incidence of pancreatic cancer varies with population structure and the lifestyle of individuals [66, 67]. Identification of risk genes is critical in for decreasing the high mortality rates in PC. Our meta-analysis demonstrates the most relevant model for PC risk by collating the results of already published case-control studies related to PC. However, further high-quality studies with larger sample sizes and detailed PC risk factor data are necessary in the future to conclusively prove our findings.
Van et al. showed that vitamin D deficiency is very common in patients diagnosed with advanced pancreatic cancer [68]. Several studies have shown that 1, 25(OH)2Vitamin D regulates cellular proliferation, differentiation, apoptosis, and angiogenesis [64]. Colston et al. demonstrated that 1, 25(OH)2VitD and its synthetic analogues inhibited the proliferation of PC cell lines [69]. Vitamin D receptor (VDR) is expressed in the stroma of pancreatic tumors and mediates interstitial reprogramming to inhibit pancreatitis and pancreatic cancer [70]. VDR gene polymorphisms are associated with colon, breast, kidney, and prostate cancers [71–75]. Moreover, VDR gene polymorphisms affect immune response in immune-related diseases such as Graves' disease [76] and SLE [77]. The VDR rs2228570 T/C allele is 10 base pairs upstream of the translation initiation codon with the rs2228570 C allele variant generating shorter protein with higher activity than the rs2228570 T variant [78, 79]. Alimirah F et al. demonstrated that the T allele of rs2228570 increases breast tumor aggressiveness by up-regulating the expression of epidermal growth factor receptor (EGFR) [30, 80]. Li et al. showed that VDR rs2228570 gene polymorphism is associated with PC risk in the Northern China population [30]. VDR rs2228570 polymorphism also significantly correlates with pathological differentiation and TNM stages, and is a potential prognostic biomarker for PC [81].
The cytotoxic T-lymphocyte-associated protein 4 (CTLA-4) gene is located on chromosome 2q33 and encodes a crucial immune checkpoint protein on the T-lymphocytes; it consists of four exons that encode the leader sequence, the extracellular domain, the transmembrane domain, and the cytoplasmic domain [82]. Injection of anti-CTLA-4 antibody promotes anti-tumor immunity by enhancing the activation of T cells, thereby demonstrating its importance in tumorigenesis [83, 84]. The +49G>A allele in CTLA-4 rs231775 changes of the amino acid from alanine17 to threonine17 and is associated with the high expression of CTLA-4, which inhibits T cell activation and proliferation [82, 85, 86]. In the Chinese population, the CTLA-4 + 49a allele is associated with increased risk of lung, breast and cervical cancers [83, 85, 86]. Another meta-analysis showed that the CTLA-4 +49A allele is associated with increased risk of pancreatic cancer in Caucasians and Chinese populations compared to the +49G allele [87]. In general, CTLA-4 is highly expressed in human pancreatic cancer cells [88]. The phase 2 trial of the anti-CTLA4 antibody, Ipilimumab, showed delayed progression in some advanced stage pancreatic cancer patients [89].
P53 protein encoded by the TP53 gene plays a significant role in DNA damage, hypoxia, and metabolic stress, and inhibits tumorigenesis by regulating cell cycle and apoptosis [90]. Somatic mutations in the TP53 gene have been reported in nearly 50% of human cancers, including pancreatic cancer [91, 92]. Morton et al. demonstrated that TP53 mutations promote PC metastasis [93]. TP53 gene mutations have been reported in 60% of sporadic pancreatic cancer cases and 33% of familial pancreatic cancer cases [94]. Biankin et al. demonstrated that TP53 mutations are associated with susceptibility to pancreatic cancer [95]. Feng et al. showed that TP53 rs9895829 SNP was related to increased expression and activation of p53 in 373 lymphoblast cell lines [31].
Overall, our data suggests that several SNPs are potential candidates to diagnose PC because they are related to greater PC risk. However, because of smaller sample sizes and lack of sufficient information about extrinsic factors, we could not conduct sub-group analysis and optimal diagnostic meta-analysis of relevant indicators. Therefore, a single SNP may not be a sufficient indicator of PC risk, but, we postulate that analyzing multiple genes and SNPs may be a relevant diagnostic index for determining PC risk.
There are several limitations s in our study. Firstly, we lacked sufficient data to perform subgroup analysis and calculate heterogeneity. Secondly, we did not consider the potential impact of many extrinsic factors because these data were not available in the included studies. Thirdly, some of the included studies were of poor quality, which limited our ability to validate the combined results and perform subgroup analysis. Fourthly, it is plausible that because of our inclusion criteria, we excluded studies with relevant information about the SNPs. Hence, further analysis with large sample sizes and quality data is necessary to confirm our findings.
Nevertheless, this is the first systematic review and meta-analysis to our knowledge to comprehensively assess several SNPs associated with PC through network meta-analysis and Thakkinstian algorithm. We also measured the reliability of the meta-analysis results by FPRP to identify SNPs strongly associated with pancreatic cancer susceptibility. Our data suggests that some of the SNPs may be used in the future either alone or in combination for early screening of pancreatic cancer.
In conclusion, our data suggests that additive gene models of COX-2 -765, HIF-1α rs11549467, and TP53 rs9895829, as well as dominant gene models of DR rs2228570, CTLA-4 rs231775 and MTHFR rs1801133 are associated with PC risk. The additive genetic model for TP53 rs9895829 is the most optimal to diagnose PC risk. Future studies with large samples, detailed data on PC risk factors, and high-quality research are required to further validate the role of these PC risk-related SNPs.
Materials and Methods
This systematic review and meta-analysis was conducted in accordance with the guidelines and protocols of the systematic review and meta-analysis preferred reporting project (PRISMA) and registered in the INPLASY database (INPLASY202040023).
Criteria for included studies
We included case-control studies on SNPs related to PC risk for this meta-analysis. We excluded repetitive reports, conference reports, review reports, news articles, animal studies, studies without sufficient data to calculate genotype distribution, and studies regarding SNPs that deviate from Hardy-Weinberg equilibrium (HWE). In these included studies, the experimental group included serum samples from PC patients that had not received any chemotherapy, whereas, the control group included healthy individuals, patients with non-malignant diseases, and non-cancer patients of different ages, gender, country, and tumor stage.
Study search, selection and data extraction
We used terms such as single nucleotide polymorphism, SNP, pancreatic cancer and pancreatic tumor to search PubMed, Web of Science, Embase, Cochrane Library, China National Knowledge Infrastructure (CNKI), Science and Technology Periodical Database (VIP), and Wanfang databases for studies published until January 2020 without any language restrictions. The search criteria for the Pubmed database are shown in Supplementary Information 1.
Data selection was performed independently by two reviewers (ZY and LL). In the case of disagreements, a third independent reviewer (JZ) was involved to reach consensus. The strategy used for study selection is shown in Figure 3. We extracted data including author names, year of publication, country, sample size of men and women, Hardy Weinberg equilibrium values, genotyping methods and genotype frequencies. The data was methodically evaluated by two independent reviewers (ZY and LL) according to the guidelines of the STREGA statement [23]. The third reviewer (JZ) was involved in resolving any issues between the two reviewers. The corresponding authors were contacted if any data was missing, insufficient, or vague. However, if relevant data was not obtained, those studies were excluded.
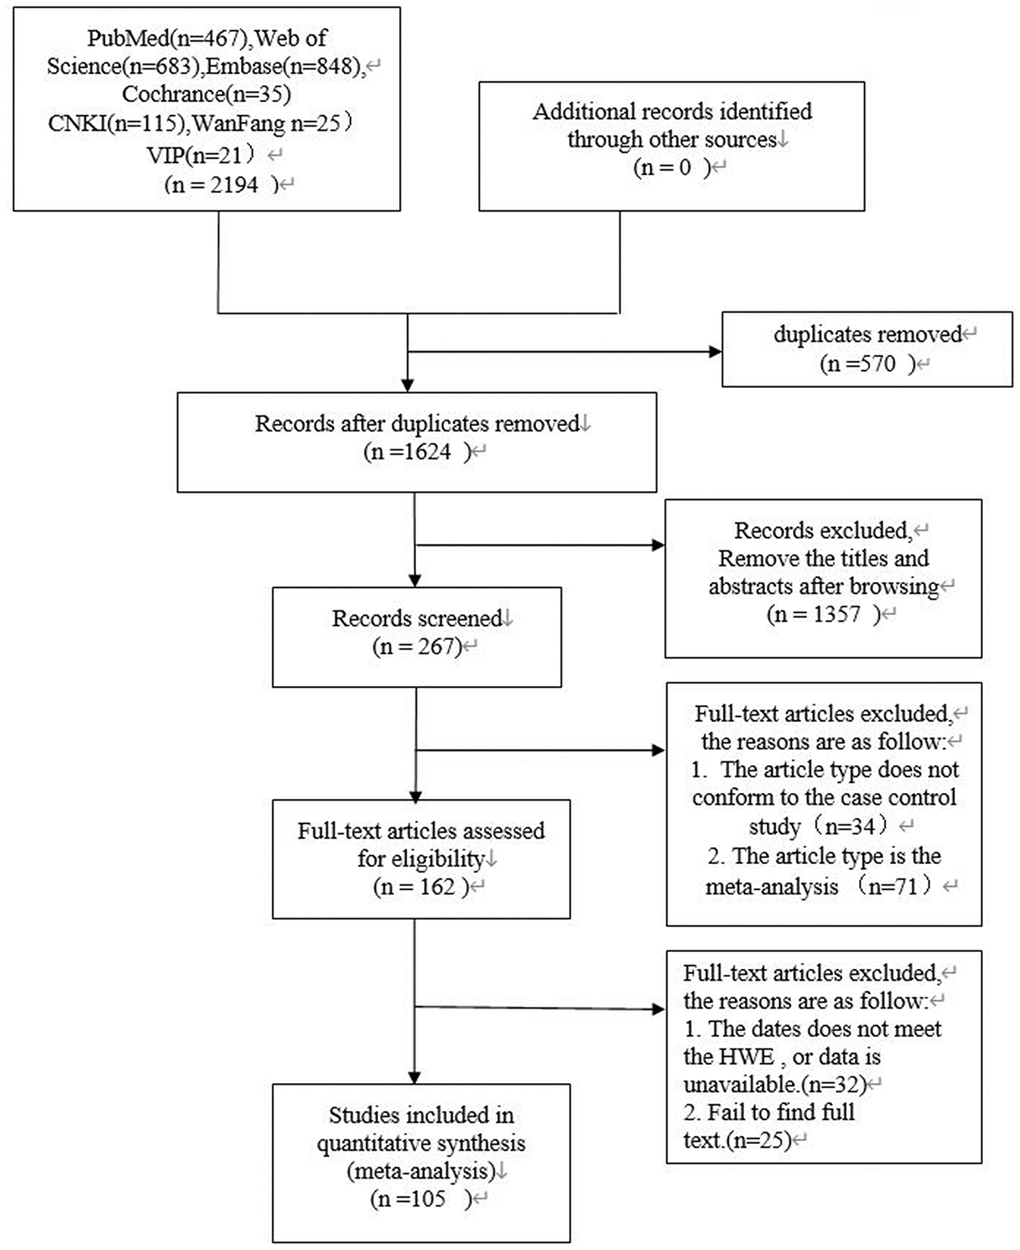
Figure 3. PRISMA flow diagram of study search and selection.
Statistical analysis
The statistical data was analyzed using the StataMP14.0 software (https://www.stata.com/). The fixed effects or random effects pooled odds ratio (OR) were calculated using 95% confidence intervals (CIs) for pairwise meta-analysis based on the heterogeneity of the genetic models. We then conducted a network meta-analysis to determine the most suitable genetic model for each SNP.
The heterogeneity between studies was analyzed using I2 statistic and P value. Fixed effects model was used for studies with low heterogeneity as indicated by I2 value less than 50% and P value greater than 0.1. Otherwise, random effects model was used for studies with high heterogeneity. When sufficient data was available for SNPs with heterogeneity, we performed subgroup analysis to identify the source of heterogeneity and generate an optimal genetic model that can be used to predict PC susceptibility.
Network meta-analysis
We used the ADDIS software (1.14) based on the Bayesian framework and Markov Chain Monte Carlo (MCMC) theory to generate mesh relationship diagram between genes related to PC risk. The four parallel Markov Chain Monte Carlo (MCMC) simulations underwent a burn-in phase of 20,000 stimulations and then an additional phase of 50,000 stimulations. The outcomes were evaluated by OR and 95% CI under random –effects model and consistency model was applied if 95% CI of log (OR) included 0. Otherwise, inconsistency model was used. The potential scale reduction factor (PSRF) was used to determine convergence. The model was considered convergent if the value of PSRF was closer to 1.0. This Bayesian method was used to rank each genetic model regarding the probability of PC risk and the corresponding rank probability map was automatically generated.
Diagnostic meta-analysis
We performed diagnostic meta-analysis using the Meta-DiSc software [22] and evaluated sensitivity, specificity, likelihood ratios (LRs), diagnostic odds ratios (DORs), and summary receiver operating characteristic curves (SROC) of the SNPs to predict PC risk.
False positive report probability (FPRP)
In the mesh meta-analysis, we used the Thakkinstian's algorithm [23] to evaluate the best genetic model for each SNP. A SNP consists of a dominant allele (G) and a recessive allele (g). Pairwise differences of GG vs. gg (D1), Gg vs. gg (D2), and GG vs. Gg (D3) were calculated as pooled OR1, OR2, and OR3, respectively, along with the corresponding 95% CIs. The most appropriate genetic model was determined to be recessive if OR1 = OR3 ≠ 1 and OR2 =1, dominant model if OR1 = OR2 ≠ 1 and OR3 =1, a complete over-dominant model if OR2 = 1/OR3 ≠1 and OR1 = 1, or codominant model if OR1 > OR2 > 1 and OR1 > OR3 > 1 (or if OR1 < OR2 < 1, and OR1 < OR3 < 1). We the FPRP by assuming a three-layer prior probability (low: 0.1; moderate: 0.01; high: 0.001) and an OR value of 1.5. The most suitable genetic model for each SNP related to PC risk was determined by comparing the results from network meta-analysis and the Thakkinstian algorithm [24].
Supplementary Materials
Author Contributions
Analysis planning: Jing-hui Zheng, Yun-xin Lu; Conceptualization: Jing-hui Zheng, Yun-xin Lu; Data curation: Zhuo-miao Ye, Li-juan Li; manuscript draft: Zhuo-miao Ye, Li-juan Li; Investigation: Jing-hui Zheng; Manuscript editing: Zhuo-miao Ye, Jing-hui Zheng; Methodology: Zhuo-miao Ye, Jing-hui Zheng, Yun-xin Lu.
Acknowledgments
This work was supported by the Science Research and Technology Development Project of Guangxi Zhuang Autonomous Region (Grant No. 1598013-5; Project recipient: Tang Youming).
Conflicts of Interest
The authors declare that they have no conflicts of interest.
References
- 1. Zhu B, Zhu Y, Tian J, Shen N, Li J, Lou J, Ke J, Yang Y, Gong Y, Gong J, Chang J, Miao X, Zhong R. A functional variant rs1537373 in 9p21.3 region is associated with pancreatic cancer risk. Mol Carcinog. 2019; 58:760–66. https://doi.org/10.1002/mc.22968 [PubMed]
- 2. Campa D, Pastore M, Gentiluomo M, Talar-Wojnarowska R, Kupcinskas J, Malecka-Panas E, Neoptolemos JP, Niesen W, Vodicka P, Delle Fave G, Bueno-de-Mesquita HB, Gazouli M, Pacetti P, et al. Functional single nucleotide polymorphisms within the cyclin-dependent kinase inhibitor 2A/2B region affect pancreatic cancer risk. Oncotarget. 2016; 7:57011–20. https://doi.org/10.18632/oncotarget.10935 [PubMed]
- 3. Campa D, Rizzato C, Stolzenberg-Solomon R, Pacetti P, Vodicka P, Cleary SP, Capurso G, Bueno-de-Mesquita HB, Werner J, Gazouli M, Butterbach K, Ivanauskas A, Giese N, et al. TERT gene harbors multiple variants associated with pancreatic cancer susceptibility. Int J Cancer. 2015; 137:2175–83. https://doi.org/10.1002/ijc.29590 [PubMed]
- 4. Che X, Yu D, Wu Z, Zhang J, Chen Y, Han Y, Wang C, Qi J. Polymorphisms in UGT2B4 and susceptibility to pancreatic cancer. Int J Clin Exp Med. 2015; 8:2702–10. [PubMed]
- 5. Ding Y, Li LN. Association between single nucleotide polymorphisms of X-ray repair cross-complementing protein 4 gene and development of pancreatic cancer. Genet Mol Res. 2015; 14:9626–32. https://doi.org/10.4238/2015.August.14.25 [PubMed]
- 6. Duell EJ, Bracci PM, Moore JH, Burk RD, Kelsey KT, Holly EA. Detecting pathway-based gene-gene and gene-environment interactions in pancreatic cancer. Cancer Epidemiol Biomarkers Prev. 2008; 17:1470–79. https://doi.org/10.1158/1055-9965.EPI-07-2797 [PubMed]
- 7. Mohelnikova-Duchonova B, Strouhal O, Hughes DJ, Holcatova I, Oliverius M, Kala Z, Campa D, Rizzato C, Canzian F, Pezzilli R, Talar-Wojnarowska R, Malecka-Panas E, Sperti C, et al. SLC22A3 polymorphisms do not modify pancreatic cancer risk, but may influence overall patient survival. Sci Rep. 2017; 7:43812. https://doi.org/10.1038/srep43812 [PubMed]
- 8. Ueno M, Ohkawa S, Morimoto M, Ishii H, Matsuyama M, Kuruma S, Egawa N, Nakao H, Mori M, Matsuo K, Hosono S, Nojima M, Wakai K, et al. Genome-wide association study-identified SNPs (rs3790844, rs3790843) in the NR5A2 gene and risk of pancreatic cancer in Japanese. Sci Rep. 2015; 5:17018. https://doi.org/10.1038/srep17018 [PubMed]
- 9. Xu HL, Cheng JR, Zhang W, Wang J, Yu H, Ni QX, Risch HA, Gao YT. Re-evaluation of ABO gene polymorphisms detected in a genome-wide association study and risk of pancreatic ductal adenocarcinoma in a Chinese population. Chin J Cancer. 2014; 33:68–73. https://doi.org/10.5732/cjc.013.10060 [PubMed]
- 10. Yan D, Liang XH, Ding W, Xu XJ, Wang XY. Contribution of DNA repair xeroderma pigmentosum group D genotypes to pancreatic cancer risk in the Chinese Han population. Genet Mol Biol. 2018; 41:18–26. https://doi.org/10.1590/1678-4685-gmb-2017-0033 [PubMed]
- 11. Xu GP, Chen WX, Zhao Q, Zhou H, Chen SZ, Wu LF. Association between the insulin-like growth factor 1 gene rs2195239 and rs2162679 polymorphisms and cancer risk: a meta-analysis. BMC Med Genet. 2019; 20:17. https://doi.org/10.1186/s12881-019-0749-3 [PubMed]
- 12. Allione A, Guarrera S, Russo A, Ricceri F, Purohit R, Pagnani A, Rosa F, Polidoro S, Voglino F, Matullo G. Inter-individual variation in nucleotide excision repair pathway is modulated by non-synonymous polymorphisms in ERCC4 and MBD4 genes. Mutat Res. 2013; 751-752:49–54. https://doi.org/10.1016/j.mrfmmm.2013.08.005 [PubMed]
- 13. Duan B, Hu J, Liu H, Wang Y, Li H, Liu S, Xie J, Owzar K, Abbruzzese J, Hurwitz H, Gao H, Wei Q. Genetic variants in the platelet-derived growth factor subunit B gene associated with pancreatic cancer risk. Int J Cancer. 2018; 142:1322–31. https://doi.org/10.1002/ijc.31171 [PubMed]
- 14. Cotterchio M, Lowcock E, Bider-Canfield Z, Lemire M, Greenwood C, Gallinger S, Hudson T. Association between Variants in Atopy-Related Immunologic Candidate Genes and Pancreatic Cancer Risk. PLoS One. 2015; 10:e0125273. https://doi.org/10.1371/journal.pone.0125273 [PubMed]
- 15. Gentiluomo M, Lu Y, Canzian F, Campa D. Genetic variants in taste-related genes and risk of pancreatic cancer. Mutagenesis. 2019; 34:391–94. https://doi.org/10.1093/mutage/gez032 [PubMed]
- 16. Nowak-Niezgoda M, Fic M, Kozikowski M, Durlik M. Are septic complications associated with single gene polymorphisms of inflammation-related genes among patients with neoplastic tumors of pancreas? Pancreatology. 2014; 14:S85. https://doi.org/10.1016/j.pan.2014.05.668
- 17. Antwi SO, Bamlet WR, Pedersen KS, Chaffee KG, Risch HA, Shivappa N, Steck SE, Anderson KE, Bracci PM, Polesel J, Serraino D, La Vecchia C, Bosetti C, et al. Pancreatic cancer risk is modulated by inflammatory potential of diet and ABO genotype: a consortia-based evaluation and replication study. Carcinogenesis. 2018; 39:1056–67. https://doi.org/10.1093/carcin/bgy072 [PubMed]
- 18. Arem H, Yu K, Xiong X, Moy K, Freedman ND, Mayne ST, Albanes D, Arslan AA, Austin M, Bamlet WR, Beane-Freeman L, Bracci P, Canzian F, et al. Vitamin D metabolic pathway genes and pancreatic cancer risk. PLoS One. 2015; 10:e0117574. https://doi.org/10.1371/journal.pone.0117574 [PubMed]
- 19. Cai Q, Wu J, Cai Q, Chen EZ, Jiang ZY. Association between Glu504Lys polymorphism of ALDH2 gene and cancer risk: a meta-analysis. PLoS One. 2015; 10:e0117173. https://doi.org/10.1371/journal.pone.0117173 [PubMed]
- 20. Childs EJ, Chaffee KG, Gallinger S, Syngal S, Schwartz AG, Cote ML, Bondy ML, Hruban RH, Chanock SJ, Hoover RN, Fuchs CS, Rider DN, Amundadottir LT, et al. Association of Common Susceptibility Variants of Pancreatic Cancer in Higher-Risk Patients: A PACGENE Study. Cancer Epidemiol Biomarkers Prev. 2016; 25:1185–91. https://doi.org/10.1158/1055-9965.EPI-15-1217 [PubMed]
- 21. Nakao M, Hosono S, Ito H, Watanabe M, Mizuno N, Sato S, Yatabe Y, Yamao K, Ueda R, Tajima K, Tanaka H, Matsuo K. Selected polymorphisms of base excision repair genes and pancreatic cancer risk in Japanese. J Epidemiol. 2012; 22:477–83. https://doi.org/10.2188/jea.JE20120010 [PubMed]
- 22. Shen Q, Tian Y, Li K, Jiang Q, Xue H, Yang S. Association of single nucleotide polymorphisms of DNA repair gene and susceptibility to pancreatic cancer. Int J Clin Exp Pathol. 2015; 8:3180–85. [PubMed]
- 23. Yan D, Wang X, Li H, Xu X, Zhu G, He T. The relationship between susceptibility to pancreatic cancer and gene polymorphism of X - ray injury - repair cross - complementary gene and smoking. Chin J Exp Surg. 2012; 29:2300–03. https://doi.org/10.3760/cma.j.issn.1001-9030.2012.11.071
- 24. Liang XH, Yan D, Zhao JX, Ding W, Xu XJ, Wang XY. Interaction of polymorphisms in xeroderma pigmentosum group C with cigarette smoking and pancreatic cancer risk. Oncol Lett. 2018; 16:5631–38. https://doi.org/10.3892/ol.2018.9350 [PubMed]
- 25. He T. Analysis of association between single nucleotide polymorphism of pigmented dermatitis gene C and smoking and susceptibility to pancreatic cancer. Zhonghua Xiaohua Waike Zazhi. 2013; 12.
- 26. Zhao F, Shang Y, Zeng C, Gao D, Li K. Association of single nucleotide polymorphisms of DNA repair genes in NER pathway and susceptibility to pancreatic cancer. Int J Clin Exp Pathol. 2015; 8:11579–86. [PubMed]
- 27. Talar-Wojnarowska R, Gasiorowska A, Olakowski M, Lekstan A, Lampe P, Smolarz B, Romanowicz-Makowska H, Kulig A, Malecka-Panas E. Vascular endothelial growth factor (VEGF) genotype and serum concentration in patients with pancreatic adenocarcinoma and chronic pancreatitis. J Physiol Pharmacol. 2010; 61:711–16. [PubMed]
- 28. Sivaprasad S, Govardhan B, Harithakrishna R, Venkat Rao G, Pradeep R, Kunal B, Ramakrishna N, Anuradha S, Reddy DN. Association of vascular endothelial growth factor (VEGF) gene polymorphism and increased serum VEGF concentration with pancreatic adenocarcinoma. Pancreatology. 2013; 13:267–72. https://doi.org/10.1016/j.pan.2013.02.006 [PubMed]
- 29. Yin JY, Meng XG, Qian CY, Li XP, Chen J, Zheng Y, Liu R, Zhou HH, Liu ZQ. Association of positively selected eIF3a polymorphisms with toxicity of platinum-based chemotherapy in NSCLC patients. Acta Pharmacol Sin. 2015; 36:375–84. https://doi.org/10.1038/aps.2014.160 [PubMed]
- 30. Li L, Wu B, Yang L, Yin G, Wei W, Sui S, Liu J. Association of vitamin D receptor gene polymorphisms with pancreatic cancer: A pilot study in a North China Population. Oncol Lett. 2013; 5:1731–35. https://doi.org/10.3892/ol.2013.1215 [PubMed]
- 31. Feng Y, Liu H, Duan B, Liu Z, Abbruzzese J, Walsh KM, Zhang X, Wei Q. Potential functional variants in SMC2 and TP53 in the AURORA pathway genes and risk of pancreatic cancer. Carcinogenesis. 2019; 40:521–28. https://doi.org/10.1093/carcin/bgz029 [PubMed]
- 32. Xu X, Qian D, Liu H, Cruz D, Luo S, Walsh KM, Abbruzzese JL, Zhang X, Wei Q. Genetic variants in the liver kinase B1-AMP-activated protein kinase pathway genes and pancreatic cancer risk. Mol Carcinog. 2019; 58:1338–48. https://doi.org/10.1002/mc.23018 [PubMed]
- 33. Lin Y, Ueda J, Yagyu K, Ishii H, Ueno M, Egawa N, Nakao H, Mori M, Matsuo K, Kikuchi S. Association between variations in the fat mass and obesity-associated gene and pancreatic cancer risk: a case-control study in Japan. BMC Cancer. 2013; 13:337. https://doi.org/10.1186/1471-2407-13-337 [PubMed]
- 34. Tang H, Dong X, Hassan M, Abbruzzese JL, Li D. Body mass index and obesity- and diabetes-associated genotypes and risk for pancreatic cancer. Cancer Epidemiol Biomarkers Prev. 2011; 20:779–92. https://doi.org/10.1158/1055-9965.EPI-10-0845 [PubMed]
- 35. Ying MF, Zhao R. Role of single nucleotide polymorphisms of DNA repair genes in susceptibility to pancreatic cancer in Chinese population. Genet Mol Res. 2016; 15. https://doi.org/10.4238/gmr.15017273 [PubMed]
- 36. Yang M, Sun T, Zhou Y, Wang L, Liu L, Zhang X, Tang X, Zhou M, Kuang P, Tan W, Li H, Yuan Q, Yu D. The functional cytotoxic T lymphocyte-associated Protein 4 49G-to-A genetic variant and risk of pancreatic cancer. Cancer. 2012; 118:4681–86. https://doi.org/10.1002/cncr.27455 [PubMed]
- 37. Lang C, Chen L, Li S. Cytotoxic T-lymphocyte antigen-4 +49G/A polymorphism and susceptibility to pancreatic cancer. DNA Cell Biol. 2012; 31:683–87. https://doi.org/10.1089/dna.2011.1417 [PubMed]
- 38. Zhao D, Xu D, Zhang X, Wang L, Tan W, Guo Y, Yu D, Li H, Zhao P, Lin D. Interaction of cyclooxygenase-2 variants and smoking in pancreatic cancer: a possible role of nucleophosmin. Gastroenterology. 2009; 136:1659–68. https://doi.org/10.1053/j.gastro.2009.01.071 [PubMed]
- 39. Xu D, Zhang X, Zhao P, Cai J, Zhao D, Tan W, Guo Y, Lin D. Relationship between mononucleotide polymorphism in cox-2 promoter region and genetic susceptibility to pancreatic cancer. Zhonghua Yi Xue Za Zhi. 2008; 88:1961–65. https://doi.org/10.3321/j.issn:0376-2491.2008.28.005 [PubMed]
- 40. Rizzato C, Campa D, Giese N, Werner J, Rachakonda PS, Kumar R, Schanné M, Greenhalf W, Costello E, Khaw KT, Key TJ, Siddiq A, Lorenzo-Bermejo J, et al. Pancreatic cancer susceptibility loci and their role in survival. PLoS One. 2011; 6:e27921. https://doi.org/10.1371/journal.pone.0027921 [PubMed]
- 41. Obazee O, Capurso G, Tavano F, Archibugi L, De Bonis A, Greenhalf W, Key T, Pasquali C, Milanetto AC, Hackert T, Fogar P, Liço V, Dervenis C, et al. Common genetic variants associated with pancreatic adenocarcinoma may also modify risk of pancreatic neuroendocrine neoplasms. Carcinogenesis. 2018; 39:360–67. https://doi.org/10.1093/carcin/bgx150 [PubMed]
- 42. Rizzato C, Campa D, Pezzilli R, Soucek P, Greenhalf W, Capurso G, Talar-Wojnarowska R, Heller A, Jamroziak K, Khaw KT, Key TJ, Bambi F, Landi S, et al. ABO blood groups and pancreatic cancer risk and survival: results from the PANcreatic Disease ReseArch (PANDoRA) consortium. Oncol Rep. 2013; 29:1637–44. https://doi.org/10.3892/or.2013.2285 [PubMed]
- 43. Liu C, Wang Y, Huang H, Wang C, Zhang H, Kong Y, Zhang H. Association between CLPTM1L-TERT rs401681 polymorphism and pancreatic cancer risk among Chinese Han population. Tumour Biol. 2014; 35:5453–57. https://doi.org/10.1007/s13277-014-1711-9 [PubMed]
- 44. Campa D, Pastore M, Capurso G, Hackert T, Di Leo M, Izbicki JR, Khaw KT, Gioffreda D, Kupcinskas J, Pasquali C, Macinga P, Kaaks R, Stigliano S, et al. Do pancreatic cancer and chronic pancreatitis share the same genetic risk factors? A PANcreatic Disease ReseArch (PANDoRA) consortium investigation. Int J Cancer. 2018; 142:290–96. https://doi.org/10.1002/ijc.31047 [PubMed]
- 45. Liu Q, Lin X, Liu J, Liu A, Gao F. The -409 C/T genotype of PRSS1 protects against pancreatic cancer in the Han Chinese population. Dig Dis Sci. 2012; 57:573–79. https://doi.org/10.1007/s10620-011-1893-6 [PubMed]
- 46. Li D, Suzuki H, Liu B, Morris J, Liu J, Okazaki T, Li Y, Chang P, Abbruzzese JL. DNA repair gene polymorphisms and risk of pancreatic cancer. Clinical cancer research. 2009; 15:740–746. https://doi.org/10.1158/1078-0432.CCR-08-1607
- 47. Moschovis D, Vasilaki E, Tzouvala M, Karamanolis G, Katifelis H, Legaki E, Vezakis A, Aravantinos G, Gazouli M. Association between genetic polymorphisms in long non-coding RNAs and pancreatic cancer risk. Cancer Biomark. 2019; 24:117–23. https://doi.org/10.3233/CBM-181959 [PubMed]
- 48. Hu P, Qiao O, Wang J, Li J, Jin H, Li Z, Jin Y. rs1859168 A > C polymorphism regulates HOTTIP expression and reduces risk of pancreatic cancer in a Chinese population. World J Surg Oncol. 2017; 15:155. https://doi.org/10.1186/s12957-017-1218-0 [PubMed]
- 49. Fei Y, Hu J, Liu S, Liu X, Wang F, Gong J. E-cadherin-160 C/A promoter polymorphism and risk of pancreatic carcinoma in Chinese population. Cancer Genet Cytogenet. 2010; 197:25–31. https://doi.org/10.1016/j.cancergencyto.2009.10.016 [PubMed]
- 50. Zhao L, Wang YX, Xi M, Liu SL, Zhang P, Luo LL, Liu MZ. Association between E-cadherin (CDH1) polymorphisms and pancreatic cancer risk in Han Chinese population. Int J Clin Exp Pathol. 2015; 8:5753–60. [PubMed]
- 51. Wu GY, Lu Q, Hasenberg T, Niedergethmann M, Post S, Sturm JW, Keese M. Association between EGF, TGF-{beta}1, TNF-{alpha} gene polymorphisms and cancer of the pancreatic head. Anticancer Res. 2010; 30:5257–61. [PubMed]
- 52. Talar-Wojnarowska R, Gasiorowska A, Smolarz B, Romanowicz-Makowska H, Kulig A, Malecka-Panas E. Tumor necrosis factor alpha and interferon gamma genes polymorphisms and serum levels in pancreatic adenocarcinoma. Neoplasma. 2009; 56:56–62. https://doi.org/10.4149/neo_2009_01_56 [PubMed]
- 53. Karakaxas D, Gazouli M, Coker A, Agalianos C, Papanikolaou IS, Patapis P, Liakakos T, Dervenis C. Genetic polymorphisms of inflammatory response gene TNF-α and its influence on sporadic pancreatic neuroendocrine tumors predisposition risk. Med Oncol. 2014; 31:241. https://doi.org/10.1007/s12032-014-0241-z [PubMed]
- 54. Campa D, Obazee O, Pastore M, Panzuto F, Liço V, Greenhalf W, Katzke V, Tavano F, Costello E, Corbo V, Talar-Wojnarowska R, Strobel O, Zambon CF, et al. Lack of Association for Reported Endocrine Pancreatic Cancer Risk Loci in the PANDoRA Consortium. Cancer Epidemiol Biomarkers Prev. 2017; 26:1349–51. https://doi.org/10.1158/1055-9965.EPI-17-0075 [PubMed]
- 55. Wang L, Miao X, Tan W, Lu X, Zhao P, Zhao X, Shan Y, Li H, Lin D. Genetic polymorphisms in methylenetetrahydrofolate reductase and thymidylate synthase and risk of pancreatic cancer. Clin Gastroenterol Hepatol. 2005; 3:743–51. https://doi.org/10.1016/S1542-3565(05)00156-4 [PubMed]
- 56. Nisevic I, Dinic J, Nikolic A, Djordjevic V, Lukic S, Ugljesic M, Andjelic-Jelic M, Petrovic-Stanojevic N, Radojkovic D. MTHFR C677T polymorphism in chronic pancreatitis and pancreatic adenocarcinoma. Cell Biochem Funct. 2008; 26:659–63. https://doi.org/10.1002/cbf.1487 [PubMed]
- 57. Nakao M, Hosono S, Ito H, Watanabe M, Mizuno N, Yatabe Y, Yamao K, Ueda R, Tajima K, Tanaka H, Matsuo K. Interaction between IGF-1 polymorphisms and overweight for the risk of pancreatic cancer in Japanese. Int J Mol Epidemiol Genet. 2011; 2:354–66. [PubMed]
- 58. Suzuki H, Li Y, Dong X, Hassan MM, Abbruzzese JL, Li D. Effect of insulin-like growth factor gene polymorphisms alone or in interaction with diabetes on the risk of pancreatic cancer. Cancer Epidemiol Biomarkers Prev. 2008; 17:3467–73. https://doi.org/10.1158/1055-9965.EPI-08-0514 [PubMed]
- 59. Ruiz-Tovar J, Fernandez-Contreras ME, Martín-Perez E, Gamallo C. Association of thymidylate synthase and hypoxia inducible factor-1alpha DNA polymorphisms with pancreatic cancer. Tumori. 2012; 98:364–69. https://doi.org/10.1177/030089161209800314 [PubMed]
- 60. Wang X, Liu Y, Ren H, Yuan Z, Li S, Sheng J, Zhao T, Chen Y, Liu F, Wang F, Huang H, Hao J. Polymorphisms in the hypoxia-inducible factor-1α gene confer susceptibility to pancreatic cancer. Cancer Biol Ther. 2011; 12:383–87. https://doi.org/10.4161/cbt.12.5.15982 [PubMed]
- 61. Zhang C, Ye Z, Zhang Z, Zheng J, Tang Y, Hou E, Huang Z, Meng L. A comprehensive evaluation of single nucleotide polymorphisms associated with hepatocellular carcinoma risk in Asian populations: A systematic review and network meta-analysis. Gene. 2020; 735:144365. https://doi.org/10.1016/j.gene.2020.144365 [PubMed]
- 62. Wacholder S, Chanock S, Garcia-Closas M, El Ghormli L, Rothman N. Assessing the probability that a positive report is false: an approach for molecular epidemiology studies. J Natl Cancer Inst. 2004; 96:434–42. https://doi.org/10.1093/jnci/djh075 [PubMed]
- 63. Wolfgang CL, Herman JM, Laheru DA, Klein AP, Erdek MA, Fishman EK, Hruban RH. Recent progress in pancreatic cancer. CA Cancer J Clin. 2013; 63:318–48. https://doi.org/10.3322/caac.21190 [PubMed]
- 64. Greer JB, Brand RE. New developments in pancreatic cancer. Curr Gastroenterol Rep. 2011; 13:131–39. https://doi.org/10.1007/s11894-011-0175-y [PubMed]
- 65. Yadav D, Lowenfels AB. The epidemiology of pancreatitis and pancreatic cancer. Gastroenterology. 2013; 144:1252–61. https://doi.org/10.1053/j.gastro.2013.01.068 [PubMed]
- 66. Smith BD, Smith GL, Hurria A, Hortobagyi GN, Buchholz TA. Future of cancer incidence in the United States: burdens upon an aging, changing nation. J Clin Oncol. 2009; 27:2758–65. https://doi.org/10.1200/JCO.2008.20.8983 [PubMed]
- 67. Grant WB. A multicountry ecological study of cancer incidence rates in 2008 with respect to various risk-modifying factors. Nutrients. 2013; 6:163–89. https://doi.org/10.3390/nu6010163 [PubMed]
- 68. Van Loon K, Owzar K, Jiang C, Kindler HL, Mulcahy MF, Niedzwiecki D, O’Reilly EM, Fuchs C, Innocenti F, Venook AP, and Alliance for Clinical Trials in Oncology. 25-Hydroxyvitamin D levels and survival in advanced pancreatic cancer: findings from CALGB 80303 (Alliance). J Natl Cancer Inst. 2014; 106:dju185. https://doi.org/10.1093/jnci/dju185 [PubMed]
- 69. Colston KW, James SY, Ofori-Kuragu EA, Binderup L, Grant AG. Vitamin D receptors and anti-proliferative effects of vitamin D derivatives in human pancreatic carcinoma cells in vivo and in vitro. Br J Cancer. 1997; 76:1017–20. https://doi.org/10.1038/bjc.1997.501 [PubMed]
- 70. Sherman MH, Yu RT, Engle DD, Ding N, Atkins AR, Tiriac H, Collisson EA, Connor F, Van Dyke T, Kozlov S, Martin P, Tseng TW, Dawson DW, et al. Vitamin D receptor-mediated stromal reprogramming suppresses pancreatitis and enhances pancreatic cancer therapy. Cell. 2014; 159:80–93. https://doi.org/10.1016/j.cell.2014.08.007 [PubMed]
- 71. Giovannucci E, Liu Y, Rimm EB, Hollis BW, Fuchs CS, Stampfer MJ, Willett WC. Prospective study of predictors of vitamin D status and cancer incidence and mortality in men. J Natl Cancer Inst. 2006; 98:451–59. https://doi.org/10.1093/jnci/djj101 [PubMed]
- 72. Mahmoudi T, Mohebbi SR, Pourhoseingholi MA, Fatemi SR, Zali MR. Vitamin D receptor gene ApaI polymorphism is associated with susceptibility to colorectal cancer. Dig Dis Sci. 2010; 55:2008–13. https://doi.org/10.1007/s10620-009-0989-8 [PubMed]
- 73. Kizildag S, Gulsu E, Bagci O, Yuksel E, Canda T. Vitamin D receptor gene polymorphisms and male breast cancer risk in Turkish population. Journal of BUON. 2011; 16:640–45.
- 74. Arjumand W, Ahmad ST, Seth A, Saini AK, Sultana S. Vitamin D receptor FokI and BsmI gene polymorphism and its association with grade and stage of renal cell carcinoma in North Indian population. Tumour Biol. 2012; 33:23–31. https://doi.org/10.1007/s13277-011-0236-8 [PubMed]
- 75. Shui IM, Mucci LA, Kraft P, Tamimi RM, Lindstrom S, Penney KL, Nimptsch K, Hollis BW, Dupre N, Platz EA, Stampfer MJ, Giovannucci E. Vitamin D-related genetic variation, plasma vitamin D, and risk of lethal prostate cancer: a prospective nested case-control study. J Natl Cancer Inst. 2012; 104:690–99. https://doi.org/10.1093/jnci/djs189 [PubMed]
- 76. Zhou H, Xu C, Gu M. Vitamin D receptor (VDR) gene polymorphisms and Graves’ disease: a meta-analysis. Clin Endocrinol (Oxf). 2009; 70:938–45. https://doi.org/10.1111/j.1365-2265.2008.03413.x [PubMed]
- 77. Kurucu N, Şahin G, Sarı N, Ceylaner S, İlhan İE. Association of vitamin D receptor gene polymorphisms with osteosarcoma risk and prognosis. J Bone Oncol. 2018; 14:100208. https://doi.org/10.1016/j.jbo.2018.100208 [PubMed]
- 78. Ogunkolade BW, Boucher BJ, Prahl JM, Bustin SA, Burrin JM, Noonan K, North BV, Mannan N, McDermott MF, DeLuca HF, Hitman GA. Vitamin D receptor (VDR) mRNA and VDR protein levels in relation to vitamin D status, insulin secretory capacity, and VDR genotype in Bangladeshi Asians. Diabetes. 2002; 51:2294–300. https://doi.org/10.2337/diabetes.51.7.2294 [PubMed]
- 79. Jurutka PW, Whitfield GK, Hsieh JC, Thompson PD, Haussler CA, Haussler MR. Molecular nature of the vitamin D receptor and its role in regulation of gene expression. Rev Endocr Metab Disord. 2001; 2:203–16. https://doi.org/10.1023/A:1010062929140 [PubMed]
- 80. Speer G. [The role of vitamin D in the prevention and the additional therapy of cancers]. Magy Onkol. 2010; 54:303–14. https://doi.org/10.1556/MOnkol.54.2010.4.4 [PubMed]
- 81. Li L, Shang F, Zhang W, Zhang C, Li J, Wang C, Wei L. Role of vitamin D receptor gene polymorphisms in pancreatic cancer: a case-control study in China. Tumour Biol. 2015; 36:4707–14. https://doi.org/10.1007/s13277-015-3119-6 [PubMed]
- 82. Ligers A, Teleshova N, Masterman T, Huang WX, Hillert J. CTLA-4 gene expression is influenced by promoter and exon 1 polymorphisms. Genes Immun. 2001; 2:145–52. https://doi.org/10.1038/sj.gene.6363752 [PubMed]
- 83. Vandenborre K, Van Gool SW, Kasran A, Ceuppens JL, Boogaerts MA, Vandenberghe P. Interaction of CTLA-4 (CD152) with CD80 or CD86 inhibits human T-cell activation. Immunology. 1999; 98:413–21. https://doi.org/10.1046/j.1365-2567.1999.00888.x [PubMed]
- 84. Leach DR, Krummel MF, Allison JP. Enhancement of antitumor immunity by CTLA-4 blockade. Science. 1996; 271:1734–36. https://doi.org/10.1126/science.271.5256.1734 [PubMed]
- 85. Sun T, Zhou Y, Yang M, Hu Z, Tan W, Han X, Shi Y, Yao J, Guo Y, Yu D, Tian T, Zhou X, Shen H, Lin D. Functional genetic variations in cytotoxic T-lymphocyte antigen 4 and susceptibility to multiple types of cancer. Cancer Res. 2008; 68:7025–34. https://doi.org/10.1158/0008-5472.CAN-08-0806 [PubMed]
- 86. Zhang Y, Zhang J, Deng Y, Tian C, Li X, Huang J, Fan H. Polymorphisms in the cytotoxic T-lymphocyte antigen 4 gene and cancer risk: a meta-analysis. Cancer. 2011; 117:4312–24. https://doi.org/10.1002/cncr.25979 [PubMed]
- 87. Sun T, Hu Z, Shen H, Lin D. Genetic polymorphisms in cytotoxic T-lymphocyte antigen 4 and cancer: the dialectical nature of subtle human immune dysregulation. Cancer Res. 2009; 69:6011–14. https://doi.org/10.1158/0008-5472.CAN-09-0176 [PubMed]
- 88. Loos M, Giese NA, Kleeff J, Giese T, Gaida MM, Bergmann F, Laschinger M, W Büchler M, Friess H. Clinical significance and regulation of the costimulatory molecule B7-H1 in pancreatic cancer. Cancer Lett. 2008; 268:98–109. https://doi.org/10.1016/j.canlet.2008.03.056 [PubMed]
- 89. Royal RE, Levy C, Turner K, Mathur A, Hughes M, Kammula US, Sherry RM, Topalian SL, Yang JC, Lowy I, Rosenberg SA. Phase 2 trial of single agent Ipilimumab (anti-CTLA-4) for locally advanced or metastatic pancreatic adenocarcinoma. J Immunother. 2010; 33:828–33. https://doi.org/10.1097/CJI.0b013e3181eec14c [PubMed]
- 90. Barton CM, Staddon SL, Hughes CM, Hall PA, O’Sullivan C, Klöppel G, Theis B, Russell RC, Neoptolemos J, Williamson RC. Abnormalities of the p53 tumour suppressor gene in human pancreatic cancer. Br J Cancer. 1991; 64:1076–82. https://doi.org/10.1038/bjc.1991.467 [PubMed]
- 91. Guo G, Marrero L, Rodriguez P, Del Valle L, Ochoa A, Cui Y. Trp53 inactivation in the tumor microenvironment promotes tumor progression by expanding the immunosuppressive lymphoid-like stromal network. Cancer Res. 2013; 73:1668–75. https://doi.org/10.1158/0008-5472.CAN-12-3810 [PubMed]
- 92. Mohamadkhani A, Naderi E, Sharafkhah M, Fazli HR, Moradzadeh M, Pourshams A. Detection of TP53 R249 Mutation in Iranian Patients with Pancreatic Cancer. J Oncol. 2013; 2013:738915. https://doi.org/10.1155/2013/738915 [PubMed]
- 93. Morton JP, Timpson P, Karim SA, Ridgway RA, Athineos D, Doyle B, Jamieson NB, Oien KA, Lowy AM, Brunton VG, Frame MC, Evans TR, Sansom OJ. Mutant p53 drives metastasis and overcomes growth arrest/senescence in pancreatic cancer. Proc Natl Acad Sci USA. 2010; 107:246–51. https://doi.org/10.1073/pnas.0908428107 [PubMed]
- 94. Sakorafas GH, Smyrniotis V. Molecular biology of pancreatic cancer: how useful is it in clinical practice? JOP. 2012; 13:332–37. https://doi.org/10.6092/1590-8577/841 [PubMed]
- 95. Biankin AV, Waddell N, Kassahn KS, Gingras MC, Muthuswamy LB, Johns AL, Miller DK, Wilson PJ, Patch AM, Wu J, Chang DK, Cowley MJ, Gardiner BB, et al, and Australian Pancreatic Cancer Genome Initiative. Pancreatic cancer genomes reveal aberrations in axon guidance pathway genes. Nature. 2012; 491:399–405. https://doi.org/10.1038/nature11547 [PubMed]