


Introduction
Asthma is clinically embodied as repetitive wheeze, dyspnea, chest stress and cough at early morning or in the night, and its global incidence is expected to reach 400 million by 2025 [1]. Even if glucocorticoid-based treatments were efficacious in relieving inflammation of asthma [2], their effects on patients with airflow limitation were not so desirable, which led to skyrocketing mortality [3]. It was widely acknowledged that airway smooth muscle cell (ASMC) and CD4+ T cell played crucial roles in airway inflammation and airway remodeling, which exacerbated airflow limitation [4–7]. Specifically, excessive proliferation of ASMCs engendered airway remodeling [8], and promoted airway inflammation by stimulating production of interleukins (e.g. IL-6), chemokines and cell adhesion factors [9]. Biased differentiation of CD4+ T cells into Th1-like and Th2-like cells was also responsible for abnormal inflammation in asthma [10]. Taken together, asthma treatment might be improved by restraining ASMC over-proliferation and by preventing Th1/Th2 imbalance.
LncRNAs, a group of ncRNAs with length of > 200 nucleotides, demonstrated huge potential in urging or blocking asthma progression by acting upon miRNAs that mattered in asthmatic inflammation or airway remodeling [11]. For example, knockout of miR-155 was reported to mitigate airway inflammation and airway hyper-responsiveness in ovalbumin (OVA)-sensitized mice [12], so it was probable that lncRNA MALAT1 elevated asthma risk by sponging miR-155 and inhibiting its expression [13]. Of note, expression of lncRNA PVT1 was dramatically lowered in ASMCs that were exposed to anti-asthmatic drugs [14], providing a hint that PVT1 might be associated with ASMC dysfunction underlying asthma etiology. Suppressing PVT1 expression also engendered a marked decrease of IL-6 level, which was reflective of abated inflammation in asthma [15]. Despite hidden linkages between PVT1 and airway remodeling/inflammation, it remained ambiguous whether PVT1 indeed disrupted normal activity of ASMC and CD4+ T cell by sponging protective miRNAs in asthma.
In addition, exposure to high-concentration ozone, an alarming phenomenon around the globe (Supplementary Tables 1 and 2), also made human beings vulnerable to asthma [16–18]. In particular, ozone not only facilitated airway smooth muscle contraction by impairing lung function and strengthening airway reactivity [19], but also encouraged abnormal inflammation of T cells through driving neutrophil multiplication [20, 21]. Notably, numerous signaling pathways relevant to immunity were altered under the influence of ozone [22], spanning from NF-κB signaling [23] to miRNA (e.g. miR-149) networks [24]. Nonetheless, few investigations were conducted to figure out if lncRNA-miRNA axes were involved in asthma development triggered by ozone.
Hence, this investigation was carried out to elucidate the association of lncRNA PVT1-led miRNA axes with ozone-induced asthma, which was conducive to clinical prevention and treatment of asthma.
Results
Effect of ozone on airway smooth muscle function of asthma mice models
Bronchial wall and smooth muscle became thicker in OVA+ozone group than in saline+ozone group and OVA+air group (P<0.05) (Figure 1A, 1B). OVA (i.e. OVA+air group) and ozone (i.e. saline+ozone group) treatments also increased airway resistance and decreased lung compliance of mice models, as compared with saline+air group (P<0.05) (Figure 1C, 1D). Furthermore, ozone and OVA seemed interdependent in affecting LogPC100 Penh, and OVA+ozone group demonstrated lower LogPC100 Penh than saline+air group and OVA+air group (P<0.05) (Figure 1E). Hyaluronan (HA) (Figure 1F), TNF-α (Figure 1G) and IL-13 (Figure 1H) levels also reached a peak in ozone+OVA group, and they were higher in saline+ozone group and OVA+air group than in saline+air group (P<0.05).
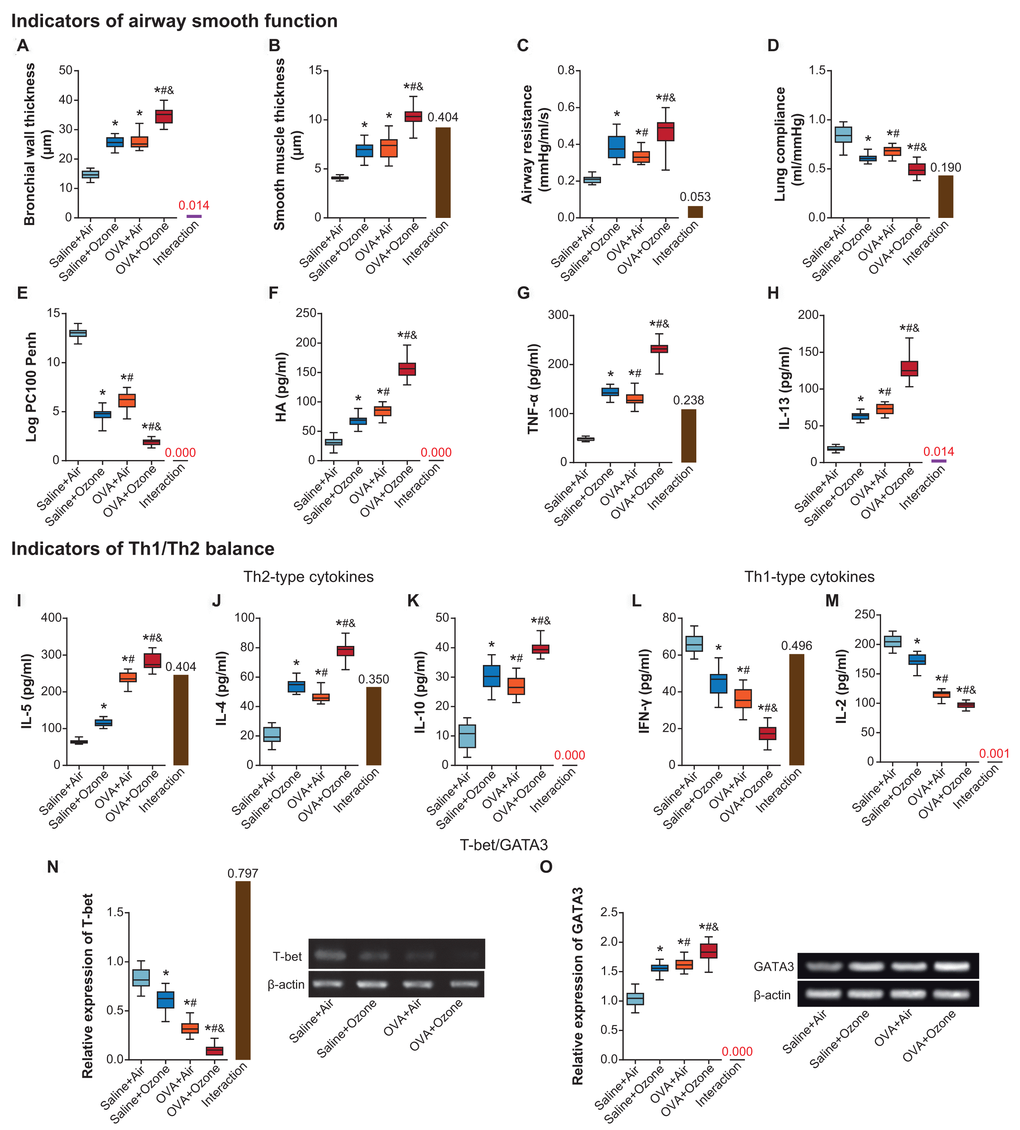
Figure 1. The contribution of ozone exposure to airway smooth function and Th1/Th2 balance of asthmatic mice. (A–E) The bronchial wall thickness (A), smooth muscle thickness (B), airway resistance (C), lung compliance (D) and Log PC100 Penh (E) of mice was examined among saline+air, saline+ozone, OVA+air and OVA+ozone groups. *: P<0.05 when compared with saline+air group, #: P<0.05 when compared with saline+ozone group, &: P<0.05 when compared with OVA+air group. (F–H) Levels of HA (F), TNF-α (G) and IL-13 (H) were determined within mice of saline+air, saline+ozone, OVA+air and OVA+ozone groups. *: P<0.05 when compared with saline+air group, #: P<0.05 when compared with saline+ozone group, &: P<0.05 when compared with OVA+air group. (I–O) The amounts of IL-5 (I), IL-4 (J), IL-10 (K), IFN-γ (L), IL-2 (M), T-bet (N) and GATA3 (O) were determined within mice treated by saline+air, saline+ozone, OVA+air and OVA+ozone. *: P<0.05 when compared with saline+air group, #: P<0.05 when compared with saline+ozone group, &: P<0.05 when compared with OVA+air group.
Impact of ozone on Th1/Th2 balance of asthma mice models
IL-5, IL-4 and IL-10 levels went higher in OVA+ozone group than in OVA+air group and saline+ozone group (P<0.05) (Figures 1I–1K), indicating that ozone and OVA engendered Th2-biased response more significantly than OVA or ozone alone. On the contrary, Th1-like cytokine levels, including IFN-γ (Figure 1L) and IL-2 (Figure 1M), were restrained in OVA+ozone group in comparison to saline+ozone group and OVA+air group (P<0.05). Moreover, changes of T-bet expression were consistent with that of Th1-like cytokines (Figure 1N), yet expressional variation of GATA3 followed a tendency identical to Th2-like cytokines (Figure 1O).
Association of lncRNA PVT1 expression with airway smooth muscle function and Th1/Th2 balance of asthma mice models
PVT1 expression was significantly elevated in CD4+ T cells and ASMCs of OVA+ozone group, as compared with saline+ozone group and OVA+air group (P<0.05) (Figures 2A and 3A). When mice of all subgroups were considered, we found that PVT1 expression in ASMCs was significantly correlated with indicators of airway smooth muscle function, including bronchial wall thickness, smooth muscle thickness, airway resistance, pulmonary compliance, logPC100 Penh, TNF-α level and HA level (Figure 2B). On the other hand, PVT1 expression in CD4+ T cells was highly relevant to amount of Th1/Th2-type cytokines (Figure 3B). Intriguingly, the correlations were stronger in mice of OVA+ozone group than in mice of saline+ozone group and OVA+air group (Figures 2C and 3C), suggesting that OVA and ozone might impose additive effects on PVT1 expression in ASMCs and CD4+ T cells.
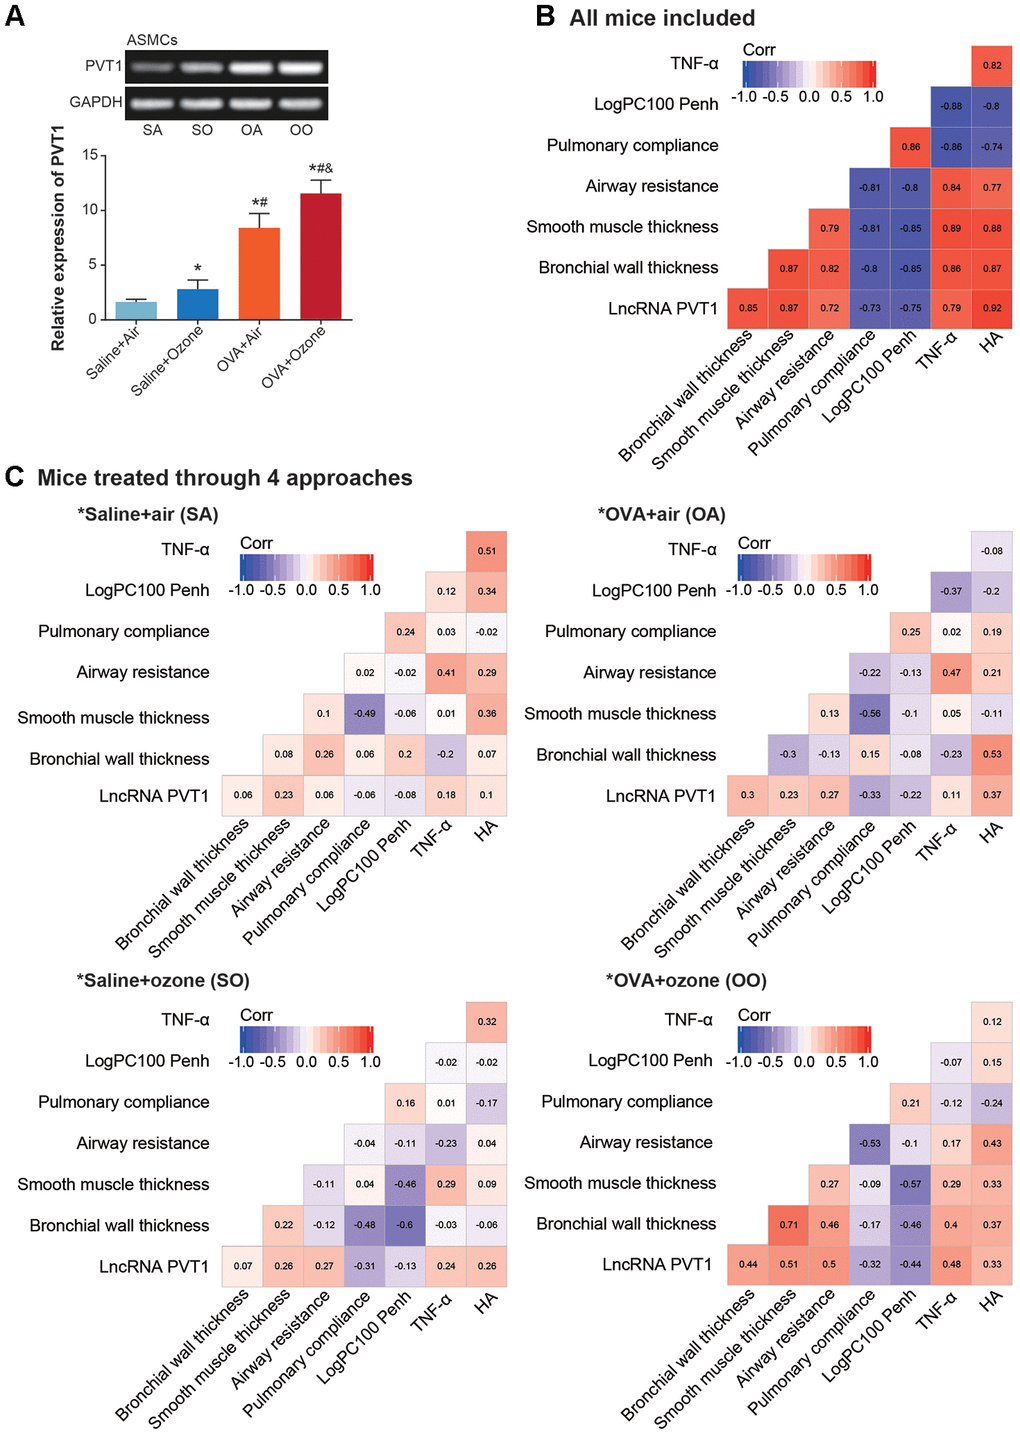
Figure 2. Association of lncRNA PVT1 with airway smooth function of asthmatic mice. (A) PVT1 expression was determined within ASMCs that were extracted from mice models of saline+air (SA), saline+ozone (SO), OVA+air (OA) and OVA+ozone (OO) groups. *: P<0.05 when compared with SA group, #: P<0.05 when compared with saline+ozone group, &: P<0.05 when compared with OVA+air group. (B, C) Correlation matrixes were generated regarding PVT1 expression and airway smooth function in all asthmatic mice (B) and in asthmatic mice handled through 4 approaches (C).
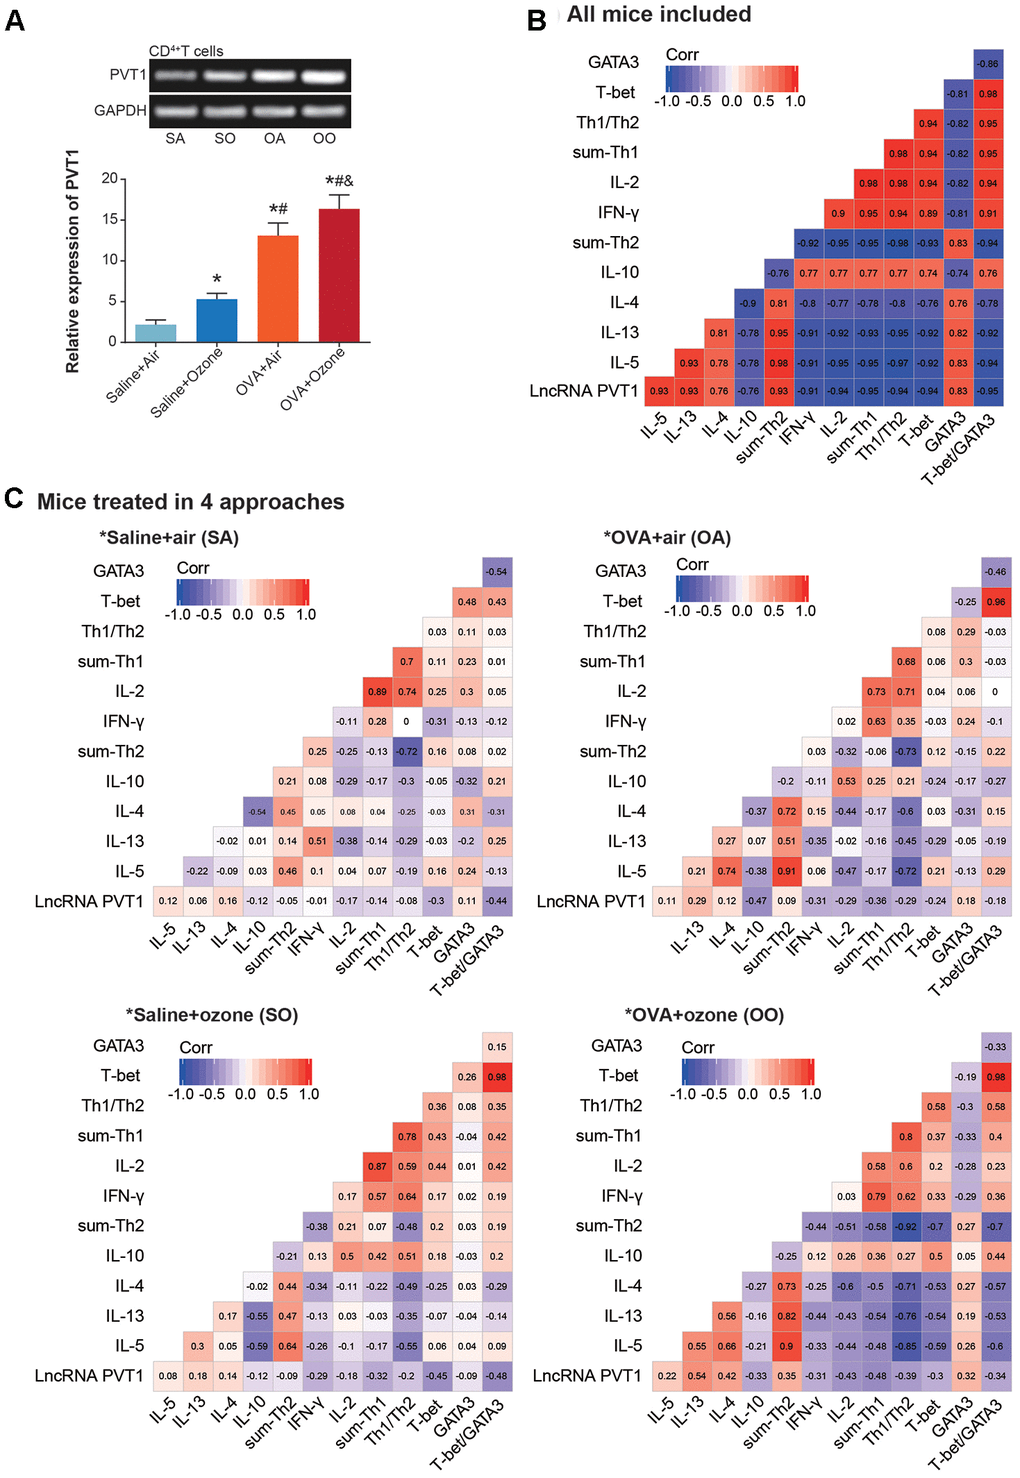
Figure 3. Linkage of lncRNA PVT1 expression with Th1/Th2 balance of asthmatic mice. (A) PVT1 expression was monitored within CD4+ T cells that were obtained from mice models of saline+air (SA), saline+ozone (SO), OVA+air (OA) and OVA+ozone (OO) groups. *: P<0.05 when compared with SA group, #: P<0.05 when compared with saline+ozone group, &: P<0.05 when compared with OVA+air group. (B, C) Correlation matrixes were established concerning PVT1 expression and Th1/Th2-specific cytokines in all asthmatic mice (B) and in asthmatic mice managed through 4 approaches (C).
Identification of miRNAs that were involved in PVT1-mediated airway smooth muscle function and Th1/Th2 balance
MiRNAs potentially sponged by PVT1 were predicted with usage of starbase software [25] (Supplementary material), and asthma-relevant miRNAs were measured in CD4+ T cells and ASMCs isolated from mice models (Figure 4A and 4B, Supplementary Figure 1). It was demonstrated that miR-15a-5p, miR-140-5p, miR-20b-5p, miR-488-3p and miR-455-5p expressions were significantly down-regulated in CD4+ T cells of OVA- and ozone-treated mice (Figure 4A), while miR-29c-3p, miR-143-3p, miR-511-3p, miR-497-5p and miR-488-3p became lowly expressed in ASMCs of OVA/ozone-exposed mice (Figure 4B).
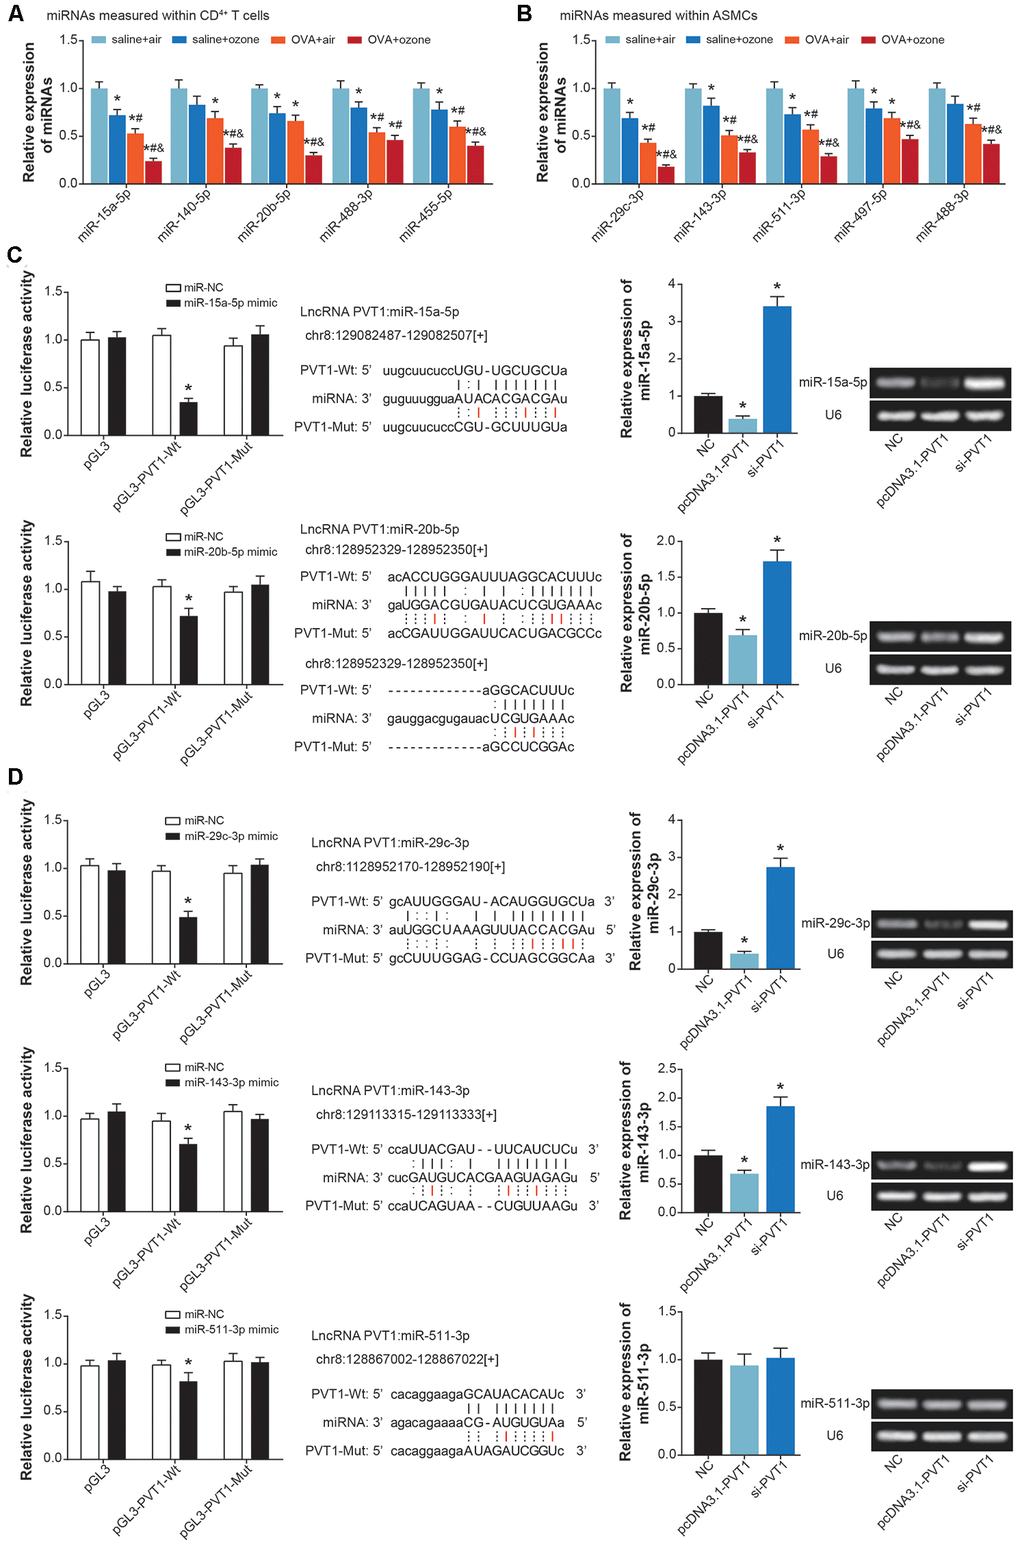
Figure 4. MiRNAs potentially sponged by lncRNA PVT1 within ASMCs and CD4+ T cells. (A) MiR-15a-5p, miR-140-5p, miR-20b-5p, miR-488-3p and miR-455-5p were differentially expressed within CD4+ T cells of saline+air, saline+ozone, OVA+air and OVA+ozone groups. *: P<0.05 when compared with SA group, #: P<0.05 when compared with saline+ozone group, &: P<0.05 when compared with OVA+air group. (B) Expressions of miR-29c-3p, miR-143-3p, miR-511-3p, miR-497-5p and miR-488-3p were evaluated within ASMCs of mice models among saline+air, saline+ozone, OVA+air and OVA+ozone groups. *: P<0.05 when compared with SA group, #: P<0.05 when compared with saline+ozone group, &: P<0.05 when compared with OVA+air group. (C) MiR-15a-5p and miR-20b-5p were sponged and regulated by lncRNA PVT1 in CD4+ T cells. (D) MiR-29c-3p, miR-143-3p and miR-511-3p were subjected to sponged modulation by lncRNA PVT1 in ASMCs.
Furthermore, luciferase activity of CD4+ T cells in the miR-15a-5p/miR-20b-5p mimic+pGL3-PVT1-Wt group was decreased in comparison to miR-NC+pGL3-PVT1-Wt group and miR-15a-5p/miR-20b-5p mimic+pGL3-PVT1-Mut group (P<0.05) (Figure 4C). And miR-15a-5p/miR-20b-5p expression in CD4+ T cells was up-regulated by si-PVT1 and down-regulated by pcDNA3.1-PVT1 (P<0.05), suggesting that miR-15a-5p and miR-20b-5p in CD4+ T cells were suppressed after being sponged by PVT1. Concerning ASMCs, their luciferase activity was attenuated in the miR-29c-3p/miR-143-3p/miR-511-3p mimic+pGL3-PVT1-Wt group, when compared with miR-NC+pGL3-PVT1-Wt group and miR-29c-3p/miR-143-3p/miR-511-3p mimic+pGL3-PVT1-Mut group (P<0.05) (Figure 4D). And miR-29c-3p and miR-143-3p expressions were lessened by pcDNA3.1-PVT1 and yet increased by silencing of PVT1 (P<0.05), implying that PVT1 possibly sponged miR-29c-3p/miR-143-3p and inhibited their expression.
What’s more, PI3K-Akt signaling and mTOR signaling were KEGG pathways enriched by genes targeted by significant miRNAs in CD4+ T cells and ASMCs (Figure 5), which was draw from miRPath software [26]. Interestingly, the PI3K-Akt-mTOR signaling counted much in lung inflammation and airway remodeling of asthma [27–32], and they were involved in propelling ozone-stimulated oxidative stress [33, 34]. It was thus speculated that PVT1-miRNA axis might participate in ozone-induced asthma development by activating PI3K/Akt/mTOR signaling.
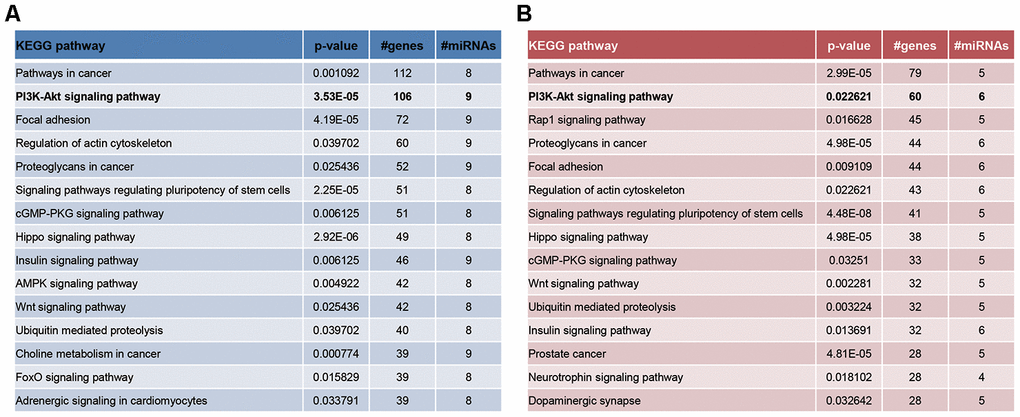
Figure 5. The enrichment pathways of significantly-expressed miRNAs in CD4+ T cells (A) and ASMCs (B) were drawn based on miRPath software.
PVT1 sponged miR-29c-3p to facilitate proliferation and depress apoptosis of ASMCs
PVT1 expression in ASMC was elevated dramatically after transfection of pcDNA3.1-PVT1, yet its expression revealed a drop when si-PVT1 was transfected (P<0.05) (Figure 6A). Moreover, pcDNA3.1-PVT1 strengthened viability and proliferation, yet hindered apoptosis of ASMCs (P<0.05) (Figure 6B–6D). By contrast, viability and proliferation of ASMCs were weakened, and ASMC apoptosis was accelerated by si-PVT1 (P<0.05). Furthermore, bax/caspase-3 expressions were down-regulated, and bcl-2 expression was up-regulated in cases of pcDNA3.1-PVT1 transfection (P<0.05), whereas si-PVT1 group exhibited higher bax/caspase-3 expressions and lower bcl-2 expression than si-NC group (P<0.05) (Figure 6E). It was noteworthy that viability and proliferation of ASMCs were impaired in the pcDNA3.1-PVT1+miR-29c-3p mimic group in comparison to pcDNA3.1-PVT1 group (P<0.05) (Figure 6F and 6G), yet ASMC apoptosis was boosted in the pcDNA3.1-PVT1+miR-29c-3p mimic group as relative to pcDNA3.1-PVT1 group (P<0.05) (Figure 6H). Expressions of caspase-3 and bax were also raised, along with decreased expression of bcl-2, in pcDNA3.1-PVT1+miR-29c-3p mimic group, when compared with pcDNA3.1-PVT1 group (P<0.05) (Figure 6I).
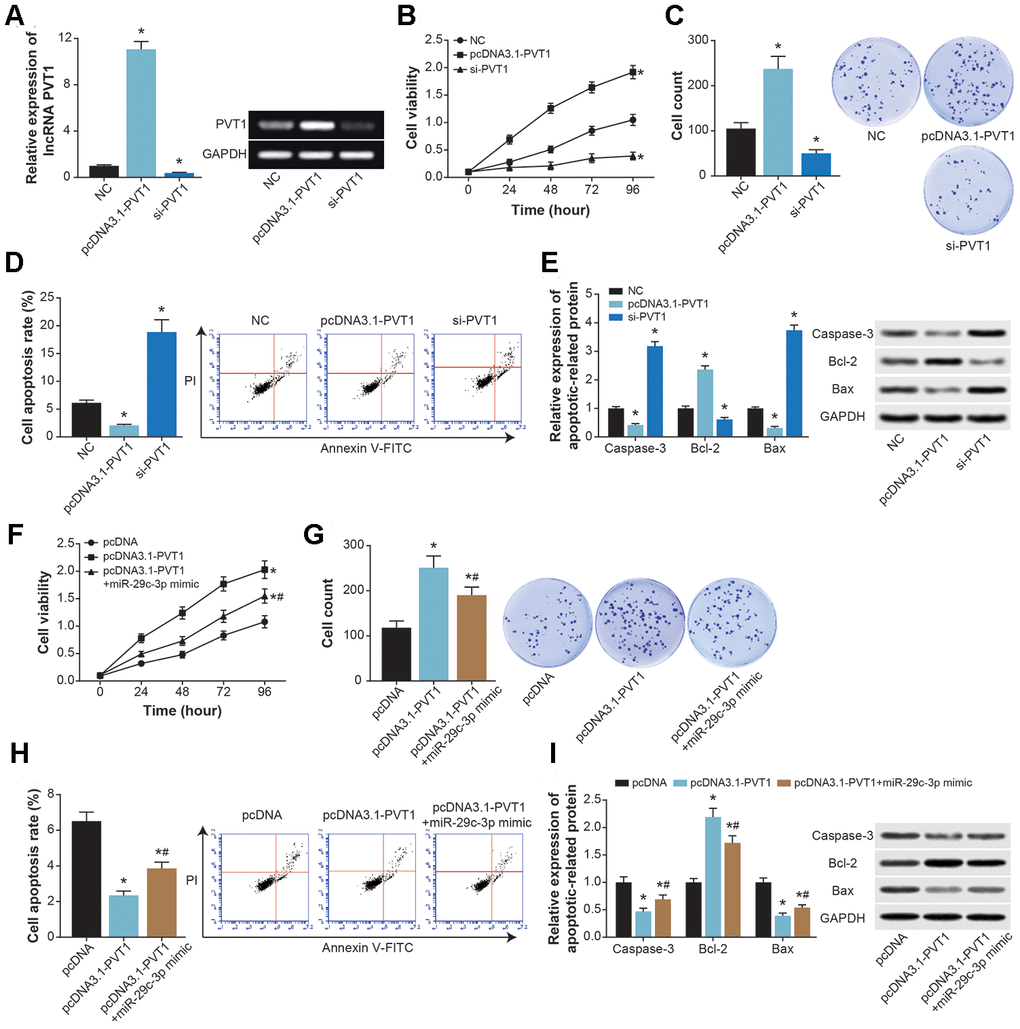
Figure 6. The effects of PVT1 and miR-29c-3p on proliferation and apoptosis of ASMCs. (A) PVT1 expression in ASMCs was determined after transfection of pcDNA-PVT1 and si-PVT1. *: P<0.05 when compared with NC group. (B–D) The viability (B), proliferation (C) and apoptosis (D) of ASMCs were compared after transfections of pcDNA-PVT1 and si-PVT1. *: P<0.05 when compared with NC group. (E) The expressions of apoptotic proteins within ASMCs were compared under treatments of pcDNA-PVT1and si-PVT1. *: P<0.05 when compared with NC group. (F–H) The viability (F), proliferation (G) and apoptosis (H) of ASMCs were evaluated among pcDNA3.1, pcDNA3.1-PVT1 and pcDNA3.1-PVT1+miR-29c-3p mimic groups. *: P<0.05 when compared with pcDNA3.1 group, #: P<0.05 when compared with pcDNA3.1-PVT1 group. (I) Expressions of apoptins were measured within ASMCs of pcDNA3.1, pcDNA3.1-PVT1 and pcDNA3.1-PVT1+miR-29c-3p mimic groups. *: P<0.05 when compared with pcDNA3.1 group, #: P<0.05 when compared with pcDNA3.1-PVT1 group.
PI3K/AKT signaling reversed inhibition of miR-29c-3p on ASMC viability, proliferation and apoptosis
Expressions of p-PI3K, p-AKT and p-mTOR in ASMCs were heightened by pcDNA3.1-PVT1 or miR-29c-3p inhibitor (P<0.05), and they were suppressed by si-PVT1 and miR-29c-3p mimic (P<0.05) (Figure 7A). However, IGF-1 (i.e. activator of PI3K/AKT signaling) and LY294002 (i.e. inhibitor of PI3K/AKT signaling) treatments failed to alter PVT1 and miR-29c-3p expressions in ASMCs (P>0.05) (Figure 7B). In addition, proliferation and viability of ASMCs were significantly motivated in the miR-29c-3p mimic+IGF-1 group as compared with miR-29c-3p mimic group (P<0.05) (Figure 7C and 7D), and ASMCs in the miR-29c-3p mimic+IGF-1 group were less prone to apoptosis than ASMCs in the miR-29c-3p mimic group (P<0.05) (Figure 7E and 7F).
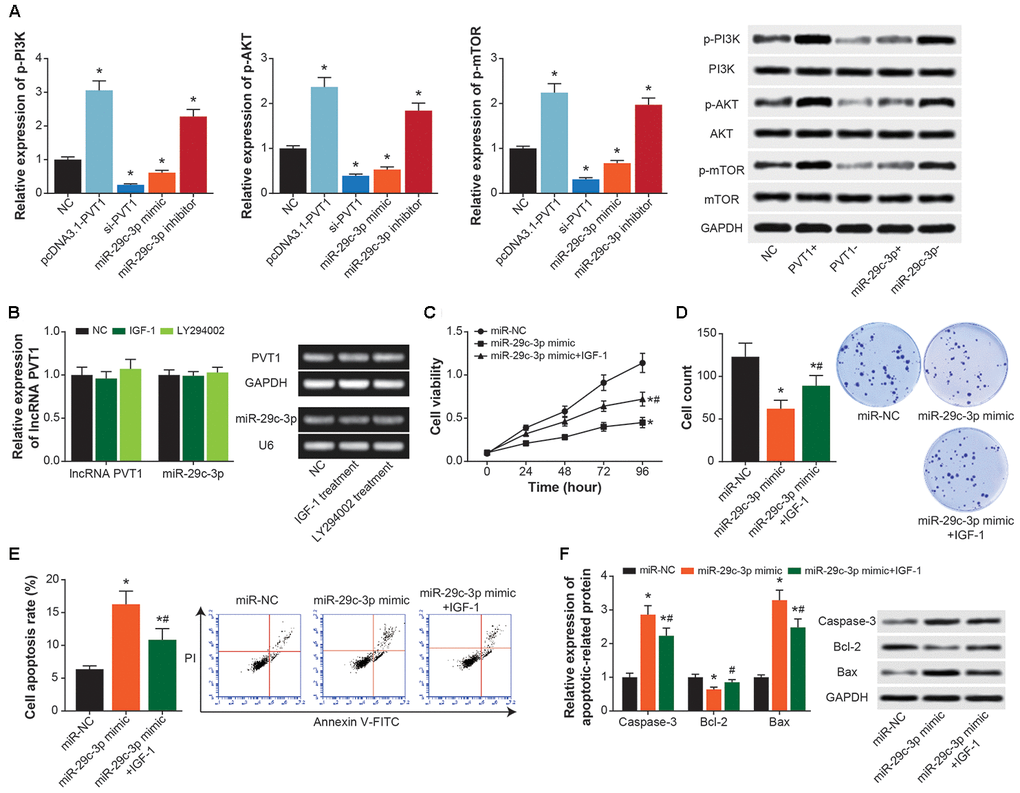
Figure 7. PI3K/AKT/mTOR signaling mediated the impact of PVT1/miR-29c-3p axis on ASMC activity. (A) Expressions of p-PI3K, PI3K, p-AKT, AKT, p-mTOR and mTOR were determined within ASMCs that were treated by none, pcDNA3.1-PVT1, si-PVT1, miR-29c-3p mimic and miR-29c-3p inhibitor. *: P<0.05 when compared with NC group. (B) Expressions of PVT1 and miR-29c-3p were assessed in ASMCs managed by IGF-1 and LY294002. *: P<0.05 when compared with NC group. (C–E) Viability (C), proliferation (D) and apoptosis (E) of ASMC were appraised among miR-NC, miR-29c-3p mimic and miR-29c-3p mimic+IGF-1 groups. *: P<0.05 when compared with miR-NC group, #: P<0.05 when compared with miR-29c-3p mimic group. (F) Expressions of apoptins were measured within ASMCs of miR-NC, miR-29c-3p mimic and miR-29c-3p mimic+IGF-1 groups. *: P<0.05 when compared with miR-NC group, #: P<0.05 when compared with miR-29c-3p mimic group.
PVT1/miR-15a-5p axis promoted Th1/Th2 imbalance of CD4+T cells by activation of PI3K-AKT signaling
PVT1 expression was significantly increased in CD4+ T cells transfected by pcDNA3.1-PVT1 (P<0.05), and was decreased by transfection of si-PVT1 (P<0.05) (Figure 8A). MiR-15a-5p expression in CD4+ T cells was enhanced by miR-15a-5p mimic (P<0.05), and was diminished by miR-15a-5p inhibitor (P<0.05) (Figure 8A). Moreover, pcDNA3.1-PVT1 and miR-15a-5p inhibitor were found to activate p-PI3K, p-AKT and p-mTOR in CD4+ T cells (P<0.05), which were deactivated by si-PVT1 and miR-15a-5p mimic (P<0.05) (Figure 8B). Nevertheless, expressions of PVT1 and miR-15a-5p in CD4+ T cells were almost unchanged by IGF-1 and LY29400, when compared with untreated CD4+ T cells (P>0.05) (Figure 8C). Furthermore, CD4+ T cells of miR-15a-5p mimic+IGF-1 group engendered lower protein levels of IFN-γ, IL-2 and T-bet and higher protein levels of IL-4, IL-10 and GATA3 than CD4+ T cells of miR-15a-5p mimic group (P<0.05) (Figure 8D).
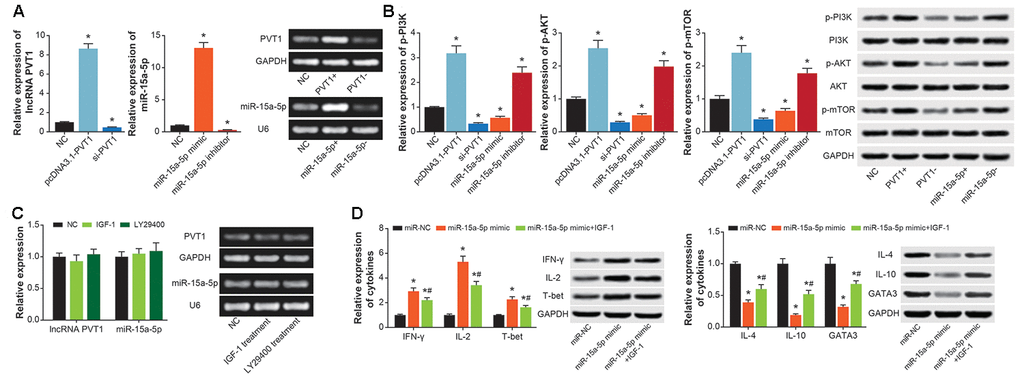
Figure 8. PI3K/AKT/mTOR signaling was implicated in the contribution of PVT1/miR-15a-5p axis to Th1/Th2 balance in CD4+ T cells. (A) PVT1 expression was determined after transfection of pcDNA3.1-PVT1 and si-PVT1, and miR-15a-5p level was compared in CD4+ T cells transfected by miR-15a-5p mimic and inhibitor. *: P<0.05 when compared with miR-NC group. (B) The p-PI3K, PI3K, p-AKT, AKT, p-mTOR and mTOR expressions in CD4+ T cells were figured out among NC, pcDNA3.1-PVT1, si-PVT1, miR-15a-5p mimic and miR-15a-5p inhibitor groups. *: P<0.05 when compared with NC group. (C) PVT1 and miR-15a-5p expressions were obtained from CD4+ T managed by IGF-1 and LY294002. *: P<0.05 when compared with NC group. (D) The levels of cytokines relevant to Th1/Th2 imbalance were determined within CD4+ T cells among miR-NC, miR-15a-5p mimic and miR-15a-5p mimic+IGF-1 groups. *: P<0.05 when compared with miR-NC group, #: P<0.05 when compared with miR-15a-5p mimic group.
Diagnostic performance of PVT1 in asthma
Higher serum levels of TNF-α, IL-13, IL-4, IL-10, hs-CRP and FeNO were determined in asthma patients than in healthy volunteers (P<0.05) (Supplementary Table 3). The cytokine levels also demonstrated an upward trend in patients with acute asthma when compared with patients in the remission stage of asthma (P<0.05). Conversely, asthma patients were associated with smaller FEV1 and lower FEV1/FVC ratio than healthy controls (P<0.05), and both FEV1 and FEV1/FVC ratio were lessened in patients with acute asthma as compared with asthma patients in remission stage (P<0.05). Serum level of PVT1 also went up significantly in asthma patients when compared with healthy controls (P<0.05), and patients with acute asthma revealed higher PVT1 expression than asthma patients in remission stage (P<0.05) (Supplementary Figure 2A). It seemed that PVT1 was promising in diagnosis of asthma (AUC=0.909) (Supplementary Table 4, Supplementary Figure 2B) and in differentiating patients with acute asthma from asthma patients in remission stage (AUC=0.705) (Supplementary Table 4, Supplementary Figure 2C).
Discussion
Here we attempted to uncover whether lncRNA PVT1-miRNA axis was implicated in the pathogenesis of ozone-induced asthma. Firstly, mice models of asthma were established [35], and it was intriguing to notice that acute exposure to ozone aggravated asthma symptoms in OVA-exposed mice models [36] (Figure 1). Specifically, airway wall and airway smooth muscle were thickened (Figure 1A and 1B), along with intensified airway stenosis, in ozone-exposed asthmatic mice (Figure 1C and 1D), suggesting that ozone drove airway remodeling and suppressed pulmonary compliance of asthmatic mice. Changes of log100 Penh value (Figure 1E), determined by means of pneumotachograph of whole-body plethysmography [37], reflected that airway responsiveness of asthmatic mice was reduced after exposure to ozone, and the noticeable increase in levels of TNF-α and HA (Figure 1F and 1G) suggested that ASMC proliferation in OVA-exposed mice was promoted by ozone [38–41]. In addition to airway function controlled by ASMC, Th1/Th2 balance manipulated by CD4+ T cells was also aggravated by OVA exposure and ozone [10, 42, 43], detailed as that ozone increased Th2/Th1 ratio (Figure 1I-1M) and decreased T-bet/GATA3 ratio (Figure 1N and 1O) in OVA-exposed mice.
There have been evidence that ozone triggered asthma onset by inducing airway responsiveness and airway inflammation [44–46]. The proponents held that oxygen free radicals generated by ozone attacked intra-membranous polyunsaturated fatty acid and triggered oxidative damage in organisms [47–49], which finally worsened inflammation in airway [50, 51]. However, a contradiction existed that prevalence of asthma was disproportionate to worldwide concentration of ozone (https://www.stateofglobalair.org/data/#/air/map) (Supplementary Tables 1 and 2) [52]. We speculated that distinctions in detecting instrument, operation step and measurement standard might blur the actual impact of ozone on asthma onset. Other contributors to asthma, such as family history and abrupt climate change, could also confuse the internal association of ozone with asthma development. Of note, PVT1, which contained a genomic region indicative of high cancer risk [53, 54], was conjectured to involve in ozone-caused asthma progression, allowing for that PVT1 expression was strongly correlated with ASMC function and Th1/Th2 balance of ozone-treated asthma mice models (Figures 2, 3). This might be ascribed to the strength of PVT1 in promoting ASMC multiplication and in boosting secretion of Th2-type cytokines as opposed to Th1-type cytokines by CD4+ T cells.
Founded on the ceRNA theory, we suspected that PVT1 probably urged asthma progression by sponging miR-15a-5p and miR-29c-3p, two protective miRNAs in asthma [55]. The miR-15a-5p was documented to hinder production of inflammatory chemokines (e.g. IL-10) [56], and to prevent onset of T cell-relevant diseases [57]. Here PVT1 was speculated to promote Th2-orineted inflammation in CD4+ T cells by resisting function of miR-15a-5p (Figure 4C, Figure 8D), which was a highlight of this study. With regard to miR-29c-3p, which was down-regulated in asthma children [58], we found it effective in reversing the contribution of PVT1 to ASMC proliferation and viability (Figure 6F–6I). Despite difference in cell type, miR-29c-3p was capable of holding up proliferation, invasion and metastasis of tumor cells [59, 60], including lung cancer, hepatic carcinoma, gastric cancer, glioma and leukemia [61–63], And this might explain why miR-29c-3p prevented ASMC abnormality in asthma from the molecular side.
In addition, PI3K/Akt/mTOR signaling was a widely-recognized driver of airway inflammation and airway remodeling underlying asthma etiology. For instance, PI3K was able to reinforce inflammation response mediated by eosinophilic granulocyte, T cell, mastocyte and neutrophil, which stayed core to asthma onset [64]. Th2-centric inflammation response was also promoted by PI3K [65], and Akt activation tended to guide differentiation of Th cells into Th2-like CD4+ T cells [66]. Furthermore, PI3K-dependent P70S6K activation was implicated in controlling mitogen-stimulated response of ASMC [67], and PI3K/Akt/mTOR signaling was capable of worsening airway remodeling by stimulating ASMC proliferation [68–72]. Our study newly introduced that PI3K/Akt/mTOR signaling not merely diminished the effect of miR-15a-5p on Th1/Th2 balance in CD4+ T cells (Figure 8D), but also undermined the impact of miR-29c-3p on ASMC proliferation (Figure 7C–7F), which expanded knowledge about asthma pathogenesis.
Conclusions
In conclusion, this investigation tentatively verified that ozone exacerbated asthma development by activating PVT1-miR-15a-5p/miR-29c-3p signaling, which motivated Th1/Th2 imbalance of CD4+ T cells and urged excessive proliferation of ASMCs (Figure 9). Nonetheless, although cell models and animal models were established, clinical evidence was insufficient to support this hypothesis, which necessitated more convincing evidence. Secondly, genes that encoded oxidative/non-oxidative enzymes were not detected, so impacts of ozone and OVA on in-vivo oxidative stress could not be verified. Last but not the least, ozone level applied here was above the concentration of natural exposure and also exceeded the concentration which induced asthma onset (i.e. 0.06 ppm) [73]. It might be better if later researches were designed to tally with practical settings.
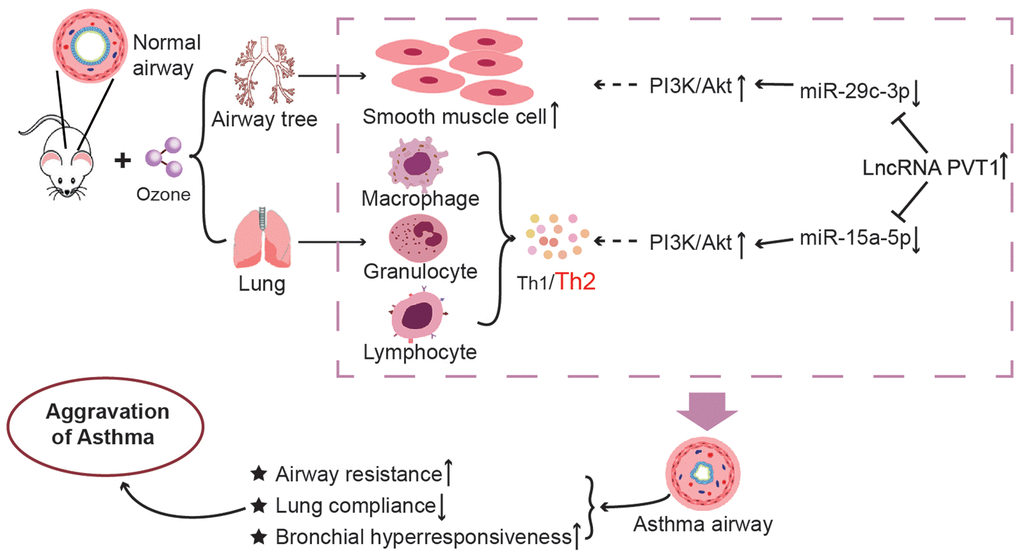
Figure 9. The mechanism diagram about impacts of lncRNA PVT1–centered miRNA networks and ozone on asthmatic progression. It was revealed that exposure to ozone impacted Th1/Th2 imbalance of CD4+ T cells by regulating lncRNA PVT1-miR-15a-5p-PI3K/AKT/mTOR axis and apoptosis of ASMCs through modifying lncRNA PVT1-miR-29c-3p- PI3K/AKT/mTOR axis.
Materials and Methods
Establishment of mice models with acute asthma
A total of 168 female BALB/C mice, aged 8-10 weeks old and weighing around 20 g, were purchased from Shanghai Laboratory Animal Center (Shanghai, China). The mice, exposed under a 12h/12h light/dark cycle, were housed in individually ventilated cages that were controlled at a 24° C and in 60% humidity. We divided the mice into saline+air group (n=42), OVA+air group (n=42), saline+ozone (n=42) group and OVA+ozone (n=42) group, and their treatments were particularized in Supplementary Figure 3.
Assessment of airway resistance and pulmonary compliance in asthma mice models
After being anesthetized by 80 mg/kg pentobarbital for 10 min, trachea of mice models was separated by cutting cervical region and peeling upper airway. The trachea was cut between the 2nd and the 3rd cricoid cartilage, and a cannula (diameter: 0.9 mm) was inserted into the airway until a depth of 3-4 mm. Then a knot was tied to fix the 4th and the 5th trachea cartilage ring, and cannula was connected to animal ventilator (model: SAR-830, CWE corporation, USA). Airway resistance (R) and pulmonary compliance of mice models were automatically calculated by MF Lab software (version 3.01).
Evaluation of bronchial reactivity and airway hyper-responsiveness (AHR) in asthma mice models
Bronchial reactivity of mice models was monitored using non-invasive whole-body plethysmograph (model: FinePointe™NAM, Bucxo, USA). Basic enhanced pause (Penh) value and Penh values under treatments of 0, 1.56, 3.12, 6.25, 12.5, 25 and 50g/L methacholine (MCH) were detected [74], and airway reactivity was calculated according to the formula of
Measurement of bronchoalveolar cytokines in asthma mice models
A polyethylene catheter (diameter: 1.0 mm) was inserted into the slot which was cut between the 2nd and the 3rd cartilaginous rings of mice models. Then icy PBS was injected into lung of mice models with a syringe (model: 1 ml), and 80% of the lavage fluid was recycled. After centrifugation at 7500×g for 5 min, IL-5, IL-13, TNF-α, HA, IFN-γ, IL-2, IL-4 and IL-10 levels in the supernatant were determined with ELISA kits (R&D Systems, USA).
Appraisal of bronchial wall/smooth muscle thickness in asthma mice models
Lung hilum cut from mice models was immersed within 4% paraformaldehyde, and 6 h later they were immersed in 70% ethanol and embedded by paraffin. Slices stained by hemotoxylin-eosin (HE) were observed under 200× light microscope, and bronchial walls with complete structure were selected. Circumferential diameter of bronchial basement membrane (Pbm), total area of bronchial wall (Wat) and area of bronchial smooth muscle (Wam) were gauged aided by IPP 6.0 image analysis software. Wat/Pbm ratio and Wam/Pbm ratio were, respectively, indicative of bronchial wall thicknesses and smooth muscle thicknesses.
Isolation of CD4+ T cells and ASMCs from asthma mice models
Isolation of CD4+ T cells from spleen of mice models
After centrifugation at the spend of 2000 r/min, monocytes were re-suspended within 5 ml RPMI1640 medium which contained 10% FCS (Gibco, USA). Monocytes adjusted to the concentration of 1×10⁸/ml were incubated with 1 ml rat anti-mouse CD4 antibody (eBioscience, USA) for 15 min at room temperature. Then cell suspension that flew through separation column (R&D Systems, USA) was collected, until liquid effluent became clear.
Extraction of ASMCs from trachea of mice models
Tracheal of mice models was separated, and their bronchus was vertically dissected and cut into tissue blocks sized as 1 mm3. The cells were then cultivated in 5% CO2 at 37° C, until digestion by 0.25% trypsin on the 10th day. ASMCs were confirmed by performing α-actin immune-cytochemical staining.
Cell transfection
With assistance of Lipofectamine® RNAiMAX transfection kit (Thermo Fisher Scientific, USA), si-PVT1 (Genepharma, China), si-NC, pcDNA3.1-PVT1 (Genepharma, China), miR-15a-5p mimic and miR-15a-5p inhibitor (Ribobio, China) were, respectively, transfected into CD4+ T cells. On the other hand, si-PVT1, pcDNA3.1-PVT1, miR-29c-3p mimic and miR-29c-3p inhibitor (Genepharma, China) were transfected into ASMCs, respectively. ASMCs and CD4+ T cells were cultivated within Opti-MEM® reduced serum medium (Thermo Fisher Scientific, USA), until they grew to > 70% confluency.
Cell treatment
CD4+ T cells and ASMCs were treated by insulin-like growth factor (IGF-1, Peprotech, USA) at the final concentration of 1 μmol/L or LY294002 (Selleck, USA) at the final concentration of 50 μmol/L.
Evaluation of ASMC activity
CCK-8 assay
ASMCs inoculated at the concentration of 1×10⁴/ml were cultivated until they became adherent to the plate wall. Then ASMCs of each well were incubated by 10 μl CCK 8 reagent (DOJINDO, Japan) for 4 h. Absorbance (A) of ASMCs was measured on the enzyme-linked immunosorbent assay system (model: ElX800, BIO-TECH, USA) at the wavelength of 450 nm.
Colony formation assay
ASMCs at the density of 4×10³/well were cultured in 6-well plates for 9 days, and then they were fixed by 4% paraformaldehyde for 15 min and dyed by 0.1 % crystal violet for 20 min. Photographs were taken after air-dry of ASMCs.
Cell apoptosis assay
When ASMCs (concentration: 1 × 10⁵/well) grew to cover 70% of cell plate, they were mixed by 10 μl Annexin V-FITC (Sigma, USA) and 5 μl propidium iodide (PI) (Sigma, USA). After 15-min culture in the darkness, percentage of apoptotic ASMCs was assessed on flow cytometer (model: FACSAria, BD, USA).
Collection of blood samples from asthma patients
One hundred and forty-seven patients with asthma were recruited from The First Hospital of Shanxi Medical University. The asthma patients were all in accordance with diagnostic criteria formulated by Chinese Society of Respiratory Medicine [75], including 85 patients at the acute stage of asthma and 62 asthma patients in remission stage. Asthma patients in remission stage should not show any acute asthma symptoms in the past ≥ 1 month, and patients with acute asthma were given glucocorticoids-/bronchodilators-based treatments. Meanwhile, 46 healthy volunteers without any history of allergic diseases were incorporated, and they should not suffer from any infectious diseases for the past 2 months. All the participants have signed informed consents, and this program was approved by The First Hospital of Shanxi Medical University and the ethics committee of The First Hospital of Shanxi Medical University. Around 4 ml venous blood was taken from each subject, which was reserved at -80° C for PVT1 detection with RT-PCR.
Western blotting
Concentration of total proteins, extracted from tissues and cells with RIPA buffer, was measured with BCA kit (Beyotime, China). After undergoing 10% sodium dodecyl sulfate-polyacrylamide gel electrophoresis (SDS-PAGE), protein samples were electrically transferred onto polyvinylidene fluoride (PVDF) membrane for 3 h. Afterwards, the samples were blocked by 5% skim milk for 1 h, followed by incubation with primary antibodies (rabbit anti-mouse, Abcam, USA) against caspase-3 (1: 500, Catalog No.: ab13847, Abcam), Bcl-2 (1: 2000, Catalog No.: ab196495, Abcam), Bax (1: 3000, Catalog No.: ab32503, Abcam), p-PI3K (1:1000, Catalog No.:17366, Cell Signaling Technology), PI3K (1:1000, Catalog No.:4292, Cell Signaling Technology), p-AKT (1:2000, Catalog No.: 4060, Cell Signaling Technology), AKT (1:1000, Catalog No.:4691, Cell Signaling Technology), p-mTOR (1:1000, Catalog No.:5536, Cell Signaling Technology), mTOR (1:1000, Catalog No.:2972, Cell Signaling Technology), IFN-γ (1: 3000, Catalog No.: ab171081, Abcam), IL-2 (1:500, Catalog No.: ab180780, Abcam), T-bet (1:1000, Catalog No.: ab154058, Abcam), IL-4 (1:1000, Catalog No.: ab9811, Abcam), IL-10 (1:1000, Catalog No.: ab189392, Abcam), GATA3 (1:1000, Catalog No.: ab182747, Abcam), GAPDH (1: 10000, Catalog No.: ab181603, Abcam). On the next day, the products were incubated by horseradish peroxidase (HRP)-labeled secondary antibody (goat anti-rabbit, 1: 10000, Catalog No.: ab97080, Abcam, USA) at room temperature for 1 h. Finally, development was accomplished with aid of ImmobilonTM Western Chemiluminescent kit (Merck Millipore, USA), and proteins were quantified utilizing image-pro plus 5.0 software.
Quantitative real-time polymerase chain reaction (qRT-PCR)
Total RNAs were extracted from tissues, cells and blood samples utilizing RNAiso Plus reagent (TakaRa, Japan), and integrity of the RNAs was confirmed by agarose gel electrophoresis. The RNAs were reversely transcribed into cDNAs on the strength of SYBR green-based qRT-PCR kit (Invitrogen, USA). With primers (Table 1 and Supplementary Table 5) designed and synthesized by Genepharma (China), cDNAs were amplified by PCR under conditions of: 1) 95° C for 10 min, and 2) 40 cycles of 95° C for 15 s and 60° C for 1 min. Relative expressions of genes were calculated in accordance with 2- ΔΔCt method.
Table 1. The sequences of the primers for the amplification used by real-time PCR.
| Subject | Primers (5'-3') | |
| Forward | Reverse | |
| GATA3 | CGAGAAAGAGTGCCTCAAGTACC | GAAGTCCTCCAGTGAGTCATGC |
| T-bet | GTGACCCAGATGATTGTGCT | GGTTGGGTAGGAGAGGAGAG |
| β-actin | TGGGTCAGAAGGATTCCTAT | ATGAGGTAGTCAGTCAGGTCC |
| PVT1 | TGAGAACTGTCCTTACGTGACC | AGAGCACCAAGACTGGCTCT |
| GAPDH | CGTGTTCCTACCCCCAATGT | TGTCATACTTGGCAGGTTTCT |
| miR-15a-5p | ATCCAGTGCGTGTCGTG | TGCTTAGCAGCACATAATG |
| miR-29c-3p | GCCTAGCACCATTTGAAATCG | GTGCAGGGTCCGAGGT |
| U6 | CTCGCTTCGGCAGCACA | ACGCTTCACGAATTTGCGT |
Dual-luciferase reporter gene assay
PVT1 fragments that incorporated binding sites with miR-15a-5p/miR-140-5p/miR-20b-5p/miR-488-3p/miR-455-5p were, respectively, amplified by PCR, so that PVT1-wide type (Wt) fragments corresponding to each miRNA were produced. On the other hand, PVT1-mutant type (Mut) fragments were generated similarly, except that binding sites with miR-15a-5p/miR-140-5p/miR-20b-5p/miR-488-3p/miR-455-5p were mutated in PVT1 fragments. Then PVT1 fragments were inserted into pGL3-Promoter plasmid vector (Promega, USA), so that pGL3-PVT1-Wt and pGL3-PVT1-Mut for each miRNA were constructed. Subsequently, miR-15a-5p mimic/miR-140-5p mimic/miR-20b-5p mimic/miR-488-3p mimic/miR-455-5p mimic/miR-NC (Genepharma, China) were co-transfected with pGL3-PVT1-Wt, pGL3-PVT1-Mut or pRL-TK plasmid (Promega, USA) into CD4+ T cells, and miR-29c-3p mimic/miR-143-3p mimic/miR-511-3p mimic/miR-497-5p mimic/miR-488-3p mimic/miR-NC (Genepharma, China) were co-transfected with pGL3-PVT1-Wt, pGL3-PVT1-Mut or pRL-TK plasmid into ASMCs. After 12-h incubation in 5% CO2 at 37° C, firefly luciferase activity and renin luciferase activity of CD4+ T cells and ASMCs were monitored on the microplate reader (BioTek, USA), in accordance with instructions of dual luciferase reporter gene detection kit (Promega, USA).
Statistical analyses
All the data were statistically analyzed by SPSS19.0 software. Quantitative data, presented as mean ± standard deviation, were compared with student’s t test or one-way analysis of variance (ANOVA). Interaction of ozone and OVA on airway smooth muscle function and Th1/Th2 cytokine level were appraised by 2×2 factorial design, and correlation matrix was established utilizing “ggcorrplot” package of R studio software (https://www.r-project.org). It was statistically significant if P was smaller than 0.05.
Ethics approval
All these operations and experimental process have been approved by the experimental animal ethics committee of The First Hospital of Shanxi Medical University.
Author Contributions
Yangyang Wei, Baofen Han, Wenjuan Dai, Shufang Guo, Caiping Zhang, Lixuan Zhao, Yan Gao, Yi Jiang, Xiaomei Kong: conceived and designed the experiments. Yangyang Wei, Baofen Han, Wenjuan Dai, Shufang Guo: performed the experiments. Caiping Zhang, Lixuan Zhao: analyzed the data. Yan Gao, Yi Jiang, Xiaomei Kong: drafted the manuscript. All authors read and approved the final manuscript.
Conflicts of Interest
The authors declare that they have no conflicts of interest.
Funding
This study was supported by the Key Research and Development Project of Shanxi Province (201903D421072).
References
- 1. Reddel HK, Bateman ED, Becker A, Boulet LP, Cruz AA, Drazen JM, Haahtela T, Hurd SS, Inoue H, de Jongste JC, Lemanske RF
Jr , Levy ML, O’Byrne PM, et al. A summary of the new GINA strategy: a roadmap to asthma control. Eur Respir J. 2015; 46:622–39. https://doi.org/10.1183/13993003.00853-2015 [PubMed] - 2. Rabe KF. Update in asthma 2015. Am J Respir Crit Care Med. 2016; 194:259–64. https://doi.org/10.1164/rccm.201602-0222UP [PubMed]
- 3. Masoli M, Fabian D, Holt S, Beasley R, and Global Initiative for Asthma (GINA) Program. The global burden of asthma: executive summary of the GINA dissemination committee report. Allergy. 2004; 59:469–78. https://doi.org/10.1111/j.1398-9995.2004.00526.x [PubMed]
- 4. O’Reilly R, Ullmann N, Irving S, Bossley CJ, Sonnappa S, Zhu J, Oates T, Banya W, Jeffery PK, Bush A, Saglani S. Increased airway smooth muscle in preschool wheezers who have asthma at school age. J Allergy Clin Immunol. 2013; 131:1024–32. https://doi.org/10.1016/j.jaci.2012.08.044 [PubMed]
- 5. Baldwin L, Roche WR. Does remodelling of the airway wall precede asthma? Paediatr Respir Rev. 2002; 3:315–20. https://doi.org/10.1016/s1526054202002610 [PubMed]
- 6. Chung KF, Wenzel SE, Brozek JL, Bush A, Castro M, Sterk PJ, Adcock IM, Bateman ED, Bel EH, Bleecker ER, Boulet LP, Brightling C, Chanez P, et al. International ERS/ATS guidelines on definition, evaluation and treatment of severe asthma. Eur Respir J. 2014; 43:343–73. https://doi.org/10.1183/09031936.00202013 [PubMed]
- 7. Olin JT, Wechsler ME. Asthma: pathogenesis and novel drugs for treatment. BMJ. 2014; 349:g5517. https://doi.org/10.1136/bmj.g5517 [PubMed]
- 8. Svensson Holm AC, Bengtsson T, Grenegård M, Lindström EG. Platelets stimulate airway smooth muscle cell proliferation through mechanisms involving 5-lipoxygenase and reactive oxygen species. Platelets. 2008; 19:528–36. https://doi.org/10.1080/09537100802320300 [PubMed]
- 9. Doeing DC, Solway J. Airway smooth muscle in the pathophysiology and treatment of asthma. J Appl Physiol (1985). 2013; 114:834–43. https://doi.org/10.1152/japplphysiol.00950.2012 [PubMed]
- 10. Wu Q, Tang Y, Hu X, Wang Q, Lei W, Zhou L, Huang J. Regulation of Th1/Th2 balance through OX40/OX40L signalling by glycyrrhizic acid in a murine model of asthma. Respirology. 2016; 21:102–11. https://doi.org/10.1111/resp.12655 [PubMed]
- 11. Yang C, Wu D, Gao L, Liu X, Jin Y, Wang D, Wang T, Li X. Competing endogenous RNA networks in human cancer: hypothesis, validation, and perspectives. Oncotarget. 2016; 7:13479–90. https://doi.org/10.18632/oncotarget.7266 [PubMed]
- 12. Zech A, Ayata CK, Pankratz F, Meyer A, Baudiß K, Cicko S, Yegutkin GG, Grundmann S, Idzko M. MicroRNA-155 modulates P2R signaling and Th2 priming of dendritic cells during allergic airway inflammation in mice. Allergy. 2015; 70:1121–29. https://doi.org/10.1111/all.12643 [PubMed]
- 13. Liang Z, Tang F. The potency of lncRNA MALAT1/miR-155/CTLA4 axis in altering Th1/Th2 balance of asthma. Biosci Rep. 2020; 40:BSR20190397. https://doi.org/10.1042/BSR20190397 [PubMed]
- 14. Perry MM, Tsitsiou E, Austin PJ, Lindsay MA, Gibeon DS, Adcock IM, Chung KF. Role of non-coding RNAs in maintaining primary airway smooth muscle cells. Respir Res. 2014; 15:58. https://doi.org/10.1186/1465-9921-15-58 [PubMed]
- 15. Austin PJ, Tsitsiou E, Boardman C, Jones SW, Lindsay MA, Adcock IM, Chung KF, Perry MM. Transcriptional profiling identifies the long noncoding RNA plasmacytoma variant translocation (PVT1) as a novel regulator of the asthmatic phenotype in human airway smooth muscle. J Allergy Clin Immunol. 2017; 139:780–89. https://doi.org/10.1016/j.jaci.2016.06.014 [PubMed]
- 16. Schatz M, Rosenwasser L. The allergic asthma phenotype. J Allergy Clin Immunol Pract. 2014; 2:645–48. https://doi.org/10.1016/j.jaip.2014.09.004 [PubMed]
- 17. Pribilla W. [Blood and blood diseases]. Munch Med Wochenschr. 1961; 103:2001–05. [PubMed]
- 18. McConnell R, Berhane K, Gilliland F, London SJ, Islam T, Gauderman WJ, Avol E, Margolis HG, Peters JM. Asthma in exercising children exposed to ozone: a cohort study. Lancet. 2002; 359:386–91. https://doi.org/10.1016/S0140-6736(02)07597-9 [PubMed]
- 19. Moore BD, Hyde D, Miller L, Wong E, Frelinger J, Schelegle ES. Allergen and ozone exacerbate serotonin-induced increases in airway smooth muscle contraction in a model of childhood asthma. Respiration. 2012; 83:529–42. https://doi.org/10.1159/000336835 [PubMed]
- 20. Seltzer J, Bigby BG, Stulbarg M, Holtzman MJ, Nadel JA, Ueki IF, Leikauf GD, Goetzl EJ, Boushey HA. O3-induced change in bronchial reactivity to methacholine and airway inflammation in humans. J Appl Physiol (1985). 1986; 60:1321–26. https://doi.org/10.1152/jappl.1986.60.4.1321 [PubMed]
- 21. Wu D, Tan W, Zhang Q, Zhang X, Song H. Effects of ozone exposure mediated by BEAS-2B cells on T cells activation: a possible link between environment and asthma. Asian Pac J Allergy Immunol. 2014; 32:25–33. [PubMed]
- 22. Fuentes N, Roy A, Mishra V, Cabello N, Silveyra P. Sex-specific microRNA expression networks in an acute mouse model of ozone-induced lung inflammation. Biol Sex Differ. 2018; 9:18. https://doi.org/10.1186/s13293-018-0177-7 [PubMed]
- 23. Chen QZ, Zhou YB, Zhou LF, Fu ZD, Wu YS, Chen Y, Li SN, Huang JR, Li JH. TRPC6 modulates adhesion of neutrophils to airway epithelial cells via NF-κB activation and ICAM-1 expression with ozone exposure. Exp Cell Res. 2019; 377:56–66. https://doi.org/10.1016/j.yexcr.2019.02.013 [PubMed]
- 24. Clay CC, Maniar-Hew K, Gerriets JE, Wang TT, Postlethwait EM, Evans MJ, Fontaine JH, Miller LA. Early life ozone exposure results in dysregulated innate immune function and altered microRNA expression in airway epithelium. PLoS One. 2014; 9:e90401. https://doi.org/10.1371/journal.pone.0090401 [PubMed]
- 25. Li JH, Liu S, Zhou H, Qu LH, Yang JH. starBase v2.0: decoding miRNA-ceRNA, miRNA-ncRNA and protein-RNA interaction networks from large-scale CLIP-seq data. Nucleic Acids Res. 2014; 42:D92–97. https://doi.org/10.1093/nar/gkt1248 [PubMed]
- 26. Vlachos IS, Kostoulas N, Vergoulis T, Georgakilas G, Reczko M, Maragkakis M, Paraskevopoulou MD, Prionidis K, Dalamagas T, Hatzigeorgiou AG. DIANA miRPath v.2.0: investigating the combinatorial effect of microRNAs in pathways. Nucleic Acids Res. 2012; 40:W498–504. https://doi.org/10.1093/nar/gks494 [PubMed]
- 27. Lin HY, Xu L, Xie SS, Yu F, Hu HY, Song XL, Wang CH. Mesenchymal stem cells suppress lung inflammation and airway remodeling in chronic asthma rat model via PI3K/Akt signaling pathway. Int J Clin Exp Pathol. 2015; 8:8958–67. [PubMed]
- 28. Wang J, Li F, Yang M, Wu J, Zhao J, Gong W, Liu W, Bi W, Dong L. FIZZ1 promotes airway remodeling through the PI3K/Akt signaling pathway in asthma. Exp Ther Med. 2014; 7:1265–70. https://doi.org/10.3892/etm.2014.1580 [PubMed]
- 29. Sinclair C, Bommakanti G, Gardinassi L, Loebbermann J, Johnson MJ, Hakimpour P, Hagan T, Benitez L, Todor A, Machiah D, Oriss T, Ray A, Bosinger S, et al. mTOR regulates metabolic adaptation of APCs in the lung and controls the outcome of allergic inflammation. Science. 2017; 357:1014–21. https://doi.org/10.1126/science.aaj2155 [PubMed]
- 30. Zhang Y, Jing Y, Qiao J, Luan B, Wang X, Wang L, Song Z. Activation of the mTOR signaling pathway is required for asthma onset. Sci Rep. 2017; 7:4532. https://doi.org/10.1038/s41598-017-04826-y [PubMed]
- 31. Shao Y, Chong L, Lin P, Li H, Zhu L, Wu Q, Li C. MicroRNA-133a alleviates airway remodeling in asthtama through PI3K/AKT/mTOR signaling pathway by targeting IGF1R. J Cell Physiol. 2019; 234:4068–80. https://doi.org/10.1002/jcp.27201 [PubMed]
- 32. Kramer EL, Hardie WD, Mushaben EM, Acciani TH, Pastura PA, Korfhagen TR, Hershey GK, Whitsett JA, Le Cras TD. Rapamycin decreases airway remodeling and hyperreactivity in a transgenic model of noninflammatory lung disease. J Appl Physiol (1985). 2011; 111:1760–67. https://doi.org/10.1152/japplphysiol.00737.2011 [PubMed]
- 33. Xiao W, Tang H, Wu M, Liao Y, Li K, Li L, Xu X. Ozone oil promotes wound healing by increasing the migration of fibroblasts via PI3K/Akt/mTOR signaling pathway. Biosci Rep. 2017; 37:BSR20170658. https://doi.org/10.1042/BSR20170658 [PubMed]
- 34. Umoh NA, Walker RK, Al-Rubaiee M, Jeffress MA, Haddad GE. Acute alcohol modulates cardiac function as PI3K/Akt regulates oxidative stress. Alcohol Clin Exp Res. 2014; 38:1847–64. https://doi.org/10.1111/acer.12459 [PubMed]
- 35. Kumar RK, Foster PS. Modeling allergic asthma in mice: pitfalls and opportunities. Am J Respir Cell Mol Biol. 2002; 27:267–72. https://doi.org/10.1165/rcmb.F248 [PubMed]
- 36. Matsubara S, Takeda K, Jin N, Okamoto M, Matsuda H, Shiraishi Y, Park JW, McConville G, Joetham A, O’Brien RL, Dakhama A, Born WK, Gelfand EW. Vgamma1+ T cells and tumor necrosis factor-alpha in ozone-induced airway hyperresponsiveness. Am J Respir Cell Mol Biol. 2009; 40:454–63. https://doi.org/10.1165/rcmb.2008-0346OC [PubMed]
- 37. Hamelmann E, Schwarze J, Takeda K, Oshiba A, Larsen GL, Irvin CG, Gelfand EW. Noninvasive measurement of airway responsiveness in allergic mice using barometric plethysmography. Am J Respir Crit Care Med. 1997; 156:766–75. https://doi.org/10.1164/ajrccm.156.3.9606031 [PubMed]
- 38. Knobloch J, Yanik SD, Körber S, Stoelben E, Jungck D, Koch A. TNFα-induced airway smooth muscle cell proliferation depends on endothelin receptor signaling, GM-CSF and IL-6. Biochem Pharmacol. 2016; 116:188–99. https://doi.org/10.1016/j.bcp.2016.07.008 [PubMed]
- 39. Kothapalli D, Zhao L, Hawthorne EA, Cheng Y, Lee E, Puré E, Assoian RK. Hyaluronan and CD44 antagonize mitogen-dependent cyclin D1 expression in mesenchymal cells. J Cell Biol. 2007; 176:535–44. https://doi.org/10.1083/jcb.200611058 [PubMed]
- 40. Kothapalli D, Flowers J, Xu T, Puré E, Assoian RK. Differential activation of ERK and rac mediates the proliferative and anti-proliferative effects of hyaluronan and CD44. J Biol Chem. 2008; 283:31823–29. https://doi.org/10.1074/jbc.M802934200 [PubMed]
- 41. Jain M, He Q, Lee WS, Kashiki S, Foster LC, Tsai JC, Lee ME, Haber E. Role of CD44 in the reaction of vascular smooth muscle cells to arterial wall injury. J Clin Invest. 1996; 98:877. [PubMed]
- 42. Shirakawa T, Enomoto T, Shimazu S, Hopkin JM. The inverse association between tuberculin responses and atopic disorder. Science. 1997; 275:77–79. https://doi.org/10.1126/science.275.5296.77 [PubMed]
- 43. Rengarajan J, Szabo SJ, Glimcher LH. Transcriptional regulation of Th1/Th2 polarization. Immunol Today. 2000; 21:479–83. https://doi.org/10.1016/s0167-5699(00)01712-6 [PubMed]
- 44. Garantziotis S, Li Z, Potts EN, Kimata K, Zhuo L, Morgan DL, Savani RC, Noble PW, Foster WM, Schwartz DA, Hollingsworth JW. Hyaluronan mediates ozone-induced airway hyperresponsiveness in mice. J Biol Chem. 2009; 284:11309–17. https://doi.org/10.1074/jbc.M802400200 [PubMed]
- 45. Williams AS, Issa R, Durham A, Leung SY, Kapoun A, Medicherla S, Higgins LS, Adcock IM, Chung KF. Role of p38 mitogen-activated protein kinase in ozone-induced airway hyperresponsiveness and inflammation. Eur J Pharmacol. 2008; 600:117–22. https://doi.org/10.1016/j.ejphar.2008.09.031 [PubMed]
- 46. Williams AS, Leung SY, Nath P, Khorasani NM, Bhavsar P, Issa R, Mitchell JA, Adcock IM, Chung KF. Role of TLR2, TLR4, and MyD88 in murine ozone-induced airway hyperresponsiveness and neutrophilia. J Appl Physiol (1985). 2007; 103:1189–95. https://doi.org/10.1152/japplphysiol.00172.2007 [PubMed]
- 47. Vagaggini B, Bartoli ML, Cianchetti S, Costa F, Bacci E, Dente FL, Di Franco A, Malagrinò L, Paggiaro P. Increase in markers of airway inflammation after ozone exposure can be observed also in stable treated asthmatics with minimal functional response to ozone. Respir Res. 2010; 11:5. https://doi.org/10.1186/1465-9921-11-5 [PubMed]
- 48. Bosson J, Stenfors N, Bucht A, Helleday R, Pourazar J, Holgate ST, Kelly FJ, Sandström T, Wilson S, Frew AJ, Blomberg A. Ozone-induced bronchial epithelial cytokine expression differs between healthy and asthmatic subjects. Clin Exp Allergy. 2003; 33:777–82. https://doi.org/10.1046/j.1365-2222.2003.01662.x [PubMed]
- 49. Basha MA, Gross KB, Gwizdala CJ, Haidar AH, Popovich J
Jr . Bronchoalveolar lavage neutrophilia in asthmatic and healthy volunteers after controlled exposure to ozone and filtered purified air. Chest. 1994; 106:1757–65. https://doi.org/10.1378/chest.106.6.1757 [PubMed] - 50. Ochs-Balcom HM, Grant BJ, Muti P, Sempos CT, Freudenheim JL, Browne RW, McCann SE, Trevisan M, Cassano PA, Iacoviello L, Schünemann HJ. Antioxidants, oxidative stress, and pulmonary function in individuals diagnosed with asthma or COPD. Eur J Clin Nutr. 2006; 60:991–99. https://doi.org/10.1038/sj.ejcn.1602410 [PubMed]
- 51. Cheng YK, Tsai MH, Lin CD, Hwang GY, Hang LW, Tseng GC, Shen PS, Chang WC. Oxidative stress in nonallergic nasal polyps associated with bronchial hyperresponsiveness. Allergy. 2006; 61:1290–98. https://doi.org/10.1111/j.1398-9995.2006.01228.x [PubMed]
- 52. To T, Stanojevic S, Moores G, Gershon AS, Bateman ED, Cruz AA, Boulet LP. Global asthma prevalence in adults: findings from the cross-sectional world health survey. BMC Public Health. 2012; 12:204. https://doi.org/10.1186/1471-2458-12-204 [PubMed]
- 53. Jia L, Landan G, Pomerantz M, Jaschek R, Herman P, Reich D, Yan C, Khalid O, Kantoff P, Oh W, Manak JR, Berman BP, Henderson BE, et al. Functional enhancers at the gene-poor 8q24 cancer-linked locus. PLoS Genet. 2009; 5:e1000597. https://doi.org/10.1371/journal.pgen.1000597 [PubMed]
- 54. Li T, Meng XL, Yang WQ. Long noncoding RNA PVT1 acts as a “sponge” to inhibit microRNA-152 in gastric cancer cells. Dig Dis Sci. 2017; 62:3021–28. https://doi.org/10.1007/s10620-017-4508-z [PubMed]
- 55. Nakano T, Inoue Y, Shimojo N, Yamaide F, Morita Y, Arima T, Tomiita M, Kohno Y. Lower levels of hsa-mir-15a, which decreases VEGFA, in the CD4+ T cells of pediatric patients with asthma. J Allergy Clin Immunol. 2013; 132:1224–27.e12. https://doi.org/10.1016/j.jaci.2013.06.041 [PubMed]
- 56. Liu X, Wang L, Li H, Lu X, Hu Y, Yang X, Huang C, Gu D. Coactivator-associated arginine methyltransferase 1 targeted by miR-15a regulates inflammation in acute coronary syndrome. Atherosclerosis. 2014; 233:349–56. https://doi.org/10.1016/j.atherosclerosis.2014.01.039 [PubMed]
- 57. He Z, Liao Z, Chen S, Li B, Yu Z, Luo G, Yang L, Zeng C, Li Y. Downregulated miR-17, miR-29c, miR-92a and miR-214 may be related to BCL11B overexpression in T cell acute lymphoblastic leukemia. Asia Pac J Clin Oncol. 2018; 14:e259–65. https://doi.org/10.1111/ajco.12979 [PubMed]
- 58. Zhang X, Zhao X, Sun H, Yan Y, Huang L, Gu W, Jiang W, Wang Y, Zhu C, Ji W, Hao C, Chen Z. The role of miR-29c/B7-H3 axis in children with allergic asthma. J Transl Med. 2018; 16:218. https://doi.org/10.1186/s12967-018-1590-8 [PubMed]
- 59. Yoo JK, Kim J, Choi SJ, Noh HM, Kwon YD, Yoo H, Yi HS, Chung HM, Kim JK. Discovery and characterization of novel microRNAs during endothelial differentiation of human embryonic stem cells. Stem Cells Dev. 2012; 21:2049–57. https://doi.org/10.1089/scd.2011.0500 [PubMed]
- 60. Bang C, Fiedler J, Thum T. Cardiovascular importance of the microRNA-23/27/24 family. Microcirculation. 2012; 19:208–14. https://doi.org/10.1111/j.1549-8719.2011.00153.x [PubMed]
- 61. Jakob P, Landmesser U. Role of microRNAs in stem/progenitor cells and cardiovascular repair. Cardiovasc Res. 2012; 93:614–22. https://doi.org/10.1093/cvr/cvr311 [PubMed]
- 62. Liu F, Lou YL, Wu J, Ruan QF, Xie A, Guo F, Cui SP, Deng ZF, Wang Y. Upregulation of microRNA-210 regulates renal angiogenesis mediated by activation of VEGF signaling pathway under ischemia/perfusion injury in vivo and in vitro. Kidney Blood Press Res. 2012; 35:182–91. https://doi.org/10.1159/000331054 [PubMed]
- 63. Mun J, Tam C, Chan G, Kim JH, Evans D, Fleiszig S. MicroRNA-762 is upregulated in human corneal epithelial cells in response to tear fluid and pseudomonas aeruginosa antigens and negatively regulates the expression of host defense genes encoding RNase7 and ST2. PLoS One. 2013; 8:e57850. https://doi.org/10.1371/journal.pone.0057850 [PubMed]
- 64. Condliffe AM, Cadwallader KA, Walker TR, Rintoul RC, Cowburn AS, Chilvers ER. Phosphoinositide 3-kinase: a critical signalling event in pulmonary cells. Respir Res. 2000; 1:24–29. https://doi.org/10.1186/rr8 [PubMed]
- 65. Ward SG, Finan P. Isoform-specific phosphoinositide 3-kinase inhibitors as therapeutic agents. Curr Opin Pharmacol. 2003; 3:426–34. https://doi.org/10.1016/s1471-4892(03)00078-x [PubMed]
- 66. Arimura Y, Shiroki F, Kuwahara S, Kato H, Dianzani U, Uchiyama T, Yagi J. Akt is a neutral amplifier for th cell differentiation. J Biol Chem. 2004; 279:11408–16. https://doi.org/10.1074/jbc.M309063200 [PubMed]
- 67. Scott PH, Belham CM, al-Hafidh J, Chilvers ER, Peacock AJ, Gould GW, Plevin R. A regulatory role for cAMP in phosphatidylinositol 3-kinase/p70 ribosomal S6 kinase-mediated DNA synthesis in platelet-derived-growth-factor-stimulated bovine airway smooth-muscle cells. Biochem J. 1996; 318:965–71. https://doi.org/10.1042/bj3180965 [PubMed]
- 68. Follo MY, Manzoli L, Poli A, McCubrey JA, Cocco L. PLC and PI3K/Akt/mTOR signalling in disease and cancer. Adv Biol Regul. 2015; 57:10–16. https://doi.org/10.1016/j.jbior.2014.10.004 [PubMed]
- 69. Yu Q, Chen X, Fang X, Chen Q, Hu C. Caveolin-1 aggravates cigarette smoke extract-induced MUC5AC secretion in human airway epithelial cells. Int J Mol Med. 2015; 35:1435–42. https://doi.org/10.3892/ijmm.2015.2133 [PubMed]
- 70. Aubier M, Thabut G, Hamidi F, Guillou N, Brard J, Dombret MC, Borensztajn K, Aitilalne B, Poirier I, Roland-Nicaise P, Taillé C, Pretolani M. Airway smooth muscle enlargement is associated with protease-activated receptor 2/ligand overexpression in patients with difficult-to-control severe asthma. J Allergy Clin Immunol. 2016; 138:729–39.e11. https://doi.org/10.1016/j.jaci.2015.12.1332 [PubMed]
- 71. Dragon S, Hirst SJ, Lee TH, Gounni AS. IL-17A mediates a selective gene expression profile in asthmatic human airway smooth muscle cells. Am J Respir Cell Mol Biol. 2014; 50:1053–63. https://doi.org/10.1165/rcmb.2012-0267OC [PubMed]
- 72. Abdelfattah NS, Amgad M, Zayed AA, Hussein H, Abd El-Baky N. Molecular underpinnings of corneal angiogenesis: advances over the past decade. Int J Ophthalmol. 2016; 9:768–79. https://doi.org/10.18240/ijo.2016.05.24 [PubMed]
- 73. Weisel CP, Cody RP, Lioy PJ. Relationship between summertime ambient ozone levels and emergency department visits for asthma in central new jersey. Environ Health Perspect. 1995 (Suppl 2); 103:97–102. https://doi.org/10.1289/ehp.95103s297 [PubMed]
- 74. Palecek F, Palecekova M, Aviado DM. Emphysema in immature rats. Condition produced by tracheal constriction and papain. Arch Environ Health. 1967; 15:332–42. https://doi.org/10.1080/00039896.1967.10664929 [PubMed]
- 75. Association RBoCM. Guidelines for Prevention and Treatment of Bronchial Asthma. Chinese Journal of Tuberculosis and Respiratory Diseases. 1997; 20:261–7.