


Introduction
In recent years, the incidence of thyroid cancer (TC) has increased sharply at an annual rate of 3%. Thus, 40,170 new cases of TC are expected in the US in 2020, accounting for approximately 4% of all cancer cases in women [1, 2]. Papillary thyroid carcinoma (PTC) accounts for 83.6% of all TC cases [3]. PTC patients usually have a relatively good prognosis, with a long-term survival rate of 90-95% after surgery or radioiodine therapy; however, the subset of patients who develop local invasion or distant metastasis may be at greater risk of recurrence or death [3]. Lymph node metastasis (LNM) occurs in about 10-50% of PTC patients, and Wada et al. reported that the recurrence rates were 16.3% and 0% in patients with and without LNM, respectively [4, 5]. The overall survival rate of patients with local recurrence is about 70-85%, while the long-term survival rate of patients with distant metastasis is 30-60% [6–9]. Therefore, it is extremely important to identify biomarkers that can discriminate between high-risk and low-risk PTC patients.
The B-type Raf Kinase (BRAF) V600E mutation has been found in about 50% of PTC patients, particularly those with the aggressive subtype [10, 11]. In some studies, the BRAF V600E mutation has been associated with poorer clinicopathological outcomes of PTC [12, 13]; however, several studies have demonstrated that the BRAF V600E status alone is not an adequate prognostic biomarker of PTC [14–16]. The synergistic effects of BRAF V600E mutations and Telomerase Reverse Transcriptase promoter mutations are thought to generate more aggressive clinical characteristics and worse prognoses than the individual mutations in PTC patients [17, 18]. Mutations in RAS, RET and PIK3CA (Phosphatidylinositol-4,5-Bisphosphate 3-Kinase Catalytic Subunit Alpha) have also been observed in PTC [19, 20]. Based on genomic, epigenomic and proteomic profiling, PTC can be classified as BRAFV600E-like or RAS-like. BRAFV600E-like PTC (driven by BRAFV600E) cannot respond to negative feedback from Extracellular Signal-Regulated Kinase (ERK) to RAF, so Mitogen-Activated Protein Kinase (MAPK) signaling is hyperactivated. On the other hand, RAS-like PTC (driven by RAS and Receptor Tyrosine Kinase fusions) accepts feedback from ERK, and thus exhibits aberrant activation of Phosphoinositide 3-Kinase signaling and lower MAPK activity than BRAFV600E-like PTC [21]. Despite tremendous progress in TC research, many molecular characteristics of TC are not well understood, so further study on the tumorigenesis and progression of TC is needed.
Ion channels of the plasma membrane are known to be involved in various cancers [22]. For example, Potassium Voltage-Gated Channel Subfamily H Member 1 is associated with a poor prognosis in ovarian cancer [23], and Piezo Type Mechanosensitive Ion Channel Component 1 promotes prostate cancer proliferation by activating the Akt/Mammalian Target of Rapamycin pathway [24]. Regarding thyroid cancer, Voltage Dependent Anion Channel 2 improves the viability of PTC cell lines [25], whereas Sodium Voltage-Gated Channel Beta Subunit 4 is an independent indicator of enhanced recurrence-free survival in PTC patients [26]. Thus, ion channels may have essential functions in PTC.
The Potassium Calcium-Activated Channel Subfamily N (KCNN) family includes four proteins (KCNN1-KCNN4) that constitute a heterotetrameric voltage-independent potassium channel. The KCNNs are involved in various cancers: low KCNN3 expression promotes drug resistance and may predict a poor prognosis in ovarian cancer [27], high KCNN4 expression is associated with poor survival in pancreatic cancer patients [28], and KCNN2 is overexpressed in proximal tumors compared to distal tumors in colorectal cancer [29]. However, the involvement of the KCNN family in TC is still unknown.
In the present study, we examined KCNN4 expression in PTC tissues using various online datasets and our own locally validated data. We also analyzed the diagnostic and prognostic value of KCNN4 expression and its relationship with the clinicopathological features of PTC. Finally, we performed loss-of-function assays to explore the function of KCNN4 in PTC cell lines. Our work suggests that KCNN4 may be an essential biomarker and tumor promoter in PTC.
Results
KCNN4 is significantly upregulated in PTC
To analyze the expression of the four KCNN family members in PTC, we downloaded transcriptome sequencing data and microarray data from The Cancer Genome Atlas (TCGA) and GSE58689, respectively. Only KCNN4 was significantly overexpressed in tumor tissues compared to nontumorous thyroid tissues (Figure 1A). Furthermore, we mined the differentially expressed genes between PTC tissues and adjacent normal tissues in the GSE3678 and GSE9115 datasets. After data normalization, 90 and 100 differentially expressed genes were extracted from GSE3678 and GSE9115, respectively (adjusted p-value < 0.05 and log2|fold change| ≥ 2). As shown in the heatmap (Figure 1B), KCNN4 was markedly upregulated in PTC tissues among the top 50 significantly differentially expressed genes in both datasets, based on the adjusted p-value (GSE3678: KCNN4, log2|fold change|=2.30, false discovery rate [FDR]=8.40×10⁻⁵; GSE9115: KCNN4, log2|fold change|=3.73, FDR=0.01). Next, the Tumor IMmune Estimation Resource (TIMER) database was used to perform a pan-cancer analysis of KCNN4 expression. The results indicated that KCNN4 was upregulated in various cancers in TCGA (Figure 1C).
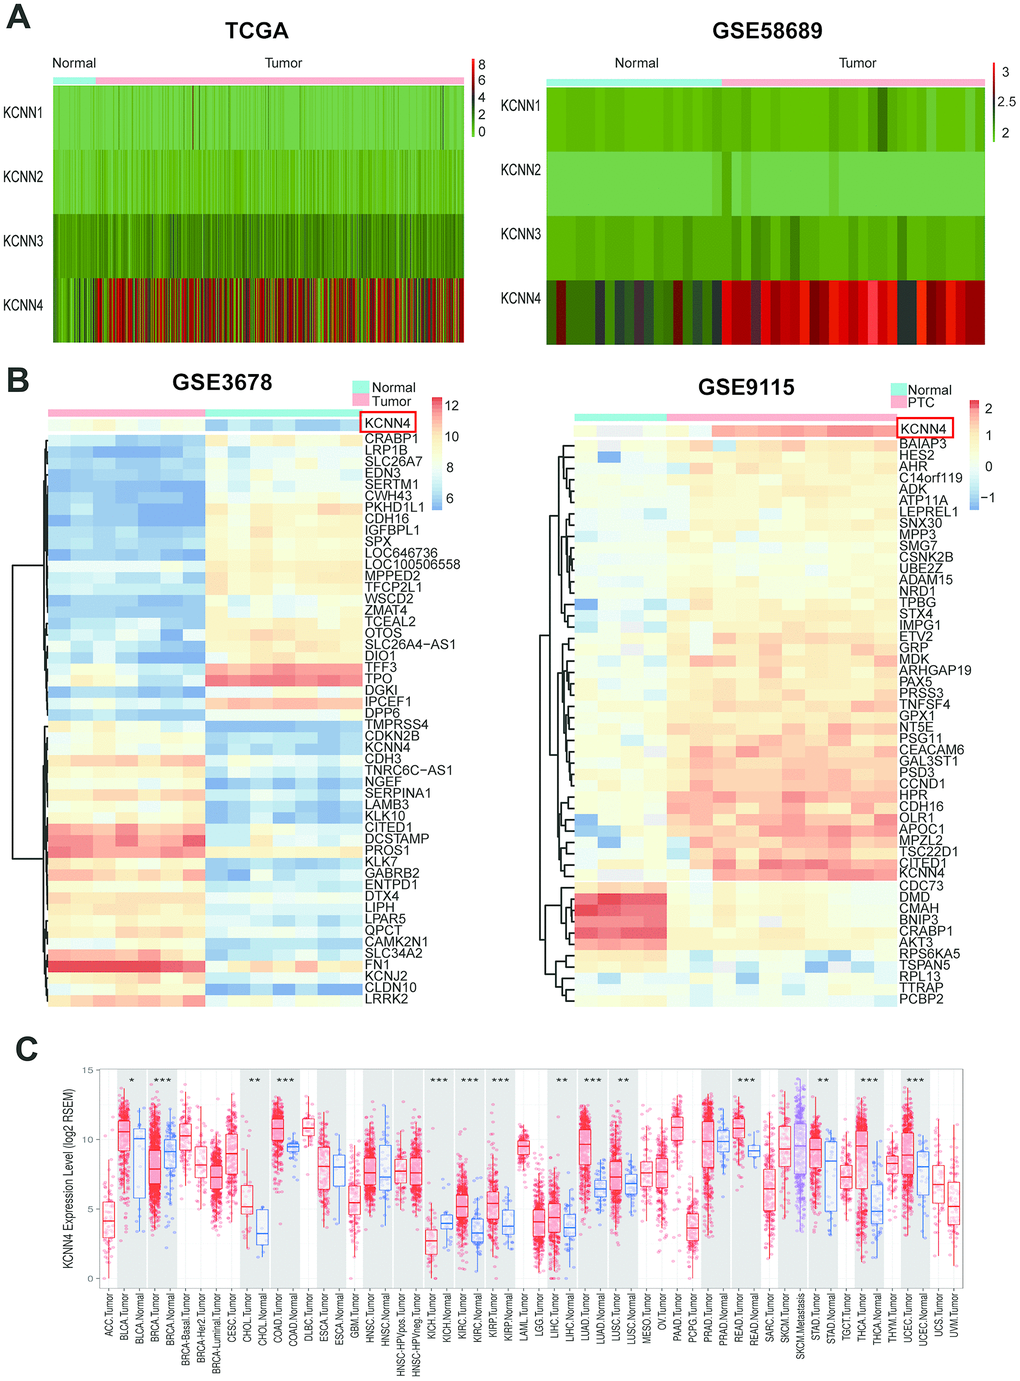
Figure 1. KCNN4 was differentially expressed in PTC and most other cancers. (A) The expression of the KCNN family in PTC was assessed using data from TCGA and GSE58689. (B) Heatmap of the top 50 significantly differentially expressed genes in GSE3678 and GSE9115, based on the adjusted p-value. (C) KCNN4 was overexpressed in multiple cancers in TCGA. The statistical significance of differential expression was evaluated using the Wilcoxon test. *p<0.05, **p<0.01, ***p<0.001. ACC: Adrenocortical carcinoma; BLCA: Bladder urothelial carcinoma; BRCA: Breast invasive carcinoma; CESC: Cervical squamous cell carcinoma and endocervical adenocarcinoma; CHOL: Cholangiocarcinoma; COAD: Colon adenocarcinoma; DLBC: Lymphoid neoplasm diffuse large B-cell lymphoma; ESCA: Esophageal carcinoma; GBM: Glioblastoma multiforme; HNSC: Head and neck squamous cell carcinoma; KICH: Kidney chromophobe; KIRC: Kidney renal clear cell carcinoma; KIRP: Kidney renal papillary cell carcinoma; LAML: Acute myeloid leukemia; LGG: Brain lower grade glioma; LIHC: Liver hepatocellular carcinoma; LUAD: Lung adenocarcinoma; LUSC: Lung squamous cell carcinoma; MESO: Mesothelioma; OV: Ovarian serous cystadenocarcinoma; PAAD: Pancreatic adenocarcinoma; PCPG: Pheochromocytoma and paraganglioma; PRAD: Prostate adenocarcinoma; READ: Rectum adenocarcinoma; SARC: Sarcoma; SKCM: Skin cutaneous melanoma; STAD: Stomach adenocarcinoma; TGCT: Testicular germ cell tumor; THCA: Thyroid carcinoma; THYM: Thymoma; UCEC: Uterine corpus endometrial carcinoma; UCS: Uterine carcinosarcoma; UVM: Uveal melanoma.
The mRNA levels of KCNN4 in TC tissues and adjacent nontumorous tissues in the aforementioned databases are shown in Figure 2A–2D (GSE58689: PTC tissues 7.21 ± 1.24, Normal tissues 4.25 ± 0.74, p<0.0001; GSE3678: PTC tissues 270.8 ± 123.5, Normal tissues 52.50 ± 19.48, p<0.01; GSE9155: PTC tissues 2.92 ± 1.50, Normal tissues -0.70 ± 1.11, p<0.01; TCGA: PTC tissues 48.82 ± 51.50, Normal tissues 4.44 ± 6.13, p<0.0001). We also performed RNA sequencing on 70 pairs of PTC tissues and matched adjacent nontumorous tissues, and observed the same trend (Figure 2E; PTC tissues 1868 ± 1127, Normal tissues 197.3 ± 245.3, p<0.0001). Furthermore, we used quantitative real-time PCR (qRT-PCR) to analyze KCNN4 expression in 42 pairs of PTC tissues and matched normal thyroid tissues (validated cohort). As expected, KCNN4 mRNA levels were significantly greater in PTC tissues than in normal thyroid tissues (Figure 2F; PTC tissues 12.59 ± 7.26, Normal tissues 1.90 ± 3.44, p<0.0001). These findings demonstrated that KCNN4 was overexpressed in PTC tissues.
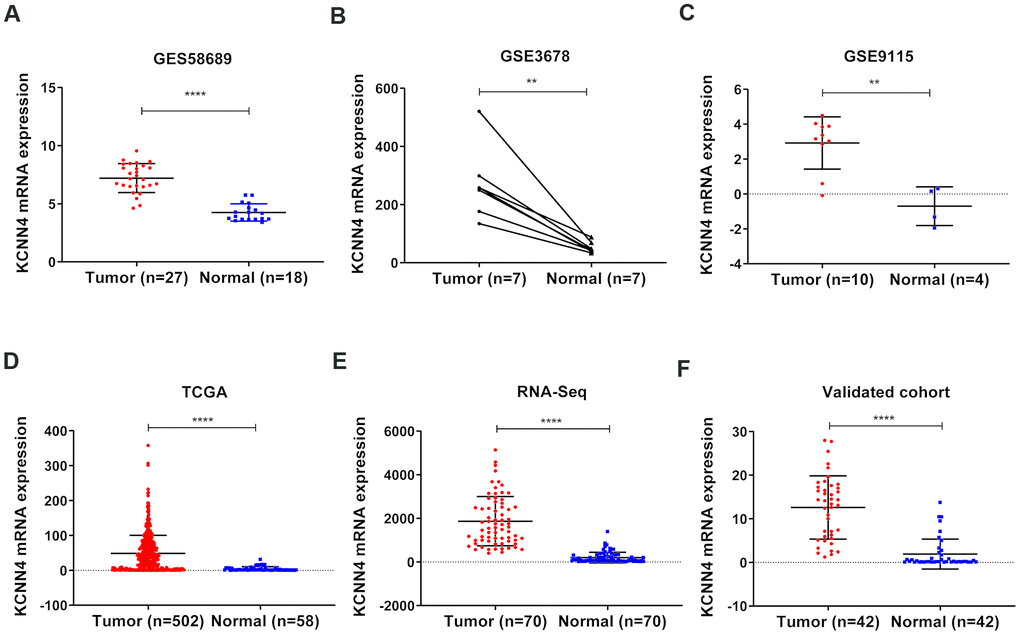
Figure 2. KCNN4 was overexpressed in PTC. (A–D) KCNN4 mRNA levels were greater in PTC tissues than in normal thyroid tissues in GSE58689, GSE3678, GSE9115 and TCGA. (E) KCNN4 was upregulated in 70 PTC tissues compared with matched adjacent nontumorous thyroid tissues from our RNA sequencing dataset. (F) The overexpression of KCNN4 in PTC was verified in our validated cohort using qRT-PCR. Statistical analyses were performed as follows: (A, C, D): Mann-Whitney test; (B): Paired t-test; (E, F): Wilcoxon test. **p<0.01, ****p<0.0001.
KCNN4 overexpression is associated with a range of clinicopathological factors in PTC
Next, we evaluated the correlation between KCNN4 expression and clinical features of PTC in TCGA and our validated cohort. Patients were split into two groups based on the median KCNN4 level. In the cohort from TCGA, higher KCNN4 expression was associated with a higher T stage (p=0.001), a greater incidence of LNM (p<0.0001), a more advanced disease stage (p=0.001) and a higher frequency of the classical type (p<0.0001) (Table 1). In our validated cohort, KCNN4 expression also correlated significantly with the tumor size (p=0.028), LNM (p<0.030) and disease stage (p=0.009) (Table 2).
Table 1. Correlation between KCNN4 expression and clinicopathologic factors in the TCGA cohort.
| Clinicopathologic factors | Patients | High expression | Low expression | p-value | |||||||||||||||||||||||||||||||||||||||||||||||||||||||||||||||||||||||||||||||||||||||||||||||
| Gender | |||||||||||||||||||||||||||||||||||||||||||||||||||||||||||||||||||||||||||||||||||||||||||||||||||
| Female | 367 | 180 | 187 | 0.546 | |||||||||||||||||||||||||||||||||||||||||||||||||||||||||||||||||||||||||||||||||||||||||||||||
| Male | 135 | 71 | 64 | ||||||||||||||||||||||||||||||||||||||||||||||||||||||||||||||||||||||||||||||||||||||||||||||||
| Age (years) | |||||||||||||||||||||||||||||||||||||||||||||||||||||||||||||||||||||||||||||||||||||||||||||||||||
| <60 | 389 | 196 | 193 | 0.831 | |||||||||||||||||||||||||||||||||||||||||||||||||||||||||||||||||||||||||||||||||||||||||||||||
| ≥60 | 113 | 55 | 58 | ||||||||||||||||||||||||||||||||||||||||||||||||||||||||||||||||||||||||||||||||||||||||||||||||
| Histological type | |||||||||||||||||||||||||||||||||||||||||||||||||||||||||||||||||||||||||||||||||||||||||||||||||||
| Classical | 356 | 203 | 153 | <0.0001* | |||||||||||||||||||||||||||||||||||||||||||||||||||||||||||||||||||||||||||||||||||||||||||||||
| Other types | 146 | 48 | 98 | ||||||||||||||||||||||||||||||||||||||||||||||||||||||||||||||||||||||||||||||||||||||||||||||||
| Neoplasm focus type | |||||||||||||||||||||||||||||||||||||||||||||||||||||||||||||||||||||||||||||||||||||||||||||||||||
| Unifocal | 266 | 135 | 131 | 0.928 | |||||||||||||||||||||||||||||||||||||||||||||||||||||||||||||||||||||||||||||||||||||||||||||||
| Multifocal | 226 | 113 | 113 | ||||||||||||||||||||||||||||||||||||||||||||||||||||||||||||||||||||||||||||||||||||||||||||||||
| T stage | |||||||||||||||||||||||||||||||||||||||||||||||||||||||||||||||||||||||||||||||||||||||||||||||||||
| I+II | 307 | 135 | 172 | 0.001* | |||||||||||||||||||||||||||||||||||||||||||||||||||||||||||||||||||||||||||||||||||||||||||||||
| III+IV | 193 | 114 | 79 | ||||||||||||||||||||||||||||||||||||||||||||||||||||||||||||||||||||||||||||||||||||||||||||||||
| Lymph node metastasis | |||||||||||||||||||||||||||||||||||||||||||||||||||||||||||||||||||||||||||||||||||||||||||||||||||
| Yes | 222 | 150 | 72 | <0.0001* | |||||||||||||||||||||||||||||||||||||||||||||||||||||||||||||||||||||||||||||||||||||||||||||||
| No | 229 | 83 | 146 | ||||||||||||||||||||||||||||||||||||||||||||||||||||||||||||||||||||||||||||||||||||||||||||||||
| Disease stage(AJCC7) | |||||||||||||||||||||||||||||||||||||||||||||||||||||||||||||||||||||||||||||||||||||||||||||||||||
| I+II | 333 | 149 | 184 | 0.001* | |||||||||||||||||||||||||||||||||||||||||||||||||||||||||||||||||||||||||||||||||||||||||||||||
| III+IV | 167 | 101 | 66 | ||||||||||||||||||||||||||||||||||||||||||||||||||||||||||||||||||||||||||||||||||||||||||||||||
| New event | |||||||||||||||||||||||||||||||||||||||||||||||||||||||||||||||||||||||||||||||||||||||||||||||||||
| Yes | 44 | 27 | 17 | 0.155 | |||||||||||||||||||||||||||||||||||||||||||||||||||||||||||||||||||||||||||||||||||||||||||||||
| No | 458 | 224 | 234 | ||||||||||||||||||||||||||||||||||||||||||||||||||||||||||||||||||||||||||||||||||||||||||||||||
| Note: *p-value< 0.05. | |||||||||||||||||||||||||||||||||||||||||||||||||||||||||||||||||||||||||||||||||||||||||||||||||||
| Abbreviations: KCNN4, Potassium calcium-activated channel subfamily N member 4; TCGA, The Cancer Genome Atlas; AJCC7, American Joint Committee on Cancer 7th edition. | |||||||||||||||||||||||||||||||||||||||||||||||||||||||||||||||||||||||||||||||||||||||||||||||||||
Table 2. Correlation between KCNN4 expression and clinicopathologic factors in the validated cohort.
| Clinicopathologic factors | Patients | High expression | Low expression | p-value | |||||||||||||||||||||||||||||||||||||||||||||||||||||||||||||||||||||||||||||||||||||||||||||||
| Gender | |||||||||||||||||||||||||||||||||||||||||||||||||||||||||||||||||||||||||||||||||||||||||||||||||||
| Female | 23 | 13 | 10 | 0.352 | |||||||||||||||||||||||||||||||||||||||||||||||||||||||||||||||||||||||||||||||||||||||||||||||
| Male | 19 | 8 | 11 | ||||||||||||||||||||||||||||||||||||||||||||||||||||||||||||||||||||||||||||||||||||||||||||||||
| Age (years) | |||||||||||||||||||||||||||||||||||||||||||||||||||||||||||||||||||||||||||||||||||||||||||||||||||
| ≥55 | 15 | 8 | 7 | 0.747 | |||||||||||||||||||||||||||||||||||||||||||||||||||||||||||||||||||||||||||||||||||||||||||||||
| <55 | 27 | 13 | 14 | ||||||||||||||||||||||||||||||||||||||||||||||||||||||||||||||||||||||||||||||||||||||||||||||||
| Tumor size (mm) | |||||||||||||||||||||||||||||||||||||||||||||||||||||||||||||||||||||||||||||||||||||||||||||||||||
| ≥10 | 25 | 16 | 9 | 0.028* | |||||||||||||||||||||||||||||||||||||||||||||||||||||||||||||||||||||||||||||||||||||||||||||||
| <10 | 17 | 5 | 12 | ||||||||||||||||||||||||||||||||||||||||||||||||||||||||||||||||||||||||||||||||||||||||||||||||
| Lymph node metastasis | |||||||||||||||||||||||||||||||||||||||||||||||||||||||||||||||||||||||||||||||||||||||||||||||||||
| Yes | 23 | 15 | 8 | 0.030* | |||||||||||||||||||||||||||||||||||||||||||||||||||||||||||||||||||||||||||||||||||||||||||||||
| No | 19 | 6 | 13 | ||||||||||||||||||||||||||||||||||||||||||||||||||||||||||||||||||||||||||||||||||||||||||||||||
| Neoplasm focus type | |||||||||||||||||||||||||||||||||||||||||||||||||||||||||||||||||||||||||||||||||||||||||||||||||||
| Multifocal | 8 | 3 | 5 | 0.697 | |||||||||||||||||||||||||||||||||||||||||||||||||||||||||||||||||||||||||||||||||||||||||||||||
| Unifocal | 34 | 18 | 16 | ||||||||||||||||||||||||||||||||||||||||||||||||||||||||||||||||||||||||||||||||||||||||||||||||
| Disease stage(AJCC7) | |||||||||||||||||||||||||||||||||||||||||||||||||||||||||||||||||||||||||||||||||||||||||||||||||||
| III+IV | 14 | 11 | 3 | 0.009* | |||||||||||||||||||||||||||||||||||||||||||||||||||||||||||||||||||||||||||||||||||||||||||||||
| I+II | 24 | 10 | 18 | ||||||||||||||||||||||||||||||||||||||||||||||||||||||||||||||||||||||||||||||||||||||||||||||||
| Note: *p-value< 0.05. | |||||||||||||||||||||||||||||||||||||||||||||||||||||||||||||||||||||||||||||||||||||||||||||||||||
| Abbreviations: KCNN4, Potassium calcium-activated channel subfamily N member 4; AJCC7, American Joint Committee on Cancer 7th edition. | |||||||||||||||||||||||||||||||||||||||||||||||||||||||||||||||||||||||||||||||||||||||||||||||||||
Then we evaluated KCNN4 expression in PTC patients with different tumor grades, stages, subtypes and mutations in TCGA. As illustrated in Figure 3A–3C, most patients with higher T stages, N stages and disease stages had higher mRNA levels of KCNN4. In a subtype analysis, KCNN4 levels were significantly greater in the classical and columnar variant subtypes than in the follicular subtype (Figure 3D). We also divided patients according to their driver mutation status, and found that KCNN4 expression was significantly greater in the BRAF mutation group (Figure 3E, p<0.0001), the RAS wild-type group (Figure 3F, p<0.0001) and the RET fusion group (Figure 3G, p<0.0001) than in their respective counterpart groups. KCNN4 expression was also significantly greater in the BRAF-like group than in the RAS-like group (Figure 3H; BRAF-like: 68.63 ± 51.57, RAS-like: 4.36 ± 14.22, p<0.0001). Thus, KCNN4 expression was associated with many clinicopathological features of PTC.
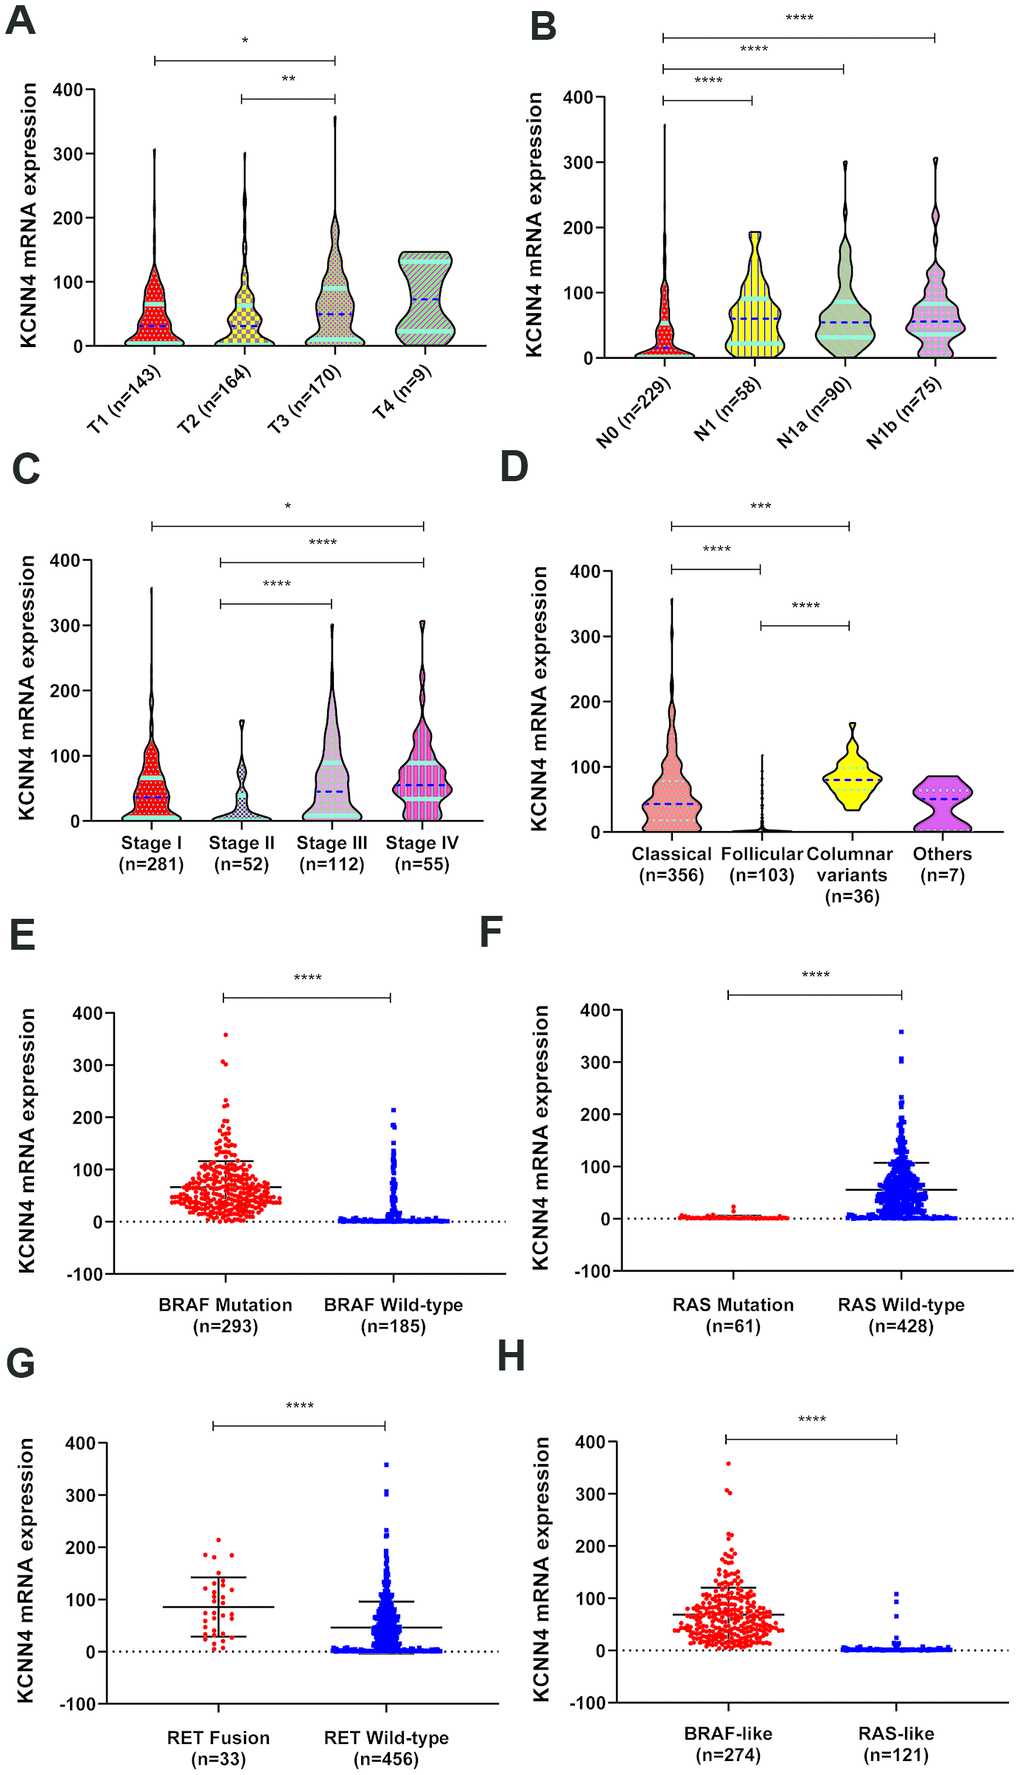
Figure 3. The relationship between KCNN4 expression and clinicopathological characteristics of PTC. (A–C) KCNN4 expression varied according to the T stage, N stage and tumor stage. Higher KCNN4 expression tended to be associated with worse clinicopathological features. (D) The expression of KCNN4 in different subtypes of PTC. KCNN4 was significantly upregulated in the columnar variant subtype and the classical subtype compared to the follicular subtype. (E) KCNN4 expression was significantly higher in the BRAF mutation group than in the BRAF wild-type group. (F) KCNN4 expression was significantly higher in the RAS wild-type group than in the RAS mutation group. (G) KCNN4 expression was significantly higher in the RET fusion group than in the RET wild-type group. (H) KCNN4 expression was higher in the BRAF-like group than in the RAS-like group. Statistical analyses were performed as follows: A-D: Kruskal-Wallis test; E-H: Mann-Whitney test. *p<0.05, **p<0.01, ***p<0.001, ****p<0.0001.
The upregulation of KCNN4 increases the risk of LNM in PTC
To examine whether high KCNN4 expression is a major risk factor for LNM in PTC, we constructed regression models using data from TCGA (Table 3). Univariate logistic regression demonstrated that high KCNN4 expression (odds ratio [OR]=3.665, 95% confidence interval [CI]: 2.483-5.409, p<0.001), female (OR=0.640, 95% CI: 0.422-0.972, p=0.036), disease stage III/IV (OR=3.524, 95% CI: 2.336-5.316, p<0.001), T stage III/IV (OR=2.688, 95% CI: 1.830-3.970, p<0.001) and classical type (OR=2.370, 95% CI: 1.535-3.660, p<0.001) were associated with the risk of LNM. Multivariate logistic regression indicated that high KCNN4 expression (OR=2.914, 95% CI: 1.925-4.411, p<0.001), disease stage III/IV (OR=2.708, 95% CI: 1.656-4.428, p<0.001), T stage III/IV (OR=1.703, 95% CI: 1.054-2.753, p=0.030) and classical type (OR=2.506, 95% CI: 1.528-4.110, p<0.001) were associated with the risk of LNM, whereas gender was excluded from the model (OR=0.770, 95% CI: 0.482-1.229, p=0.274). These data indicated that elevated KCNN4 expression increased the risk of LNM.
Table 3. Univariate and multivariate logistic regression for the risk of lymph node metastasis in the TCGA cohort.
| Factors | Univariate analysis | Multivariate analysis | |||||||||||||||||||||||||||||||||||||||||||||||||||||||||||||||||||||||||||||||||||||||||||||||||
| OR | 95% CI | p-value | OR | 95% CI | p-value | ||||||||||||||||||||||||||||||||||||||||||||||||||||||||||||||||||||||||||||||||||||||||||||||
| KCNN4 expression (high vs. low) | 3.665 | 2.483-5.409 | <0.001* | 2.914 | 1.925-4.411 | <0.001* | |||||||||||||||||||||||||||||||||||||||||||||||||||||||||||||||||||||||||||||||||||||||||||||
| Age (>60 vs. <60) | 0.653 | 0.416-1.024 | 0.063 | - | |||||||||||||||||||||||||||||||||||||||||||||||||||||||||||||||||||||||||||||||||||||||||||||||
| Gender (female vs. male) | 0.640 | 0.422-0.972 | 0.036* | 0.770 | 0.482-1.229 | 0.274 | |||||||||||||||||||||||||||||||||||||||||||||||||||||||||||||||||||||||||||||||||||||||||||||
| Disease stage (III,IV vs. I,II) | 3.524 | 2.336-5.316 | <0.001* | 2.708 | 1.656-4.428 | <0.001* | |||||||||||||||||||||||||||||||||||||||||||||||||||||||||||||||||||||||||||||||||||||||||||||
| T stage (III,IV vs. I,II) | 2.688 | 1.820-3.970 | <0.001* | 1.703 | 1.054-2.753 | 0.03* | |||||||||||||||||||||||||||||||||||||||||||||||||||||||||||||||||||||||||||||||||||||||||||||
| New event | 1.893 | 0.974-3.678 | 0.060 | - | |||||||||||||||||||||||||||||||||||||||||||||||||||||||||||||||||||||||||||||||||||||||||||||||
| Neoplasm focus type (Mul vs. Uni) | 1.433 | 0.985-2.086 | 0.060 | - | |||||||||||||||||||||||||||||||||||||||||||||||||||||||||||||||||||||||||||||||||||||||||||||||
| Histological type (classical vs. others) | 2.370 | 1.535-3.660 | <0.001* | 2.506 | 1.528-4.110 | <0.001* | |||||||||||||||||||||||||||||||||||||||||||||||||||||||||||||||||||||||||||||||||||||||||||||
| Note: *p-value< 0.05. | |||||||||||||||||||||||||||||||||||||||||||||||||||||||||||||||||||||||||||||||||||||||||||||||||||
| Abbreviations: KCNN4, Potassium calcium-activated channel subfamily N member 4; TCGA, The Cancer Genome Atlas; OR, Odds ratio; CI, Confidence interval. | |||||||||||||||||||||||||||||||||||||||||||||||||||||||||||||||||||||||||||||||||||||||||||||||||||
The diagnostic and prognostic value of KCNN4 in PTC patients
Next, we used receiver operating characteristic (ROC) curves to examine the diagnostic significance of KCNN4 expression in TCGA, GSE58689 and our validated cohort. KCNN4 expression distinguished between PTC tissues and normal tissues with an area under the ROC curve (AUC) of 81.4% (95% CI: 77.6-85.2%, p<0.0001) in TCGA, 93.5% (95% CI: 88.7-98.3%, p=0.024) in our validated cohort and 97.7% (95% CI: 94.4-100%, p<0.0001) in GSE58689 (Figure 4A). In TCGA, KCNN4 also had diagnostic value for the T stage, with an AUC of 61.1% (95% CI: 55.9-66.3%, p<0.0001) (Figure 4B). For LNM, the AUC was 71.0% (95% CI: 66.2-75.8%, p<0.0001) in TCGA and 76.7% (95% CI: 61.7-91.7%, p=0.003) in our validated cohort (Figure 4C). The AUC for distinguishing tumor stage (I + II) / (III + IV) was 61.2% (95% CI: 56.0-66.5%, p<0.0001) in TCGA and 74.2% (95% CI: 59.4-89.1%, p=0.011) in our validated cohort (Figure 4D). These findings suggested that KCNN4 expression may have diagnostic value for PTC patients.
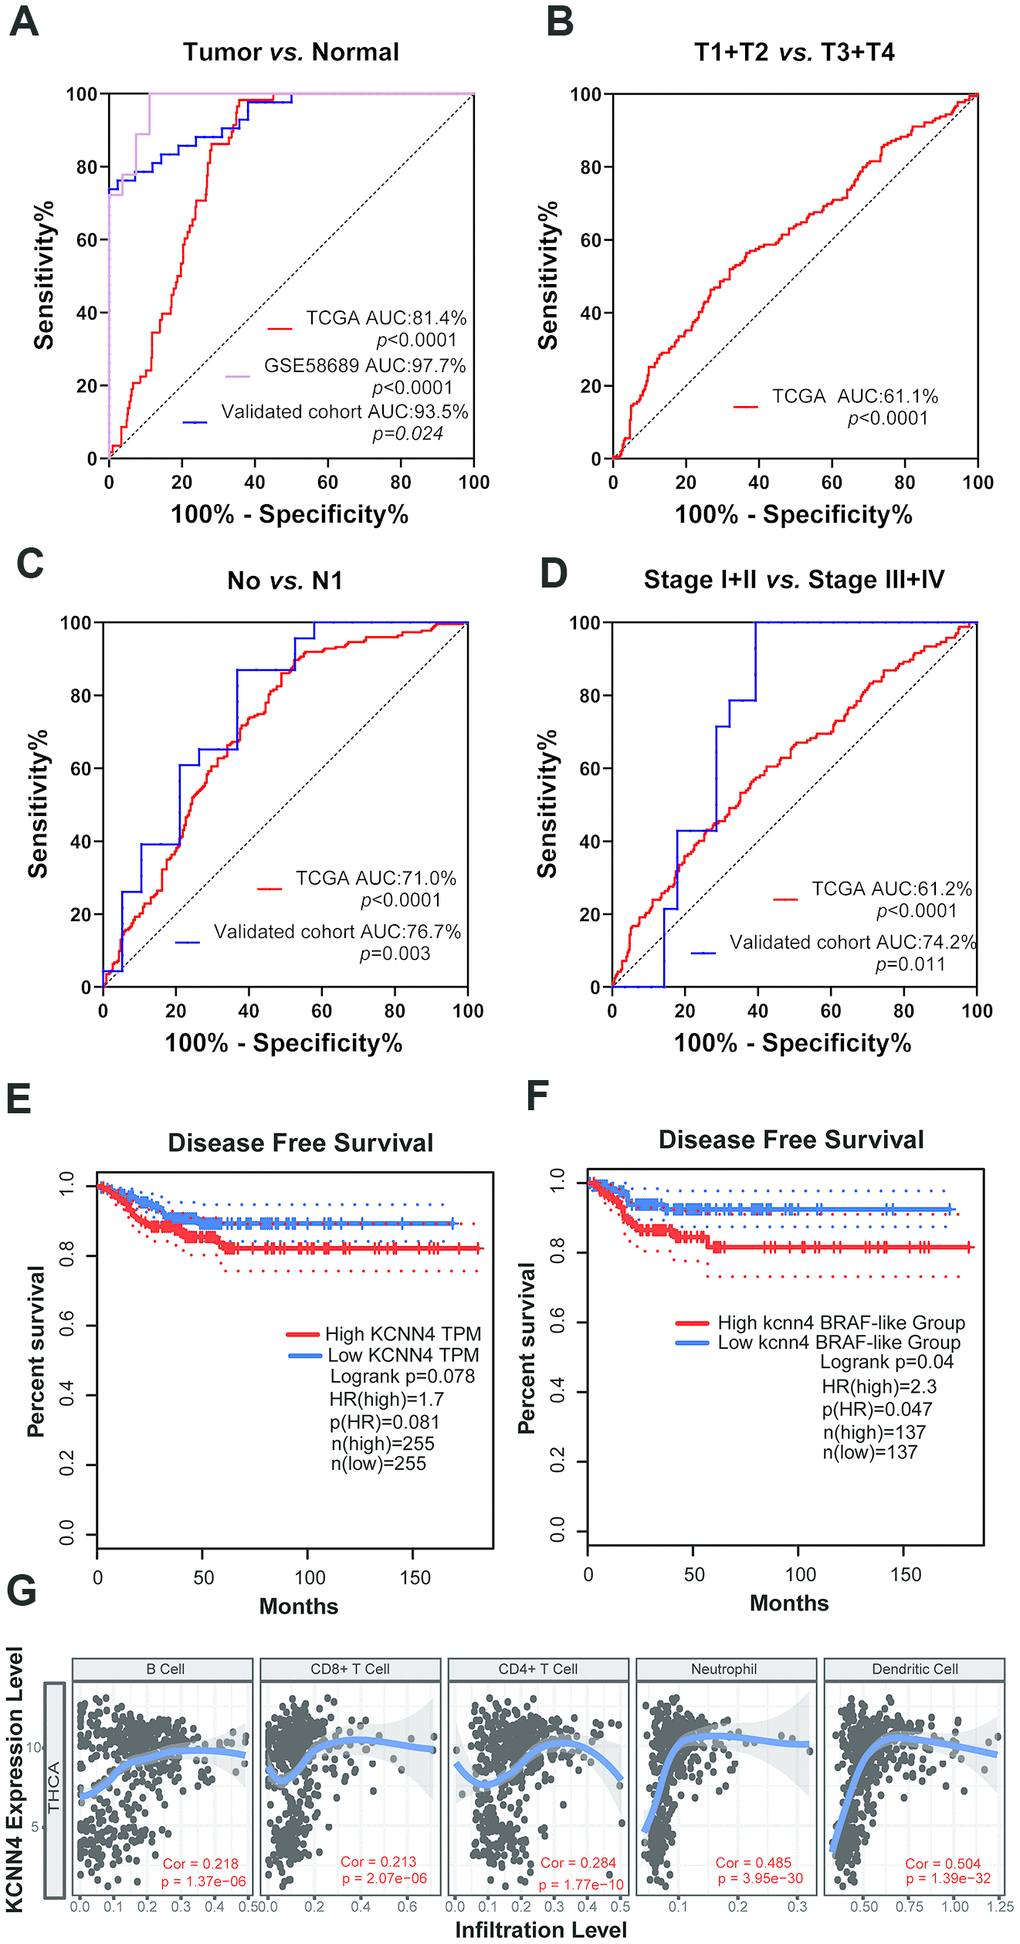
Figure 4. The upregulation of KCNN4 served as a prognostic and diagnostic biomarker in PTC. (A) ROC curve analysis demonstrated that KCNN4 could distinguish PTC from nontumorous tissues in TCGA, GSE58689 and our validated cohort. (B) Diagnostic value of KCNN4 expression for the T stage in TCGA. (C, D) ROC curve analysis depicting KCNN4 expression against the N stage and tumor stage in TCGA and our validated cohort. (E, F) Kaplan-Meier analyses of disease-free survival based on low and high KCNN4 expression in PTC patients and the BRAF-like group from TCGA. (G) KCNN4 expression was associated with immune infiltration in TCGA. THCA: Thyroid carcinoma; Cor: Correlation.
To investigate the prognostic value of KCNN4, we performed a disease-free survival analysis using Kaplan-Meier curves from the Gene Expression Profiling Interactive Analysis (GEPIA) server. Higher KCNN4 expression was associated with a greater risk of relapse or death (hazard ratio [HR]=1.7, p=0.078), especially in the BRAF-like subgroup (HR=2.3, p=0.047) (Figure 4E, 4F). Thus, KCNN4 overexpression may predict a worse prognosis in PTC patients.
KCNN4 overexpression is associated with immune cell infiltration
Previous studies have indicated that KCNN4 can alter antigen presentation and various immune cell functions [30, 31]. Using TCGA data from the TIMER online tool, we explored the association between KCNN4 expression and immune cell infiltration in PTC. KCNN4 expression correlated positively with the levels of infiltrating B cells (Correlation=0.218, p<0.0001), CD8+ T cells (Correlation=0.213, p<0.0001), CD4+ T cells (Correlation=0.284, p<0.0001), neutrophils (Correlation=0.485, p<0.0001) and dendrites (Correlation=0.504, p<0.0001) (Figure 4G).
KCNN4 is overexpressed in PTC cell lines and promotes PTC cell proliferation
We then examined the mRNA levels of KCNN4 in PTC and normal thyroid cell lines using qRT-PCR. KCNN4 expression was markedly higher in TPC-1 (4.83 ± 0.375, p<0.0001), KTC-1 (4.65 ± 0.327, p<0.0001) and BCPAP (1.30 ± 0.168, p<0.01) cells than in normal HTORI-3 cells (0.198 ± 0.025) (Figure 5A). Next, we used small interfering RNA (siRNA) to knock down KCNN4 (Si-KCNN4) in PTC cells. The siRNA reduced KCNN4 mRNA levels by > 50% in all three PTC cell lines (Figure 5B, p<0.01), and also significantly reduced KCNN4 protein levels (Figure 5C).
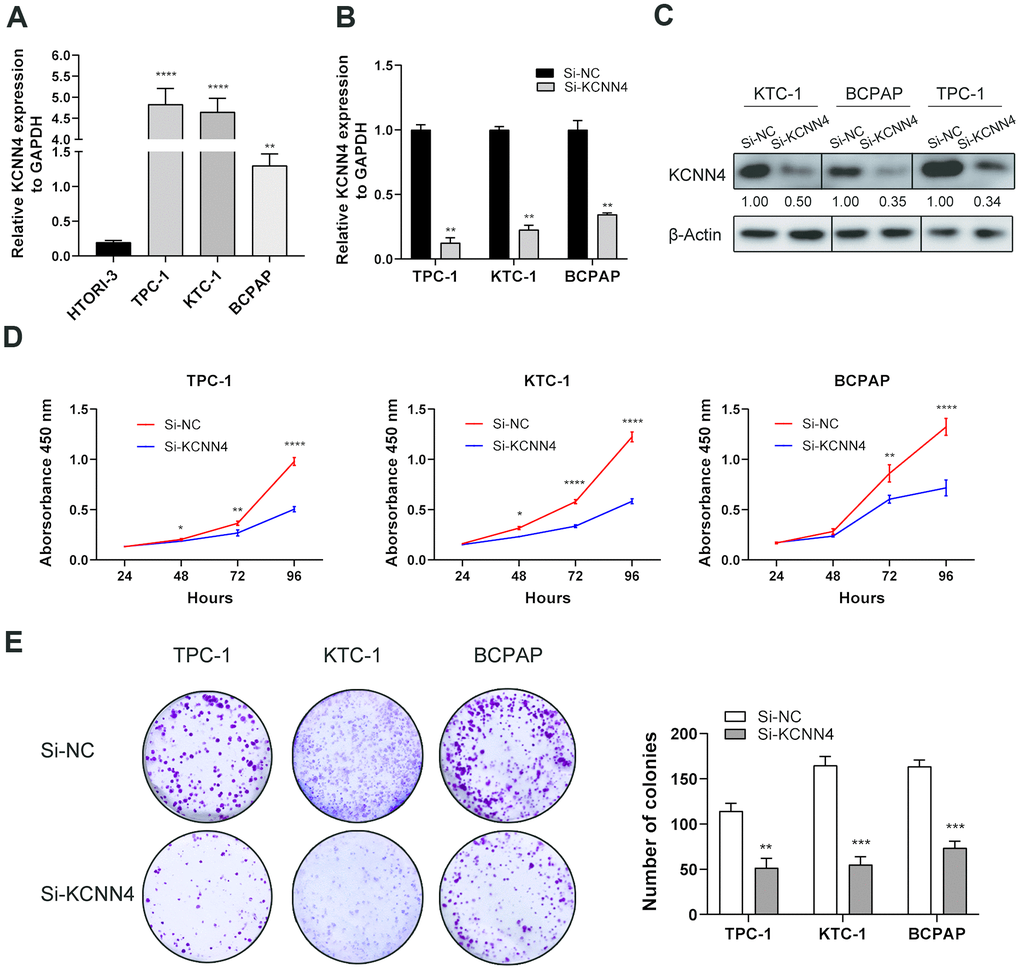
Figure 5. KCNN4 was upregulated in PTC cell lines and promoted their proliferation in vitro. (A) The relative expression of KCNN4 in PTC cell lines (compared with GAPDH). KCNN4 was upregulated in three PTC cell lines (KTC-1, TPC-1 and BCPAP) compared to the normal thyroid cell line HTORI-3. (B) KCNN4 expression was lower in the Si-KCNN4 group than in the Si-NC group in the three PTC cell lines. (C) KCNN4 protein expression was lower in the Si-KCNN4 group than in the Si-NC group. (D, E) CCK-8 assays and colony formation assays in the three PTC cell lines. Two-way analysis of variance was used to analyze the CCK-8 assay data, and Student’s t-test was used for the others. *p<0.05, **p<0.01, ***p<0.001, ****p<0.0001.
Next, we assessed the effects of KCNN4 on PTC cell proliferation. A Cell Counting Kit-8 (CCK-8) assay demonstrated that knocking down KCNN4 reduced the proliferative capacity of PTC cells, particularly in the last 24 hours of measurement (Figure 5D, p<0.0001). Additionally, a colony formation assay indicated that the downregulation of KCNN4 attenuated the proliferative abilities of TPC-1 cells (negative control siRNA [Si-NC]: 114.3 ± 8.5 colonies, Si-KCNN4: 51.7 ± 10.4 colonies, p<0.01), KTC-1 cells (Si-NC: 165.0 ± 9.6 colonies, Si-KCNN4: 55.0 ± 8.9 colonies, p<0.001) and BCPAP cells (Si-NC: 163.7 ± 7.0 colonies, Si-KCNN4: 73.7 ± 7.4 colonies, p<0.001) (Figure 5E). Thus, the downregulation of KCNN4 inhibited the proliferation of PTC cell lines.
KCNN4 knockdown reduces the migration and invasion capacities of PTC cells
Since KCNN4 expression correlated with LNM in PTC, we performed Transwell migration assays, wound healing assays and Matrigel invasion assays to assess the impact of KCNN4 on PTC cell migration and invasion. The migration and invasion abilities of TPC-1, KTC-1 and BCPAP cells transfected with Si-KCNN4 were significantly lower than those of cells transfected with Si-NC (Figure 6A, 6B). The number of migratory cells was as follows - TPC-1: Si-NC 213.7 ± 11.4, Si-KCNN4 81.7 ± 7.4, p<0.0001; KTC-1: Si-NC 250.0 ± 9.0, Si-KCNN4 59.7± 6.8, p<0.0001; BCPAP: Si-NC 122.7 ± 11.1, Si-KCNN4 65.7 ± 7.1, p<0.01. The number of invading cells was - TPC-1: Si-NC 141.0 ± 11.1, Si-KCNN4 42.3 ± 7.8, p<0.001; KTC-1: Si-NC 193.0 ± 19.1, Si-KCNN4 32.7 ± 8.3, p<0.001; BCPAP: Si-NC 114.3 ± 8.5, Si-KCNN4 16.3 ± 7.5, p<0.001. In the wound healing assay, 24 hours after the scratch, the migration rate was reduced to less than 40% of the control value when KCNN4 was downregulated (Figure 6C). These data indicated that KCNN4 may promote tumor metastasis in PTC.
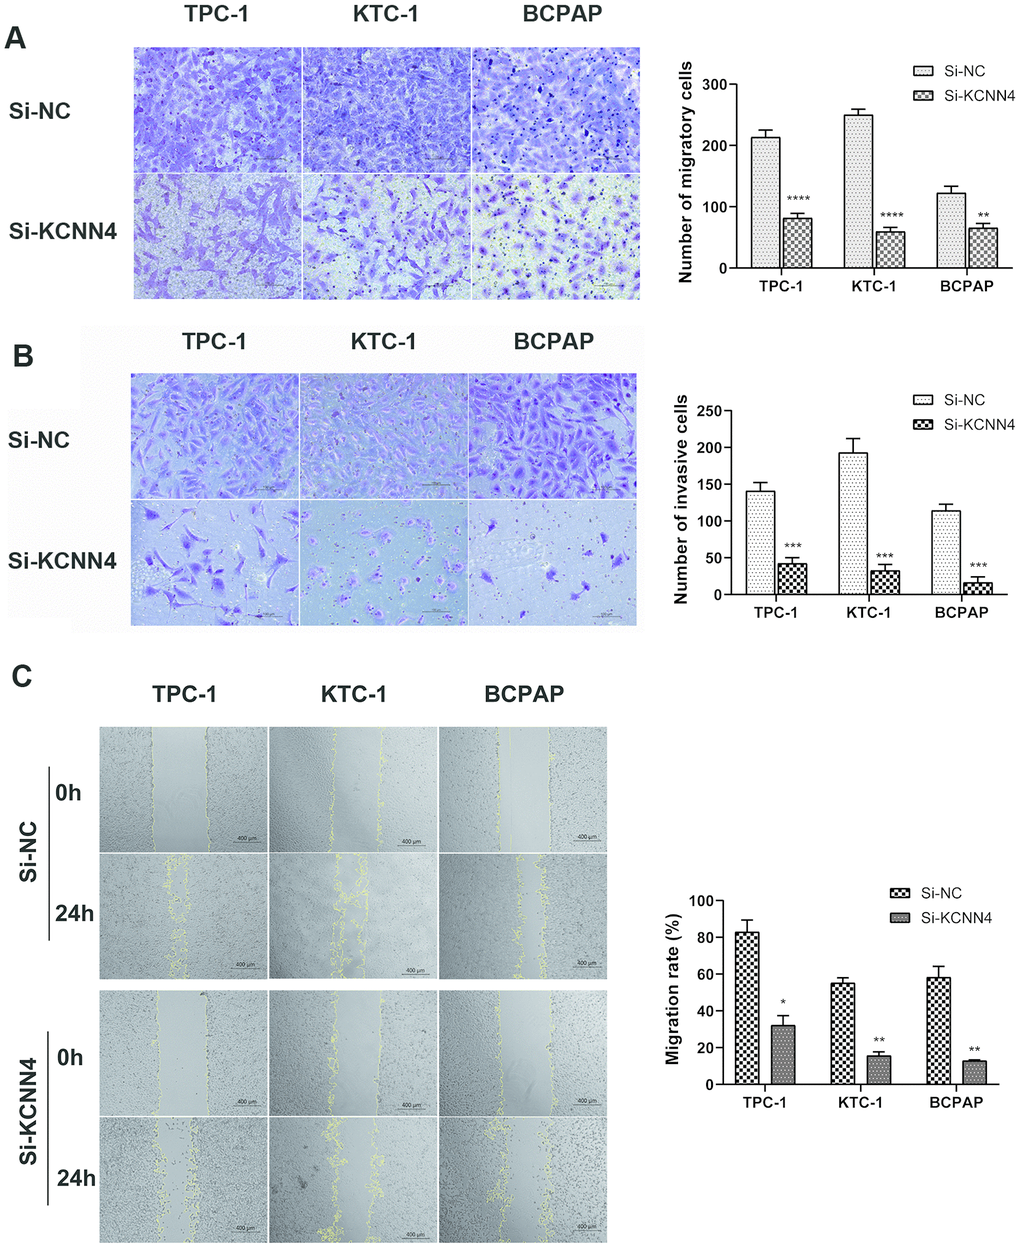
Figure 6. Downregulation of KCNN4 inhibited the migration and invasion of PTC cell lines. (A, B) Transwell migration and Matrigel invasion assays in the KCNN4-knockdown group and the corresponding control group in three PTC cell lines. The quantitative results of the migration and invasion assays were determined from five random fields. (C) A wound-healing assay indicated that downregulating KCNN4 reduced the migration abilities of PTC cell lines. The data came from at least two independent experiments. *p<0.05, **p<0.01, ***p<0.001, ****p<0.0001 in comparison with the Si-NC group using Student’s t-test.
KCNN4 suppresses apoptosis and induces the epithelial-mesenchymal transition (EMT) in thyroid cancer cell lines
Single Gene Set Enrichment Analysis (GSEA) was used to identify genes that may be regulated by KCNN4 in PTC. Based on the median level of KCNN4, PTC patients from TCGA were divided into two groups. We discovered that genes involved in the EMT (FDR=0.006, Enrichment score=0.6437) and apoptosis (FDR=0.0056, Enrichment score=0.5776) were associated with KCNN4 expression (Figure 7A, 7B). Therefore, we used flow cytometry to detect apoptosis in PTC cell lines after the downregulation of KCNN4. The apoptosis rate, calculated based on the total percentage of cells in the second and third quadrants, was higher in the KCNN4-knockdown group than in the control group in each cell line (TPC-1: Si-NC 0.76 ± 0.34, Si-KCNN4 2.66 ± 0.49, p<0.05; KTC-1: Si-NC 2.14 ± 0.20, Si-KCNN4 4.05± 0.07, p<0.01; BCPAP: Si-NC 4.29 ± 0.40, Si-KCNN4 5.92 ± 0.12, p<0.05) (Figure 7C).
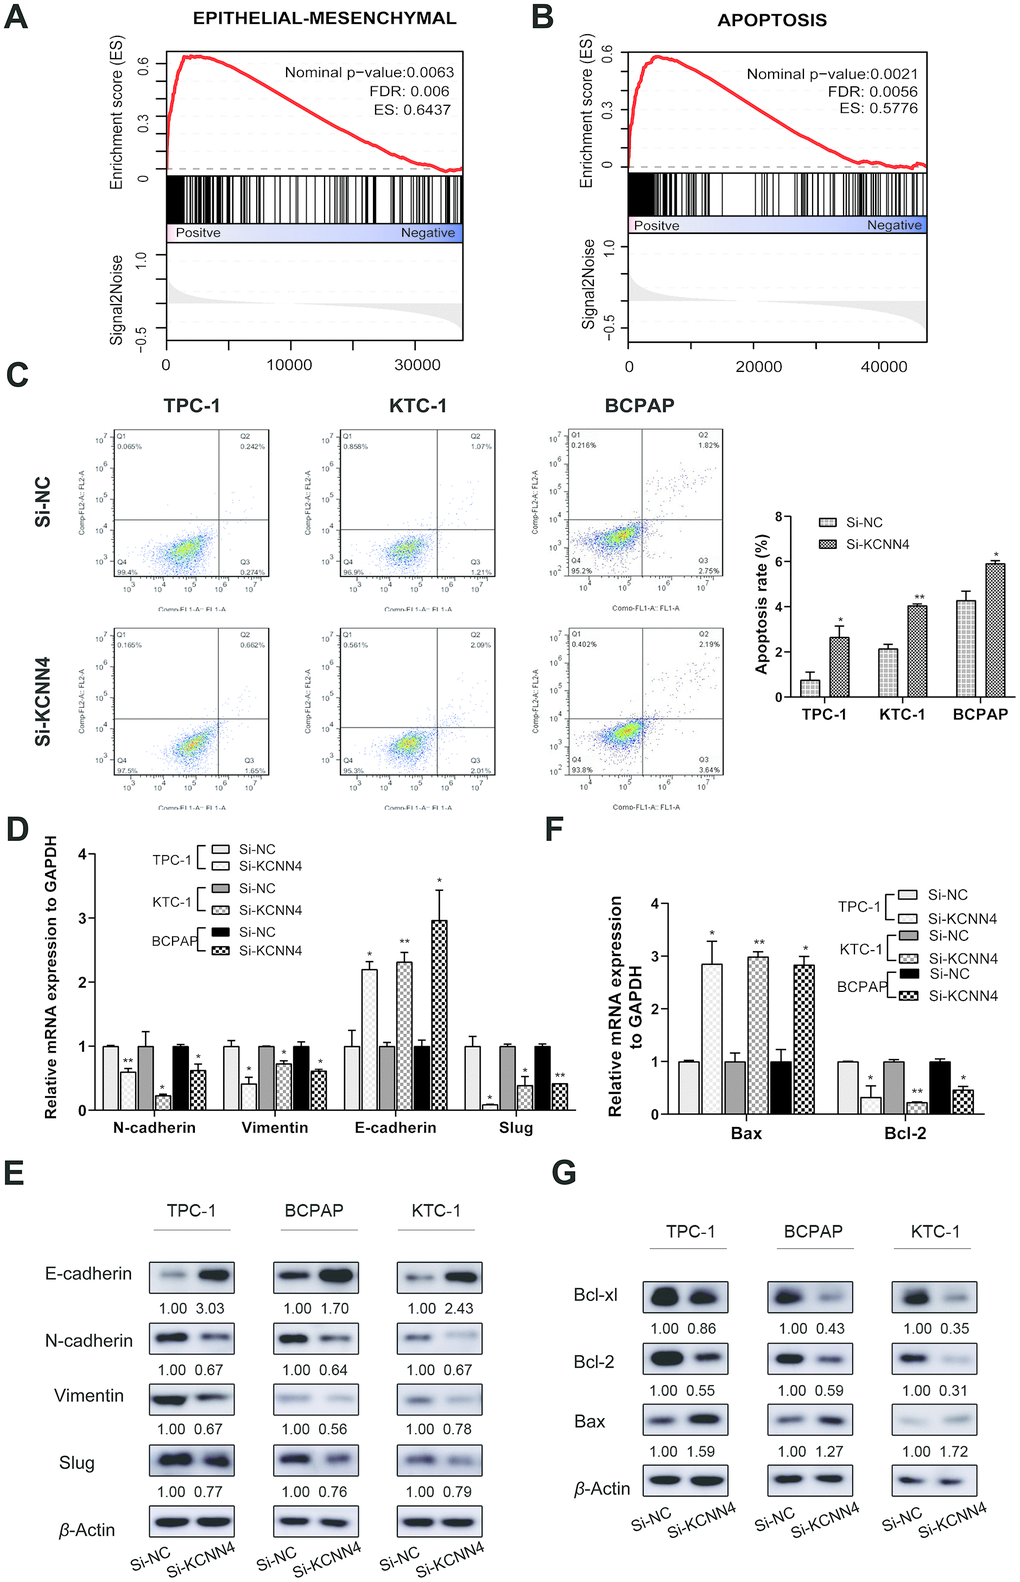
Figure 7. The downregulation of KCNN4 prevented the EMT while promoting apoptosis in PTC cell lines. (A, B) Single GSEA based on data from TCGA demonstrated that KCNN4 was associated with the EMT and apoptosis. (C) Silencing KCNN4 promoted apoptosis in PTC cell lines. (D, E) Silencing KCNN4 upregulated E-cadherin and downregulated N-cadherin, Vimentin and Slug at the mRNA and protein levels. (F) qRT-PCR demonstrated that downregulating KCNN4 enhanced Bax expression but reduced Bcl-2 expression. (G) Western blotting assays revealed that downregulating KCNN4 increased Bax expression and reduced Bcl-2 and Bcl-xl expression at the protein level. *p<0.05 and **p<0.01 in comparison with the Si-NC group using Student’s t-test.
Next, we quantified the mRNA and protein levels of several representative markers of the EMT and apoptosis in PTC cells. E-cadherin is an epithelial marker that suppresses tumor invasion, and its expression is negatively regulated by transcription factors such as Slug and Snail1 [32, 33]. Mesenchymal markers including Vimentin and N-cadherin are indicators of the EMT and cancer metastasis [34, 35]. The switch from E-cadherin to N-cadherin is an important hallmark of EMT induction [36]. We found that the downregulation of KCNN4 reduced N-cadherin, Vimentin and Slug expression while elevating E-cadherin expression (Figure 7D, 7E).
The Bcl-2 gene family, which participates in mitochondrion-induced cellular apoptosis, includes both anti-apoptotic (Bcl-2 and Bcl-xl) and pro-apoptotic genes (Bax). Bax exerts pro-apoptotic effects by sequestering Bcl-2 or Bcl-xl in the form of a heterodimer [37]. In our study, the downregulation of KCNN4 enhanced Bax expression and reduced Bcl-2 and Bcl-xl expression (Figure 7F, 7G). These results demonstrated that KCNN4 promotes the EMT and hinders apoptosis in PTC.
Discussion
TC has the fifth highest incidence rate of all cancers in women, following breast, lung, colorectal and uterine cancer [2]. Although patients with low-risk TC have a relatively good prognosis, those who experience recurrence or distant metastasis have a higher risk of death. Therefore, identifying high-risk patients is a crucial task for clinicians. To this end, it is indispensable to delineate the mechanisms of PTC and further mine the biomarkers for risk stratification. Numerous studies have demonstrated that membrane ion channels regulate cell proliferation, apoptosis and migration in various cancers, and thus can serve as prognostic biomarkers and therapeutic targets [38–40]. There is much evidence about the vital functions of ion channels in PTC, as well [26, 41].
KCNN4, a member of the KCNN family, encodes a potassium ion channel activated by calcium influx. The cancer-promoting effects of KCNN4 have been observed in various cancers. For example, KCNN4 is highly expressed in triple-negative breast cancer and was found to promote the migration and EMT of triple-negative breast cancer cells [42]. In hepatocellular carcinoma, KCNN4 promoted invasion and metastasis in vitro by inducing the MAPK/ERK and EMT pathways [43, 44]. Rabjerg et al. reported that high KCNN4 expression was associated with poor survival and a high metastasis potential in clear cell renal carcinoma [45]. However, the involvement of KCNN4 in TC has not been known.
In the present study, we first found that KCNN4 was highly upregulated in PTC tissues compared to normal thyroid tissues in public databases. We then examined KCNN4 mRNA levels using our own RNA sequencing data and a validated cohort including 42 matched PTC and adjacent normal tissues. The results were consistent with those of the bioinformatics analysis. Previous studies have demonstrated that high KCNN4 expression is associated with malignant features and poor prognoses in various cancers [28, 45]. When we investigated the correlation between KCNN4 expression and clinicopathological factors in PTC, we found that patients with higher KCNN4 levels had a higher T stage, a greater incidence of LNM and more advanced disease stages than patients with lower KCNN4 levels. The expression of KCNN4 varied among patients with different PTC subtypes and driver mutation statuses, as it was elevated in patients with the columnar variant and classical types, as well as in those with BRAF mutations, RET fusion and wild-type RAS. Regression analysis indicated that KCNN4 overexpression was an independent predictor of LNM in PTC. In addition, ROC curve analysis indicated that KCNN4 expression could distinguish PTC tissues from normal tissues. Patients with higher KCNN4 levels also had worse disease-free survival than those with lower levels, and this effect was especially pronounced in the BRAF-like group, whose KCNN4 levels were significantly greater than those of the RAS-like group. These results suggested that KCNN4 is a potential biomarker for PTC.
Interestingly, we found a positive association between KCNN4 expression and immune infiltration in PTC patients in TCGA. This finding was consistent with previous data indicating that KCNN4 enhance migration capacity of dendritic cells and positively regulate antigen presentation [46]. Chimote et al. reported that activation of KCNN4 channel could improve immune surveillance and the response to immune therapies in cancer [31]. It has also been reported that KCNN4 blockers can ameliorate autoimmune disorders and inflammation [47]. Some studies have indicated that LNM is more common in PTC patients with thyroid autoimmunity than in those without [48–50]. Thus, we speculate that KCNN4 may be a valuable therapeutic target for PTC patients with coexistent thyroid autoimmunity. However, further experiments are needed to confirm this hypothesis.
Our loss-of-function study demonstrated that KCNN4 promotes proliferation, migration and invasion while inhibiting apoptosis in PTC cell lines. GSEA demonstrated the statistically significant enrichment of gene signatures associated with apoptosis and EMT. Extensive studies have shown that the EMT is associated with tumor initiation, progression, stemness, migration and resistance in various cancers [35]. Vasko et al. reported that the EMT was a common phenomenon in PTC metastasis, and that Vimentin promoted the EMT in thyroid cancer cell lines [51]. Another hallmark of cancer cells is their evasion of apoptosis [52]. Certain transcription factors and other proteins involved in the EMT have been reported to facilitate tumor survival by hindering apoptosis [53]. For example, proteins in the Snail family not only induce the EMT, but also promote survival and cell movement [54]. On the other hand, Wu and Tang reported that Bcl-2, an anti-apoptotic protein, is also an important inducer of the EMT [55]. Thus, there seems to be crosstalk between the EMT and apoptosis in the progression of cancer. Our study demonstrated that silencing KCNN4 elevated the expression of E-cadherin and Bax but reduced the expression of N-cadherin, Vimentin, Slug, Bcl-2 and Bcl-xl. These results indicated that KCNN4 may promote the EMT and inhibit apoptosis in PTC.
Our study had several shortcomings. First, we did not validate our results in vivo. Second, the crosstalk between the EMT and apoptosis in KCNN4-induced PTC progression requires further exploration. Finally, to increase the clinical significance of our findings, further experiments are needed to explore the effects of KCNN4 blockers on PTC.
In summary, we found that KCNN4 was overexpressed in PTC and was a valuable diagnostic and prognostic marker. Silencing of KCNN4 hindered the progression of PTC cell lines. Thus, KCNN4 is a potential therapeutic target in PTC.
Materials and Methods
Bioinformatics
Public microarray datasets (GSE58689 [56], GSE9115 [57], GSE3678) including 44 PTC tissues and 29 nontumorous tissues were downloaded from the Gene Expression Omnibus (https://www.ncbi.nlm.nih.gov/geo/). Transcriptome sequencing data from 502 PTC samples and 58 normal thyroid tissues, along with the corresponding clinical data, were obtained from the thyroid cancer database of TCGA (https://www.cancer.gov/about-nci/organization/ccg/research/structural-genomics/tcga/studied-cancers/thyroid). R software (https://bioconductor.org/biocLite.R) was used to preprocess the data and investigate the differentially expressed genes. Differentially expressed genes in the microarray datasets were identified using the Limma package, with screening conditions of an adjusted p-value < 0.05 and a log2|fold change| ≥ 2. The heatmap was clustered using a Pearson correlation metric.
Pan-cancer analysis and immune infiltration evaluation were performed using the TIMER database (https://cistrome.shinyapps.io/timer/) [58]. Kaplan-Meier plots for disease-free survival were downloaded from the online database GEPIA (http://gepia.cancer-pku.cn) [59]. Single GSEA between the low and high KCNN4 expression groups in TCGA was conducted using GSEA software (GSEA v3.0, http://www.broadinstitute.org/gsea) [60].
Tissue samples
Forty-two matched pairs of PTC tissues and adjacent nontumorous tissues (patient age range: 16-72 years; male/female: 1/2) were dissected in the Department of Thyroid and Breast Surgery at The First Affiliated Hospital of Wenzhou Medical University (Wenzhou, Zhejiang, China) in 2018. After excision, the samples were instantly plunged into liquid nitrogen and frozen at -80 °C for long-term storage. Each specimen was histologically analyzed by three pathologists. Written informed consent was obtained from each patient. The clinical data were collected legally under protocols developed by the Committee for Medical Research Ethics of the First Affiliated Hospital of Wenzhou Medical University.
RNA sequencing data from 70 pairs of PTC tissues and matched adjacent nontumorous tissues were derived from our unpublished data.
Cell culture
Human PTC cell lines (TPC-1, KTC-1 and BCPAP) were provided by Prof. Mingzhao Xing of the Johns Hopkins University School of Medicine (Baltimore, MD, USA). The normal human thyroid cell line (HTORI-3) was purchased from the Cell Bank of the Shanghai Chinese Academy of Sciences (Shanghai, China). The research resource identification number is CVCL_6298 for TPC-1, CVCL_6300 for KTC-1, CVCL_0153 for BCPAP and CVCL_4W02 for HTORI-3. The cells were cultured in RPMI 1640 medium containing 10% fetal bovine serum (Gibco, Invitrogen, Carlsbad, CA, USA) and 1% penicillin/streptomycin (Solarbio, Beijing, China) at 37 °C under 5% CO2.
Cell transfection
SiRNAs (si-KCNN4 and si-NC) were designed and supplied by Gene Pharma (Shanghai, China). Cells were seeded in six-well plates one day before transfection (TPC-1, BCPAP: 60,000 cells per well; KTC-1: 80,000 cells per well). The siRNA was introduced into the cells using Lipofectamine RNAiMAX (Invitrogen, Grand Island, NY, USA) (siRNA:iMAX = 7.5 uL:3 uL). After seven hours, the medium was replaced. The cells were used after 48 hours for further experiments. The sequence of the KCNN4-targeted siRNA was as follows: KCNN4-homo-1481 sense 5’- GGGAACAAGUGAACUCCAUTT-3’/antisense 5’-AUGGAGUUCACUUGUUCCCTT-3’.
RNA isolation, reverse transcription and qRT-PCR
Total RNA was extracted using TRIzol reagent (Thermo Fisher Scientific, Waltham, MA, USA), and reverse transcription was performed with a ReverTra Ace qPCR RT Kit (Toyobo, Osaka, Japan). The qRT-PCR was performed using a SYBR Premix Ex Taq II kit (RR820A, TaKaRa, Dalian, China) on an Applied Biosystems 7500 Real-Time PCR System. The mRNA expression relative to GAPDH expression was calculated using the 2−ΔΔCt method. All measurements were performed according to standard protocols. The primers used in this study are shown in Supplementary Table 1 (Generay, Shanghai, China; Sangon, Shanghai, China).
Cell proliferation assays
Cell viability was measured with a CCK-8 assay and a colony formation assay. TPC-1 cells (1,250 per well), KTC-1 cells (1,500 per well) and BCPAP cells (1,500 per well) were plated into 96-well plates. The cells were incubated with the CCK-8 reagent (Beyotime Biotechnology, Shanghai, China) for three hours (10 uL per well). Detection was performed at an absorbance of 450 nm on four consecutive days. For the colony formation assay, cells were seeded in six-well plates in the same numbers described above. At least five days later (> 50 cells/colony and > 30 colonies), colonies were fixed with 4% paraformaldehyde and stained with 0.1% crystal violet. Photos were taken under bright light. The experiments were carried out three times.
Migration and invasion analysis
Cells were collected 48 hours after transfection and seeded (35,000 cells per well) into the upper chamber of a Transwell plate (#3422, Corning, NY, USA) with serum-free medium. The lower chamber was filled with 600 ul of medium containing 10% fetal bovine serum. After 22 hours, the cells that had migrated to the lower side of the membrane were fixed with 4% paraformaldehyde and stained with 0.1% crystal violet. Cells in five random visual fields from each chamber were imaged and counted under a microscope at ×20 magnification. A Matrigel invasion chamber (#354480, Corning Biocoat, Corning) was used with the same protocol to evaluate cellular invasion.
For the scratch wound assay, transfected cells were cultured under serum-free conditions at a density of 2×10⁵ cells per well in 24-well plates. A pipette tip was used to scratch the middle of each plate. Five fixed points were imaged at ×5 magnification before and after scratching. The migration rate (%) was calculated as (original wound area – 24-hour wound area) / original wound area × 100%. All experiments were performed at least three times.
Flow cytometry analysis
Cell apoptosis was detected with an Annexin V-fluorescein isothiocyanate (FITC) apoptosis kit (#556547; Becton, Dickinson and Company, Franklin Lakes, NJ, USA) according to the manufacturer’s instructions. Cells were collected and washed three times with phosphate-buffered saline. Next, 500 uL of 1× binding buffer was used to resuspend the cells, and the cell suspension was dyed successively with Annexin V-FITC for 15 min and propidium iodide (PI) for 5 min in the dark. A flow cytometer (BD Biosciences Accuri C6; Becton, Dickinson and Company) and FlowJo software (FlowJo, Ashland, OR, USA) were used to analyze the cells. The Annexin V- / PI+, Annexin V+ / PI+, Annexin V+ / PI- and Annexin V- / PI- populations corresponded to necrotic cells (quadrant 1), late apoptotic cells (quadrant 2), early apoptotic cells (quadrant 3) and viable cells (quadrant 4), respectively.
Western blotting
Total protein was extracted using radioimmunoprecipitation assay buffer (Solarbio) and protease inhibitors (Solarbio), and was measured with a bicinchoninic acid assay (Thermo Scientific, USA). The protein lysates were mixed with loading buffer and separated by 8-10% sodium dodecyl sulfate polyacrylamide gel electrophoresis (BioRad, Berkeley, CA, USA) at 80-120 V, and transferred to polyvinylidene difluoride membranes (EMD Millipore, Billerica, MA, USA) at 300 mA. After being blocked with 5% non-fat dried milk for two hours, the membranes were incubated with primary antibodies at 4 °C overnight. The antibodies used in this research are shown in Supplementary Table 2. Next, the blots were incubated with horseradish peroxidase-conjugated anti-rabbit or anti-mouse IgG (1:5000) secondary antibodies (Abcam, Cambridge, UK) at room temperature for two hours. Finally, proteins were visualized using an enhanced chemiluminescence (Thermo Scientific) detection system, and the images were analyzed with ImageJ software (NIH, Bethesda, MD, USA). Every experiment was repeated independently at least twice.
Statistical analysis
Statistical analyses were performed using SPSS 22.0 software (IBM SPSS Inc, Chicago, IL, USA) and GraphPad Prism 8 software (GraphPad, San Diego, CA, USA). ROC curves were applied to evaluate the diagnostic efficacy of KCNN4. Kaplan-Meier curves were used to evaluate the impact of KCNN4 expression on disease-free survival. Clinicopathological parameters were assessed using the χ2 test. The Shapiro-Wilk normality test (α = 0.05) was used to evaluate the data distribution. Normally distributed data were compared using Student’s t-test, while non-normally distributed data were analyzed using non-parametric tests (the Kruskal-Wallis test, Mann-Whitney test or Wilcoxon rank-sum test). Two-way analysis of variance was used for the CCK-8 assay. The results are presented as the mean ± standard deviation, and p-values < 0.05 were considered to be significant.
Supplementary Materials
Conflicts of Interest
The authors of this study declare that they have no conflicts of interest.
Funding
This work was funded by the Natural Science Foundation of Zhejiang Province (LGF18H160031, LY18H160053) and the Science and Technology Planning Project of Wenzhou (Y20170740).
References
- 1. Lim H, Devesa SS, Sosa JA, Check D, Kitahara CM. Trends in thyroid cancer incidence and mortality in the United States, 1974-2013. JAMA. 2017; 317:1338–48. https://doi.org/10.1001/jama.2017.2719 [PubMed]
- 2. Siegel RL, Miller KD, Jemal A. Cancer statistics, 2020. CA Cancer J Clin. 2020; 70:7–30. https://doi.org/10.3322/caac.21590 [PubMed]
- 3. Carling T, Udelsman R. Thyroid cancer. Annu Rev Med. 2014; 65:125–37. https://doi.org/10.1146/annurev-med-061512-105739 [PubMed]
- 4. Schneider DF, Chen H. New developments in the diagnosis and treatment of thyroid cancer. CA Cancer J Clin. 2013; 63:374–94. https://doi.org/10.3322/caac.21195 [PubMed]
- 5. Wada N, Suganuma N, Nakayama H, Masudo K, Rino Y, Masuda M, Imada T. Microscopic regional lymph node status in papillary thyroid carcinoma with and without lymphadenopathy and its relation to outcomes. Langenbecks Arch Surg. 2007; 392:417–22. https://doi.org/10.1007/s00423-007-0159-4 [PubMed]
- 6. Sampson E, Brierley JD, Le LW, Rotstein L, Tsang RW. Clinical management and outcome of papillary and follicular (differentiated) thyroid cancer presenting with distant metastasis at diagnosis. Cancer. 2007; 110:1451–56. https://doi.org/10.1002/cncr.22956 [PubMed]
- 7. Shaha AR, Shah JP, Loree TR. Differentiated thyroid cancer presenting initially with distant metastasis. Am J Surg. 1997; 174:474–6. https://doi.org/10.1016/s0002-9610(97)00158-x [PubMed]
- 8. Haq M, Harmer C. Differentiated thyroid carcinoma with distant metastases at presentation: prognostic factors and outcome. Clin Endocrinol (Oxf). 2005; 63:87–93. https://doi.org/10.1111/j.1365-2265.2005.02304.x [PubMed]
- 9. Shaha A. Treatment of thyroid cancer based on risk groups. J Surg Oncol. 2006; 94:683–91. https://doi.org/10.1002/jso.20697 [PubMed]
- 10. Xing M, Alzahrani AS, Carson KA, Shong YK, Kim TY, Viola D, Elisei R, Bendlová B, Yip L, Mian C, Vianello F, Tuttle RM, Robenshtok E, et al. Association between BRAF V600E mutation and recurrence of papillary thyroid cancer. J Clin Oncol. 2015; 33:42–50. https://doi.org/10.1200/JCO.2014.56.8253 [PubMed]
- 11. Xing M. BRAF mutation in thyroid cancer. Endocr Relat Cancer. 2005; 12:245–62. https://doi.org/10.1677/erc.1.0978 [PubMed]
- 12. Xing M, Westra WH, Tufano RP, Cohen Y, Rosenbaum E, Rhoden KJ, Carson KA, Vasko V, Larin A, Tallini G, Tolaney S, Holt EH, Hui P, et al. BRAF mutation predicts a poorer clinical prognosis for papillary thyroid cancer. J Clin Endocrinol Metab. 2005; 90:6373–79. https://doi.org/10.1210/jc.2005-0987 [PubMed]
- 13. Virk RK, Van Dyke AL, Finkelstein A, Prasad A, Gibson J, Hui P, Theoharis CG, Carling T, Roman SA, Sosa JA, Udelsman R, Prasad ML. BRAFV600E mutation in papillary thyroid microcarcinoma: a genotype-phenotype correlation. Mod Pathol. 2013; 26:62–70. https://doi.org/10.1038/modpathol.2012.152 [PubMed]
- 14. Nam JK, Jung CK, Song BJ, Lim DJ, Chae BJ, Lee NS, Park WC, Kim JS, Jung SS, Bae JS. Is the BRAF(V600E) mutation useful as a predictor of preoperative risk in papillary thyroid cancer? Am J Surg. 2012; 203:436–41. https://doi.org/10.1016/j.amjsurg.2011.02.013 [PubMed]
- 15. Ito Y, Yoshida H, Maruo R, Morita S, Takano T, Hirokawa M, Yabuta T, Fukushima M, Inoue H, Tomoda C, Kihara M, Uruno T, Higashiyama T, et al. BRAF mutation in papillary thyroid carcinoma in a Japanese population: its lack of correlation with high-risk clinicopathological features and disease-free survival of patients. Endocr J. 2009; 56:89–97. https://doi.org/10.1507/endocrj.k08e-208 [PubMed]
- 16. Kim TY, Kim WB, Song JY, Rhee YS, Gong G, Cho YM, Kim SY, Kim SC, Hong SJ, Shong YK. The BRAF mutation is not associated with poor prognostic factors in Korean patients with conventional papillary thyroid microcarcinoma. Clin Endocrinol (Oxf). 2005; 63:588–93. https://doi.org/10.1111/j.1365-2265.2005.02389.x [PubMed]
- 17. Xing M, Liu R, Liu X, Murugan AK, Zhu G, Zeiger MA, Pai S, Bishop J. BRAF V600E and TERT promoter mutations cooperatively identify the most aggressive papillary thyroid cancer with highest recurrence. J Clin Oncol. 2014; 32:2718–26. https://doi.org/10.1200/JCO.2014.55.5094 [PubMed]
- 18. Moon S, Song YS, Kim YA, Lim JA, Cho SW, Moon JH, Hahn S, Park DJ, Park YJ. Effects of coexistent BRAFV600E and TERT promoter mutations on poor clinical outcomes in papillary thyroid cancer: a meta-analysis. Thyroid. 2017; 27:651–60. https://doi.org/10.1089/thy.2016.0350 [PubMed]
- 19. Pak K, Suh S, Kim SJ, Kim IJ. Prognostic value of genetic mutations in thyroid cancer: a meta-analysis. Thyroid. 2015; 25:63–70. https://doi.org/10.1089/thy.2014.0241 [PubMed]
- 20. Abubaker J, Jehan Z, Bavi P, Sultana M, Al-Harbi S, Ibrahim M, Al-Nuaim A, Ahmed M, Amin T, Al-Fehaily M, Al-Sanea O, Al-Dayel F, Uddin S, Al-Kuraya KS. Clinicopathological analysis of papillary thyroid cancer with PIK3CA alterations in a middle eastern population. J Clin Endocrinol Metab. 2008; 93:611–18. https://doi.org/10.1210/jc.2007-1717 [PubMed]
- 21. Cancer Genome Atlas Research Network. Integrated genomic characterization of papillary thyroid carcinoma. Cell. 2014; 159:676–90. https://doi.org/10.1016/j.cell.2014.09.050 [PubMed]
- 22. Fraser SP, Pardo LA. Ion channels: functional expression and therapeutic potential in cancer. Colloquium on ion channels and cancer. EMBO Rep. 2008; 9:512–15. https://doi.org/10.1038/embor.2008.75 [PubMed]
- 23. Asher V, Khan R, Warren A, Shaw R, Schalkwyk GV, Bali A, Sowter HM. The eag potassium channel as a new prognostic marker in ovarian cancer. Diagn Pathol. 2010; 5:78. https://doi.org/10.1186/1746-1596-5-78 [PubMed]
- 24. Han Y, Liu C, Zhang D, Men H, Huo L, Geng Q, Wang S, Gao Y, Zhang W, Zhang Y, Jia Z. Mechanosensitive ion channel Piezo1 promotes prostate cancer development through the activation of the Akt/mTOR pathway and acceleration of cell cycle. Int J Oncol. 2019; 55:629–44. https://doi.org/10.3892/ijo.2019.4839 [PubMed]
- 25. Mato E, Barceló-Batllori S, Orera I, Selva L, Corra M, González C, Bell O, Lerma E, Moral A, Pérez JI, de Leiva A. The proteomic 2D-DIGE approach reveals the protein voltage-dependent anion channel 2 as a potential therapeutic target in epithelial thyroid tumours. Mol Cell Endocrinol. 2015; 404:37–45. https://doi.org/10.1016/j.mce.2015.01.021 [PubMed]
- 26. Gong Y, Yang J, Wu W, Liu F, Su A, Li Z, Zhu J, Wei T. Preserved SCN4B expression is an independent indicator of favorable recurrence-free survival in classical papillary thyroid cancer. PLoS One. 2018; 13:e0197007. https://doi.org/10.1371/journal.pone.0197007 [PubMed]
- 27. Liu X, Wei L, Zhao B, Cai X, Dong C, Yin F. Low expression of KCNN3 may affect drug resistance in ovarian cancer. Mol Med Rep. 2018; 18:1377–86. https://doi.org/10.3892/mmr.2018.9107 [PubMed]
- 28. Jiang S, Zhu L, Yang J, Hu L, Gu J, Xing X, Sun Y, Zhang Z. Integrated expression profiling of potassium channels identifys KCNN4 as a prognostic biomarker of pancreatic cancer. Biochem Biophys Res Commun. 2017; 494:113–19. https://doi.org/10.1016/j.bbrc.2017.10.072 [PubMed]
- 29. Ibrahim S, Dakik H, Vandier C, Chautard R, Paintaud G, Mazurier F, Lecomte T, Guéguinou M, Raoul W. Expression profiling of calcium channels and calcium-activated potassium channels in colorectal cancer. Cancers (Basel). 2019; 11:561. https://doi.org/10.3390/cancers11040561 [PubMed]
- 30. Chiang EY, Li T, Jeet S, Peng I, Zhang J, Lee WP, DeVoss J, Caplazi P, Chen J, Warming S, Hackos DH, Mukund S, Koth CM, Grogan JL. Potassium channels Kv1.3 and KCa3.1 cooperatively and compensatorily regulate antigen-specific memory T cell functions. Nat Commun. 2017; 8:14644. https://doi.org/10.1038/ncomms14644 [PubMed]
- 31. Chimote AA, Balajthy A, Arnold MJ, Newton HS, Hajdu P, Qualtieri J, Wise-Draper T, Conforti L. A defect in KCa3.1 channel activity limits the ability of CD8+ T cells from cancer patients to infiltrate an adenosine-rich microenvironment. Sci Signal. 2018; 11:eaaq1616. https://doi.org/10.1126/scisignal.aaq1616 [PubMed]
- 32. Meigs TE, Fedor-Chaiken M, Kaplan DD, Brackenbury R, Casey PJ. Galpha12 and Galpha13 negatively regulate the adhesive functions of cadherin. J Biol Chem. 2002; 277:24594–600. https://doi.org/10.1074/jbc.M201984200 [PubMed]
- 33. Yang J, Weinberg RA. Epithelial-mesenchymal transition: at the crossroads of development and tumor metastasis. Dev Cell. 2008; 14:818–29. https://doi.org/10.1016/j.devcel.2008.05.009 [PubMed]
- 34. Mendez MG, Kojima S, Goldman RD. Vimentin induces changes in cell shape, motility, and adhesion during the epithelial to mesenchymal transition. FASEB J. 2010; 24:1838–51. https://doi.org/10.1096/fj.09-151639 [PubMed]
- 35. Nieto MA, Huang RY, Jackson RA, Thiery JP. Emt: 2016. Cell. 2016; 166:21–45. https://doi.org/10.1016/j.cell.2016.06.028 [PubMed]
- 36. Wheelock MJ, Shintani Y, Maeda M, Fukumoto Y, Johnson KR. Cadherin switching. J Cell Sci. 2008; 121:727–35. https://doi.org/10.1242/jcs.000455 [PubMed]
- 37. Renault TT, Dejean LM, Manon S. A brewing understanding of the regulation of bax function by bcl-xL and bcl-2. Mech Ageing Dev. 2017; 161:201–10. https://doi.org/10.1016/j.mad.2016.04.007 [PubMed]
- 38. Kunzelmann K. Ion channels and cancer. J Membr Biol. 2005; 205:159–73. https://doi.org/10.1007/s00232-005-0781-4 [PubMed]
- 39. Prevarskaya N, Skryma R, Shuba Y. Ion channels and the hallmarks of cancer. Trends Mol Med. 2010; 16:107–21. https://doi.org/10.1016/j.molmed.2010.01.005 [PubMed]
- 40. Schwab A, Stock C. Ion channels and transporters in tumour cell migration and invasion. Philos Trans R Soc Lond B Biol Sci. 2014; 369:20130102. https://doi.org/10.1098/rstb.2013.0102 [PubMed]
- 41. Xu S, Zhang L, Cheng X, Yu H, Bao J, Lu R. Capsaicin inhibits the metastasis of human papillary thyroid carcinoma BCPAP cells through the modulation of the TRPV1 channel. Food Funct. 2018; 9:344–54. https://doi.org/10.1039/c7fo01295k [PubMed]
- 42. Zhang P, Yang X, Yin Q, Yi J, Shen W, Zhao L, Zhu Z, Liu J. Inhibition of SK4 potassium channels suppresses cell proliferation, migration and the epithelial-mesenchymal transition in triple-negative breast cancer cells. PLoS One. 2016; 11:e0154471. https://doi.org/10.1371/journal.pone.0154471 [PubMed]
- 43. Li QT, Feng YM, Ke ZH, Qiu MJ, He XX, Wang MM, Li YN, Xu J, Shi LL, Xiong ZF. KCNN4 promotes invasion and metastasis through the MAPK/ERK pathway in hepatocellular carcinoma. J Investig Med. 2020; 68:68–74. https://doi.org/10.1136/jim-2019-001073 [PubMed]
- 44. Du Y, Song W, Chen J, Chen H, Xuan Z, Zhao L, Chen J, Jin C, Zhou M, Tuo B, Zhao Y, Zheng S, Song P. The potassium channel KCa3.1 promotes cell proliferation by activating SKP2 and metastasis through the EMT pathway in hepatocellular carcinoma. Int J Cancer. 2019; 145:503–16. https://doi.org/10.1002/ijc.32121 [PubMed]
- 45. Rabjerg M, Oliván-Viguera A, Hansen LK, Jensen L, Sevelsted-Møller L, Walter S, Jensen BL, Marcussen N, Köhler R. High expression of KCa3.1 in patients with clear cell renal carcinoma predicts high metastatic risk and poor survival. PLoS One. 2015; 10:e0122992. https://doi.org/10.1371/journal.pone.0122992 [PubMed]
- 46. Crottès D, Félix R, Meley D, Chadet S, Herr F, Audiger C, Soriani O, Vandier C, Roger S, Angoulvant D, Velge-Roussel F. Immature human dendritic cells enhance their migration through KCa3.1 channel activation. Cell Calcium. 2016; 59:198–207. https://doi.org/10.1016/j.ceca.2016.02.008 [PubMed]
- 47. Chou CC, Lunn CA, Murgolo NJ. KCa3.1: target and marker for cancer, autoimmune disorder and vascular inflammation? Expert Rev Mol Diagn. 2008; 8:179–87. https://doi.org/10.1586/14737159.8.2.179 [PubMed]
- 48. Shen CT, Zhang XY, Qiu ZL, Sun ZK, Wei WJ, Song HJ, Luo QY. Thyroid autoimmune antibodies in patients with papillary thyroid carcinoma: a double-edged sword? Endocrine. 2017; 58:176–83. https://doi.org/10.1007/s12020-017-1401-7 [PubMed]
- 49. Jo K, Kim MH, Ha J, Lim Y, Lee S, Bae JS, Jung CK, Kang MI, Cha BY, Lim DJ. Prognostic value of preoperative anti-thyroglobulin antibody in differentiated thyroid cancer. Clin Endocrinol (Oxf). 2017; 87:292–99. https://doi.org/10.1111/cen.13367 [PubMed]
- 50. Vasileiadis I, Boutzios G, Charitoudis G, Koukoulioti E, Karatzas T. Thyroglobulin antibodies could be a potential predictive marker for papillary thyroid carcinoma. Ann Surg Oncol. 2014; 21:2725–32. https://doi.org/10.1245/s10434-014-3593-x [PubMed]
- 51. Vasko V, Espinosa AV, Scouten W, He H, Auer H, Liyanarachchi S, Larin A, Savchenko V, Francis GL, de la Chapelle A, Saji M, Ringel MD. Gene expression and functional evidence of epithelial-to-mesenchymal transition in papillary thyroid carcinoma invasion. Proc Natl Acad Sci USA. 2007; 104:2803–08. https://doi.org/10.1073/pnas.0610733104 [PubMed]
- 52. Hanahan D, Weinberg RA. The hallmarks of cancer. Cell. 2000; 100:57–70. https://doi.org/10.1016/s0092-8674(00)81683-9 [PubMed]
- 53. Chakraborty S, Mir KB, Seligson ND, Nayak D, Kumar R, Goswami A. Integration of EMT and cellular survival instincts in reprogramming of programmed cell death to anastasis. Cancer Metastasis Rev. 2020; 39:553–66. https://doi.org/10.1007/s10555-020-09866-x [PubMed]
- 54. Barrallo-Gimeno A, Nieto MA. The snail genes as inducers of cell movement and survival: implications in development and cancer. Development. 2005; 132:3151–61. https://doi.org/10.1242/dev.01907 [PubMed]
- 55. Wu Y, Tang L. Bcl-2 family proteins regulate apoptosis and epithelial to mesenchymal transition by calcium signals. Curr Pharm Des. 2016; 22:4700–04. https://doi.org/10.2174/1381612822666160506125937 [PubMed]
- 56. Rusinek D, Swierniak M, Chmielik E, Kowal M, Kowalska M, Cyplinska R, Czarniecka A, Piglowski W, Korfanty J, Chekan M, Krajewska J, Szpak-Ulczok S, Jarzab M, et al. BRAFV600E-associated gene expression profile: early changes in the transcriptome, based on a transgenic mouse model of papillary thyroid carcinoma. PLoS One. 2015; 10:e0143688. https://doi.org/10.1371/journal.pone.0143688 [PubMed]
- 57. Salvatore G, Nappi TC, Salerno P, Jiang Y, Garbi C, Ugolini C, Miccoli P, Basolo F, Castellone MD, Cirafici AM, Melillo RM, Fusco A, Bittner ML, Santoro M. A cell proliferation and chromosomal instability signature in anaplastic thyroid carcinoma. Cancer Res. 2007; 67:10148–58. https://doi.org/10.1158/0008-5472.CAN-07-1887 [PubMed]
- 58. Li T, Fan J, Wang B, Traugh N, Chen Q, Liu JS, Li B, Liu XS. TIMER: a web server for comprehensive analysis of tumor-infiltrating immune cells. Cancer Res. 2017; 77:e108–10. https://doi.org/10.1158/0008-5472.CAN-17-0307 [PubMed]
- 59. Tang Z, Li C, Kang B, Gao G, Li C, Zhang Z. GEPIA: a web server for cancer and normal gene expression profiling and interactive analyses. Nucleic Acids Res. 2017; 45:W98–102. https://doi.org/10.1093/nar/gkx247 [PubMed]
- 60. Mootha VK, Lindgren CM, Eriksson KF, Subramanian A, Sihag S, Lehar J, Puigserver P, Carlsson E, Ridderstråle M, Laurila E, Houstis N, Daly MJ, Patterson N, et al. PGC-1alpha-responsive genes involved in oxidative phosphorylation are coordinately downregulated in human diabetes. Nat Genet. 2003; 34:267–73. https://doi.org/10.1038/ng1180 [PubMed]