


Introduction
Alzheimer's disease (AD) is a progressive neurodegenerative disease characterized by beta amyloid (Aβ) plaque deposition, neurofibrillary tangles, neuroinflammatory responses, synaptic degeneration, and extensive neuron loss [1–3]. Cerebrovascular abnormalities, such as blood brain barrier (BBB) dysfunction, endothelial injury, and hypoperfusion often occur during AD pathogenesis [4–6]. However, the specific changes in cerebrovascular density and morphology in AD are still unclear.
Vessel size imaging is a quantitative imaging method, which can evaluate the vascular angiogenesis and morphology by determining the parameters of microvascular density (Density), mean vessel diameter in the voxel (mVD), and vessel size index (VSI) [7, 8]. The parameters of Density and mVD represent the density and size of microvessels in the local vascular network, respectively. The VSI, a quantitative index, can monitor expansion and contraction of microvessels in vivo by revealing the distribution of microvascular diameters within the voxel [7, 9, 10]. These three parameters obtained by vessel size imaging have been used to explore the vascular angiogenesis and morphology of tumors and strokes [8, 10–12], but so far, no study has applied this method to evaluate the changes in cerebral microvessels in AD.
Given the robust association of cerebrovascular pathology with AD, and the paucity of non-invasive early-stage AD diagnostics, we investigated brain cerebrovascular density and morphology changes in an amyloid precursor protein 23 (APP23) transgenic mouse AD model by vessel size imaging using a 9.4 Tesla magnetic resonance machine [13, 14]. Our results demonstrate that the late stages of AD progression in APP23 mice are associated with the decreased Density of cerebral microvessels, increased vascular dilatation, and vascular diameter enlargement. In addition, our data show that abnormal vascular density and morphology changes associated with AD can be identified as early as 9 months in the AD mouse model, and that hippocampus is the sensitive region that reflects the microvessel changes in AD.
Results
Density values in cortex and hippocampus of APP23 and WT mice
Brain images of 46 mice were analyzed, including 24 WT mice and 22 APP23 mice, which have increased expression of the human amyloid precursor protein (APP). Processing of the obtained brain images is illustrated in Figure 1.
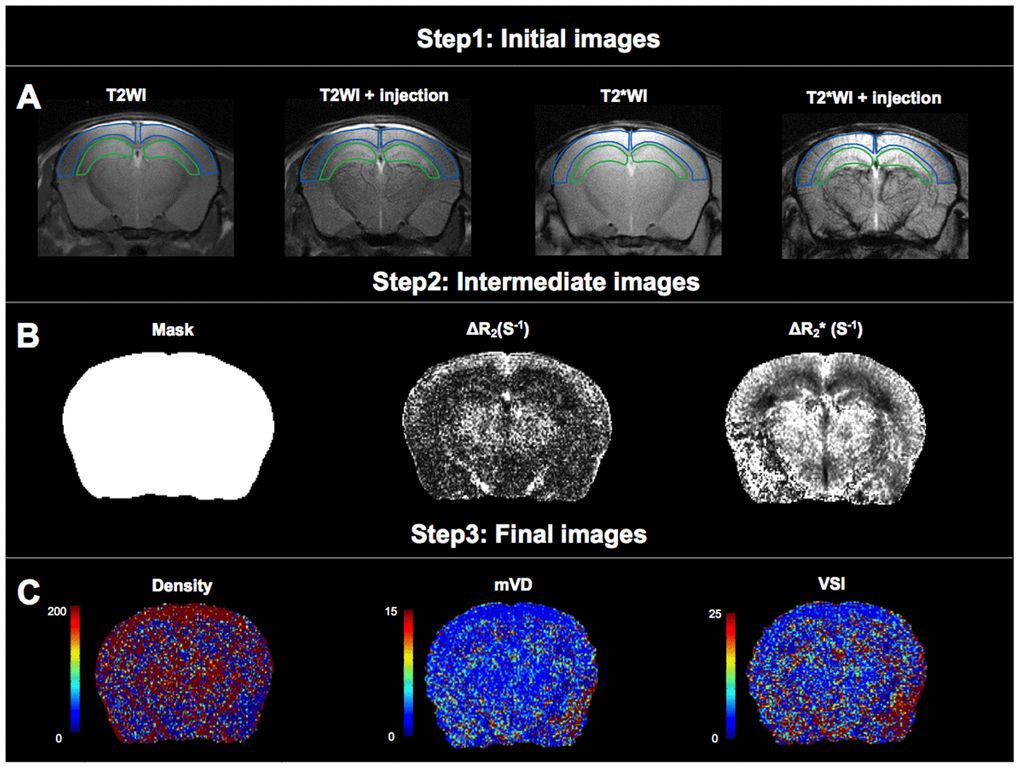
Figure 1. Analysis of microvascular density (Density), mean vessel diameter in the voxel (mVD), and vessel size index (VSI). (A) The first step of data processing. Two regions of interest (ROIs) were delineated on T2WI and projected to other images. The ROI delineated by the blue line is cortical region, and the ROI delineated by the green line is hippocampal region. (B) The second step of data processing. Maps of mask, ΔR2 and
The Density values of cortex and hippocampus in APP23 and WT mice of different ages are shown in Tables 1, 2 and in Figure 2. The colormap of Density in APP23 and WT mice at different ages was presented in Figure 2A. The Density values of both cortex and hippocampus in APP23 and WT mice decreased between 3 and 9 months (Figure 2B). However, the Density values of cortex and hippocampus differed between 14 month-old APP23 and WT mice. Compared with the gradual decrease of the Density in WT mice, the Density values of cortex and hippocampus in 14-month old APP23 mice showed a transient increase (Figure 2B). At 20 months, the Density values of cortical and hippocampal regions of APP23 and WT mice were significantly decreased. Specifically, the Density values of cortex and hippocampus in 20-month old APP23 mice were 63% and 65% lower than the highest values at 3 months, while they were only 29% and 28% lower in 20-month old WT mice than in 3-month WT mice. Therefore, at 20 months, the decrease in Density values of cortex and hippocampus was more obvious in APP23 mice than in WT mice.
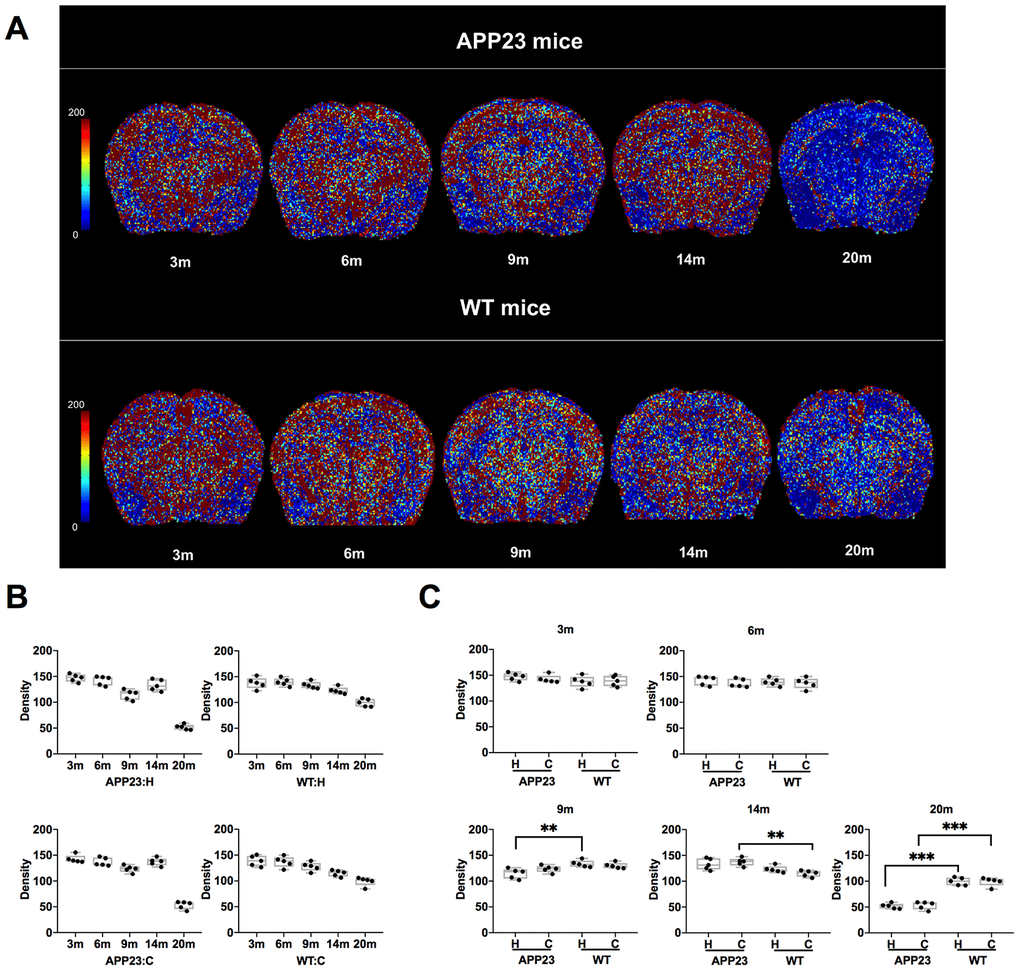
Figure 2. Density in APP23 and WT mice of different ages. (A) Colormap of Density in APP23 and WT mice of different ages. (B) Density values of cortex and hippocampus of APP23 and WT mice of different ages. (C) Comparison of the Density values in the cortex and hippocampus between APP23 and WT mice of the same age. WT: wide type; C: cortex; H: hippocampus; VSI, vessel size index.
Table 1. Density, mVD, and VSI values of cortex and hippocampus in APP23 transgenic mice.
| Age (months) | Cortical Region | Hippocampal Region | |||||||||||||||||||||||||||||||||||||||||||||||||||||||||||||||||||||||||||||||||||||||||||||||||
| Density (vessel mm-2) | mVD (a.u) | VSI (μm) | Density (vessel mm-2) | mVD (a.u) | VSI (μm) | ||||||||||||||||||||||||||||||||||||||||||||||||||||||||||||||||||||||||||||||||||||||||||||||
| 3 | 142.58±8.66 | 6.90±0.72 | 10.70±1.52 | 147.10±8.71 | 6.38±0.41 | 10.31±1.52 | |||||||||||||||||||||||||||||||||||||||||||||||||||||||||||||||||||||||||||||||||||||||||||||
| 6 | 137.13±7.23 | 6.67±0.58 | 10.32±1.22 | 142.04±8.04 | 6.33±0.63 | 10.01±0.88 | |||||||||||||||||||||||||||||||||||||||||||||||||||||||||||||||||||||||||||||||||||||||||||||
| 9 | 123.52±5.98 | 6.57±0.67 | 9.28±0.94 | 114.62±7.73 | 6.29±0.39 | 8.32±0.91 | |||||||||||||||||||||||||||||||||||||||||||||||||||||||||||||||||||||||||||||||||||||||||||||
| 14 | 137.27±9.77 | 5.56±0.83 | 8.09±1.19 | 133.09±9.85 | 6.21±0.52 | 7.40±0.90 | |||||||||||||||||||||||||||||||||||||||||||||||||||||||||||||||||||||||||||||||||||||||||||||
| 20 | 53.15±6.76 | 13.41±1.23 | 21.00±1.28 | 51.78±4.65 | 13.36±0.85 | 22.16±2.65 | |||||||||||||||||||||||||||||||||||||||||||||||||||||||||||||||||||||||||||||||||||||||||||||
| mVD, mean vessel diameter in the voxel; VSI, vessel size index. | |||||||||||||||||||||||||||||||||||||||||||||||||||||||||||||||||||||||||||||||||||||||||||||||||||
Table 2. Density, mVD, and VSI values of cortex and hippocampus of WT mice.
| Age (months) | Cortical Region | Hippocampal Region | |||||||||||||||||||||||||||||||||||||||||||||||||||||||||||||||||||||||||||||||||||||||||||||||||
| Density (vessel mm-2) | mVD (a.u) | VSI (μm) | Density (vessel mm-2) | mVD (a.u) | VSI (μm) | ||||||||||||||||||||||||||||||||||||||||||||||||||||||||||||||||||||||||||||||||||||||||||||||
| 3 | 138.85±9.16 | 6.55±0.83 | 10.31±0.84 | 137.60±13.93 | 6.61±0.35 | 9.16±1.01 | |||||||||||||||||||||||||||||||||||||||||||||||||||||||||||||||||||||||||||||||||||||||||||||
| 6 | 136.94±10.37 | 6.27±0.54 | 10.51±1.22 | 139.51±8.76 | 6.58±0.83 | 9.33±1.35 | |||||||||||||||||||||||||||||||||||||||||||||||||||||||||||||||||||||||||||||||||||||||||||||
| 9 | 129.82±7.09 | 6.98±0.76 | 10.69±1.04 | 133.47±6.97 | 6.68±0.52 | 11.12±1.08 | |||||||||||||||||||||||||||||||||||||||||||||||||||||||||||||||||||||||||||||||||||||||||||||
| 14 | 114.78±5.42 | 6.93±0.45 | 9.55±1.32 | 123.05±5.84 | 6.60±0.61 | 8.74±0.94 | |||||||||||||||||||||||||||||||||||||||||||||||||||||||||||||||||||||||||||||||||||||||||||||
| 20 | 99.10±7.47 | 6.82±0.62 | 13.65±0.96 | 99.63±9.75 | 7.91±0.96 | 13.07±1.51 | |||||||||||||||||||||||||||||||||||||||||||||||||||||||||||||||||||||||||||||||||||||||||||||
| mVD, mean vessel diameter in the voxel; VSI, vessel size index. | |||||||||||||||||||||||||||||||||||||||||||||||||||||||||||||||||||||||||||||||||||||||||||||||||||
The comparison of the Density values in cortex and hippocampus between APP23 and WT mice of the same age is shown in Figure 2C. In the cortical area, the Density value of APP23 mice was significantly higher than that in WT mice at 14 months. At 20 months, the Density value of cortex in APP23 mice was significantly lower than in WT mice (Figure 2C). However, in the hippocampal area, the Density value in APP23 mice was significantly lower than in WT mice at 9 months, and was further reduced at 20 months (Figure 2C). Therefore, the Density values suggest that significant differences in the hippocampus between APP23 and WT mice are first observed at the age of 9 months.
mVD values in cortex and hippocampus of APP23 and WT mice
The mVD values of cortex and hippocampus in APP23 and WT mice of different ages are shown in Figure 3. The colormap of mVD in APP23 and WT mice at different ages was displayed in Figure 3A. As shown in Figure 3B, the mVD values of cortex and hippocampus in APP23 mice showed a slight decline from 3 to 14 months. However, at 20 months, the mVD values of cortex and hippocampus in APP23 mice significantly increased, indicating that the vascular diameter in APP23 mice was significantly enlarged at the late stage of aging. In contrast, in WT mice, there were no significant differences in the mVD values at different ages. Figure 3C illustrates the comparison of the mVD values in cortex and hippocampus between APP23 mice and WT mice at of the same ages. In the cortical area, the mVD value in 14-month old APP23 mice was significantly lower than in WT mice, but at 20 months, the mVD value of cortex in APP23 mice was significantly higher than in WT mice. In addition, in the hippocampal area, the mVD value in APP23 mice was significantly higher than in 20-month old WT mice. Thus, the mVD values indicate that significant differences between APP23 and WT mice are first observed in the cortex at the age of 14 months.
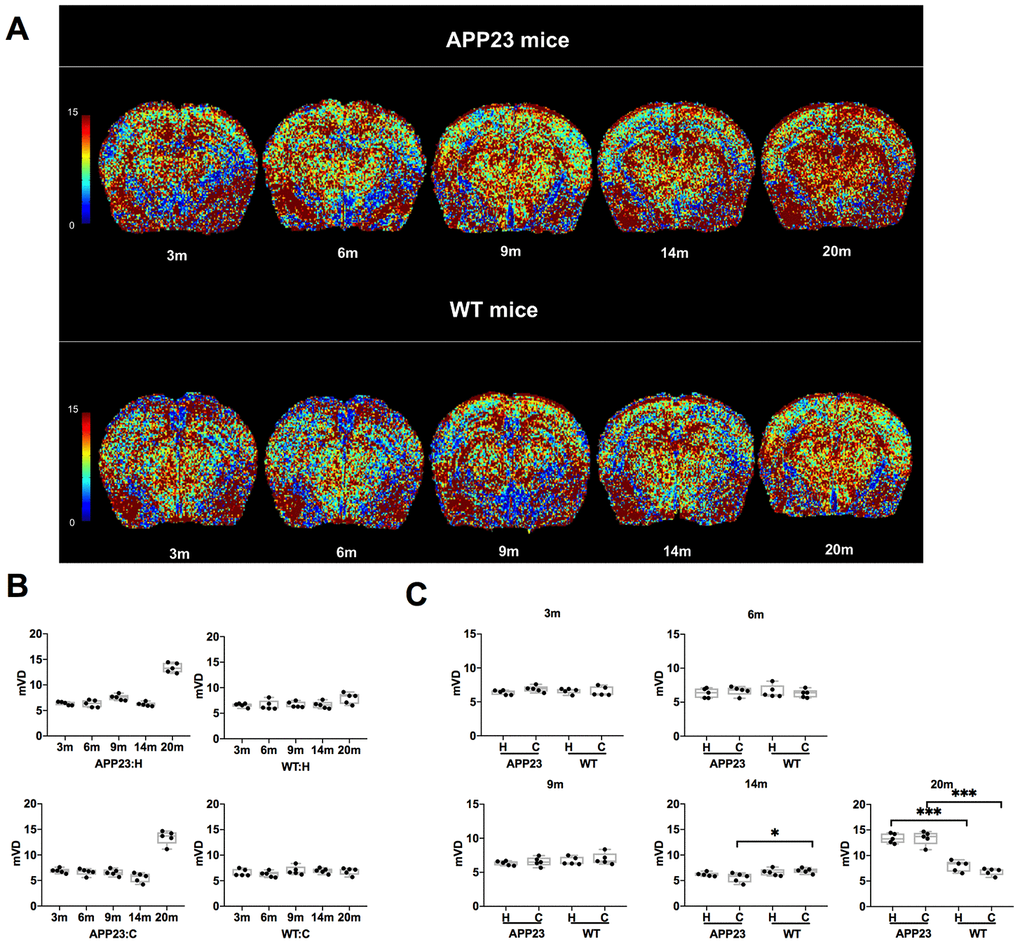
Figure 3. mVD values in APP23 and WT mice of different ages. (A) Colormap of mVD in APP23 and WT mice of different ages. (B) mVD values of cortex and hippocampus in APP23 and WT mice at different ages. (C) Comparison of mVD values in cortex and hippocampus between APP23 and WT mice at the same age. WT: wide type; C: cortex; H: hippocampus; mVD, mean vessel diameter in the voxel.
VSI values in cortex and hippocampus of APP23 and WT mice
The VSI values in cortex and hippocampus of APP23 and WT mice at different ages are shown in Figure 4. The colormap of VSI in APP23 and WT mice at different ages was displayed in Figure 4A. As shown in Figure 4B, the VSI values in cortex and hippocampus of APP23 mice decreased gradually from 3 to 14 months. However, at 20 months, the VSI values in cortex and hippocampus in APP23 and WT mice significantly increased. The comparison of the VSI values in cortex and hippocampus between APP23 and WT mice of the same age is shown in Figure 4C. In 9 month-old APP23 mice, the hippocampal area VSI value was significantly lower than in WT mice, while, in the cortical area, the VSI value in 14-month old APP23 mice was significantly lower than in WT mice. In 20-month old APP23 mice, the VSI values of both cortex and hippocampus were significantly higher than WT mice. These results suggest that significant differences between APP23 and WT mice are first observed in the hippocampus at the age of 9 months, indicating that the hippocampus is the ‘sensitive region’ that reflects the early changes of microvessels in AD.
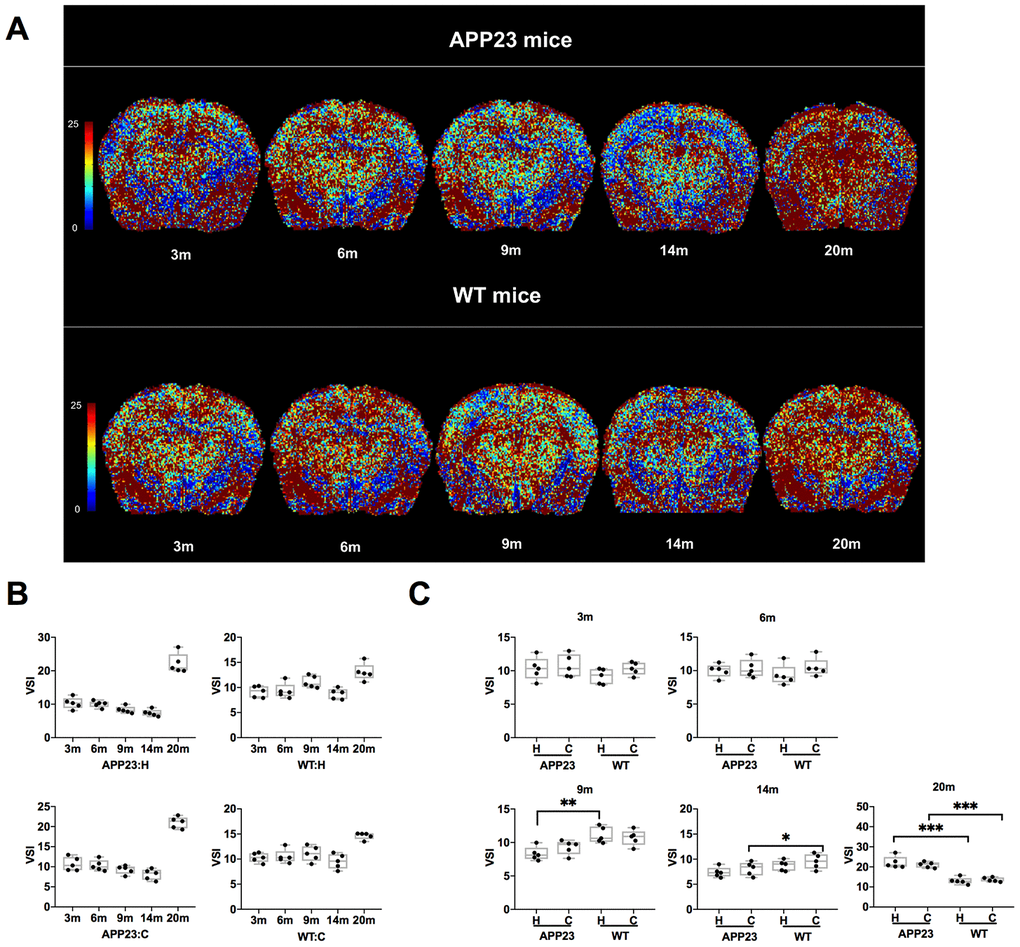
Figure 4. VSI values in APP23 and WT mice of different ages. (A) Colormap of VSI in APP23 and WT mice of different ages. (B) VSI values of cortex and hippocampus in APP23 and WT mice at different ages. (C) Comparison of VSI values in cortex and hippocampus between APP23 and WT mice at the same age. WT: wide type; C: cortex; H: hippocampus; VSI, vessel size index.
Discussion
AD is a progressive neurodegenerative disease with a high morbidity rate in the world [15, 16]. Recent studies have emphasized the important roles of vascular factors in AD [17–19]. However, the specific variation of microvessels at the early stages of AD have not been identified which may improve the early diagnosis of AD. In this study, we performed a non-invasive and quantitative assessment of vascular density and size in AD mouse model using vessel size imaging. Our results indicate that abnormal vascular density and morphology changes associated with AD can be identified as early as 9 months, and that hippocampus is the sensitive region that reflects the microvascular changes in AD.
Vascular density changes in AD
By quantitative assessment of APP23 and WT mice of different ages, we found that the Density values of cortex and hippocampus decreased with age, especially at 20-month-old age. The age-associated decrease in Density values was also demonstrated by Fischer et al [20]. Furthermore, histopathology studies demonstrated that in older (20 months) APP23 mice, the exponentially increased Aβ plaques were widely distributed in cerebral cortex, hippocampus, capillary lumen, and other brain regions, resulting in an irreversible significant decrease of cerebral microvascular density [14, 21–23].
Our data demonstrated a transient increase in Density values in 14-month old APP23 mice which was significantly different from WT mice. We supposed that this transient increase in APP mice was compensatory. According to previous studies, microvascular pathological environment in APP23 mice induced the activation of macrophages and monocytes, which released the vascular endothelial growth factor (VEGF), basic fibroblast growth factor (bFGF), and platelet-derived growth factor (PDGF) [24–27]. Those growth factors maybe a potential cause of transient Density increase.
By comparing the cortical and hippocampal Density values in APP23 and WT mice of the same ages, a significant decrease was identified in hippocampus of APP23 mice at 9 months, indicating that hippocampus could be considered as the sensitive region in evaluating the vascular density of AD. This manifestation corresponded to the discovery of Aβ deposition in the hippocampus of APP23 mice at the age of 6-8 months, as demonstrated by Meyer's histopathological findings [28]. In addition, the cortex Density value in 14-month old APP23 mice was significantly higher than in WT mice, suggesting that the cortex could be considered as the specific region reflective of vascular Density changes in AD.
Increased mVD values at the late stage of AD
mVD, a dimensionless ratio, represents the vascular size distribution and is estimated by the water diffusion coefficient and contrast agent concentration [29]. In this study, our results suggested that the vascular diameter of APP23 mice underwent a variation from slight constriction to obvious dilation with AD progression. Histopathologically, hypoxia and hypoperfusion in APP23 mice can lead to vascular contraction by the regulation of vascular contractile endothelin-1 (ET-1) and angiotensin II [18, 30]. Based on Magnetic resonance angiography (MRA) imaging methods, APP23 mice had abnormal hemodynamics in the circle of the Willis arteries at the age of 20 months [31]. Additionally, the severity of Aβ pathological deposition also contributes to the vascular diameter changes, including loss of vascular elasticity, degeneration of muscle cells and atrophy of vascular wall, especially in the late stage of AD [18]. By comparing the cortical and hippocampal mVD values in APP23 and WT mice of the same ages, significant differences between APP23 and WT mice were observed in the cortex at the age of 14 months, indicating that cortex could be considered as a region reflective of mVD changes in AD.
Early vasoconstriction and late dilation of cerebrovascular microvessels in AD
VSI is the averaged microvessel size over the capillary population based on the weight of its volumetric fraction [11]. It is often used to detect the contraction and dilation of microvessels. In this study, the VSI values of cortex and hippocampus of APP23 mice decreased gradually from 3 to 14 months, but significantly increased at 20 months. The variation trend of VSI values in APP23 and WT mice was generally consistent with mVD values, and indicated that the variation of vascular size changed from slight constriction to obvious dilation with AD progression. However, the earlier abnormalities in vessel size and the more significant degree of late vasodilation detected by VSI indicated that VSI was more sensitive than mVD to monitor the vascular size. This finding is also supported by previous study of imaging and histological indicators demonstrating that VSI is most closely related to histopathological changes [11]. From the perspective of imaging processing, compared with mVD, VSI can avoid the strong dependence on the contrast agent concentration, and thus provides a more accurate and sensitive evaluation of the vascular size [29].
Comparing cortical and hippocampal VSI of APP23 and WT mice at the same age revealed that the hippocampal VSI value of 9-month old APP23 mice and the cortical VSI value of 14-month old APP23 mice were significantly different from those of WT mice. This finding verified that the hippocampus was a sensitive brain region involved in AD progression, and could be considered as a brain region reflective of vascular morphology changes during early stages of AD [32, 33].
Limitations, future directions, and conclusions
This study focused on imaging of vascular abnormalities in APP23 transgenic mice. A better understanding of the vascular changes involved in AD will require a combination of histopathology, molecular biology, and imaging approaches in different AD models, which are our next focus. Additionally, we also attempted to combine the indicators of Density, mVD and VSI obtained by vessel size imaging to detect the altered pattern of microvascular density and morphology in human patients at the early stage of AD.
Together, our data show that the late stage (20-month) of AD progression in APP23 mice is associated with decreased Density of cerebral microvessels, increased vascular dilatation, and vascular diameter enlargement. In addition, our results demonstrate that the hippocampus is the most susceptible cerebral region in AD, and can be regarded as the critical area for monitoring the microvascular changes in AD. Our study provides novel imaging biomarkers for the early detection of AD, and for evaluating the therapeutic effects of vascular targeted therapy in AD.
Materials and Methods
Animals
APP23 transgenic mice were provided by the Neurodegenerative Disorder Research Center, School of Life Sciences Material Science at Microscale National Laboratory, University of Science and Technology of China. APP23 mice contain a human amyloid precursor protein (APP751) cDNA with the Swedish double mutation at position 670/671 driven by the neuron-specific Thy-1 promoter [34], resulting in their seven-fold higher APP expression compared to the endogenous murine APP. APP23 mice suffer from dual impacts of vascular injury and Aβ deposition [35], which is characterized by vascular pathological changes and amyloid deposition in the blood vessels [22]. All mice were kept under a 12/12 h light/dark cycle, fed standard food, and had access to water ad libitum. Twenty-five heterozygote mice and twenty-five corresponding wild type (WT) mice were bred to reach a final study cohort of 50 mice. Both APP23 mice and WT mice were divided into five groups (n = 5 each), and analyzed at the age of 3, 6, 9, 14, and 20 months. No further inclusion or exclusion criteria were applied. The animal experiments were approved by the local Animal Ethics Committee and carried out in strict compliance with the National Institutes of Health Guidelines for Care and Use of Laboratory Animals.
Magnetic resonance imaging (MRI)
All MRI experiments were performed on a horizontal 9.4 T/400 mm wide bore scanner (Agilent Technologies, Inc., Santa Clara, CA, USA), using a volume radiofrequency (RF) coil. Mice were anesthetized with isoflurane (3.5% induction, 1.0%-1.5% maintenance) in air/O2 (2:1) during scanning, and a catheter was placed in the tail vein. The respiratory rate and rectal temperature were monitored throughout the experiment with a physiologic monitoring unit (model 1030; SA Instruments, Inc., Stony Brook, NY, USA).
T2* weighted imaging (T2* WI) was obtained from the gradient-echo (GRE) MRI sequence, and the parameters were listed as follows: repetition time (TR) = 500 ms; echo time (TE) = 2.6, 6.52, 10.44, 14.36, and 18.28 ms; field of view (FOV) = 16 × 16 mm2; matrix size = 192 × 192; slice thickness = 1 mm (10 slices, gap = 0); 2 averages; and bandwidth (BW) = 100 kHz. T2 weighted imaging (T2 WI) was obtained from the spin-echo (SE) MRI sequence, and the parameters were listed as follows: TR = 3500 ms; eight evenly spaced spin-echoes = [9.45–75.58] ms; FOV = 16 × 16 mm2; matrix size = 192 × 192; slice thickness = 1 mm (10 slices, gap = 0); 2 averages; and BW = 50 kHz. Additionally, the apparent diffusion coefficient (ADC) map was obtained from a 12-directional diffusion-weighted imaging (DWI) sequence with b = 900 s/mm2 and a reference image (b ≈ 0 s/mm2) (TR = 3000 ms; TE = 27 ms; number of excitations (NEX) = 2; matrix = 192 × 192; FOV = 16 × 16 mm2; slice thickness = 1 mm (10 slices, gap = 0); BW = 50 kHz). Repeated gradient-echo and spin-echo MRI sequence scans were acquired after the injection of ultra-small superparamagnetic iron oxide (USPIO) contrast agent (Shanghai So-Fe Biomedical Co., Ltd.) via the tail vein over approximately 5 min. A dose of 0.02 mL per g of body weight was injected at a speed of 0.02 mL/s. The total MRI session lasted 1 h 20 min per animal.
Data processing
Region of interest
The ImageJ software was used to outline the brain region mask, excluding the skin and skull, on T2 weighted imaging (T2WI). Mask calibration was performed using the Matrix Laboratory (MATLAB) (Mathworks, Natwick, Massachusetts, USA). Two regions of interests (ROIs: cortex and hippocampus) were delineated on T2WI. Each ROI, delineated on T2WI, was transferred onto the T2*WI, ADC, ΔR2,
ΔR2, the change in the transverse relaxation rate R2, was derived from the T2 maps pre- and post-USPIO injection as follows:
For each ROI, the ADC,
Density was computed as follows:
The VSI was computed as follows:
The ADC was computed as the mean of the ADCs observed in the 12 directions of the gradient system. Furthermore, B0 represented the static magnetic field with the value of 9.4 T; γ represented the gyromagnetic ratio of the protons, and the gyromagnetic ratio of hydrogen protons was 42.58 MHz/T; Δχ was considered equal to 0.57 ppm. The unanalyzed voxels (i.e., non-converging fit and values outside the range of validity (ADC > 3,000 μm2/s; ΔR2 ≤ 0;
Statistical analysis
All results were expressed as the mean ± standard deviation. Paired Student’s t-tests were used for the comparisons between the cortex and hippocampus, along with APP23 and WT mice. The longitudinal assessment of microvascular characteristics, including the mVD, density, and VSI, were evaluated with Analysis of Variance (ANOVA).
Author Contributions
Xiaowen Xu, Tong Meng, Kai Zhong and Yong Shen designed the study. Xiaowen Xu, Mengling Tao and Qingqing Wen performed MRI scans and data processing. Xiaowen Xu and Tong Meng prepared and compiled the draft for initial review and incorporated all suggested edits into the final draft. Peijun Wang, Yong Shen and Kai Zhong completed an initial review and provided significant edits and additional content before review and approval of other authors. All authors approved the final manuscript.
Conflicts of Interest
The authors have no conflicts of interest.
Funding
This study was supported by National Key R&D Program of China (2016YFC1305500, 2016YFC1300500-3); National Natural Science Foundation of China (No. 61471399, No. 61671479, No. U1604284, No. 81670663, No. 81830059, No. 81571655, No. 81771889, 91649101); Shanghai Municipal Commission of Health and Family Planning Smart Medical Special Research Project (No. 2018ZHYL0105); Strategic Priority Research Program of the Chinese Academy of Sciences (XDBS01030200).
References
- 1. Nicoll JA, Buckland GR, Harrison CH, Page A, Harris S, Love S, Neal JW, Holmes C, Boche D. Persistent neuropathological effects 14 years following amyloid-β immunization in Alzheimer’s disease. Brain. 2019; 142:2113–26. https://doi.org/10.1093/brain/awz142 [PubMed]
- 2. Blennow K, de Leon MJ, Zetterberg H. Alzheimer’s disease. Lancet. 2006; 368:387–403. https://doi.org/10.1016/S0140-6736(06)69113-7 [PubMed]
- 3. Blennow K, Mattsson N, Schöll M, Hansson O, Zetterberg H. Amyloid biomarkers in Alzheimer’s disease. Trends Pharmacol Sci. 2015; 36:297–309. https://doi.org/10.1016/j.tips.2015.03.002 [PubMed]
- 4. Østergaard L, Engedal TS, Moreton F, Hansen MB, Wardlaw JM, Dalkara T, Markus HS, Muir KW. Cerebral small vessel disease: capillary pathways to stroke and cognitive decline. J Cereb Blood Flow Metab. 2016; 36:302–25. https://doi.org/10.1177/0271678X15606723 [PubMed]
- 5. Miners JS, Schulz I, Love S. Differing associations between Aβ accumulation, hypoperfusion, blood-brain barrier dysfunction and loss of PDGFRB pericyte marker in the precuneus and parietal white matter in Alzheimer’s disease. J Cereb Blood Flow Metab. 2018; 38:103–15. https://doi.org/10.1177/0271678X17690761 [PubMed]
- 6. Miners JS, Kehoe PG, Love S, Zetterberg H, Blennow K. CSF evidence of pericyte damage in Alzheimer’s disease is associated with markers of blood-brain barrier dysfunction and disease pathology. Alzheimers Res Ther. 2019; 11:81. https://doi.org/10.1186/s13195-019-0534-8 [PubMed]
- 7. Troprès I, Grimault S, Vaeth A, Grillon E, Julien C, Payen JF, Lamalle L, Décorps M. Vessel size imaging. Magn Reson Med. 2001; 45:397–408. https://doi.org/10.1002/1522-2594(200103)45:3<397::aid-mrm1052>3.0.co;2-3 [PubMed]
- 8. Xu C, Schmidt WU, Villringer K, Brunecker P, Kiselev V, Gall P, Fiebach JB. Vessel size imaging reveals pathological changes of microvessel density and size in acute ischemia. J Cereb Blood Flow Metab. 2011; 31:1687–95. https://doi.org/10.1038/jcbfm.2011.38 [PubMed]
- 9. Kiselev VG, Strecker R, Ziyeh S, Speck O, Hennig J. Vessel size imaging in humans. Magn Reson Med. 2005; 53:553–63. https://doi.org/10.1002/mrm.20383 [PubMed]
- 10. Pannetier N, Lemasson B, Christen T, Tachrount M, Troprès I, Farion R, Segebarth C, Rémy C, Barbier EL. Vessel size index measurements in a rat model of glioma: comparison of the dynamic (gd) and steady-state (iron-oxide) susceptibility contrast MRI approaches. NMR Biomed. 2012; 25:218–26. https://doi.org/10.1002/nbm.1734 [PubMed]
- 11. Lemasson B, Valable S, Farion R, Krainik A, Rémy C, Barbier EL. In vivo imaging of vessel diameter, size, and density: a comparative study between MRI and histology. Magn Reson Med. 2013; 69:18–26. https://doi.org/10.1002/mrm.24218 [PubMed]
- 12. Schmainda KM, Rand SD, Joseph AM, Lund R, Ward BD, Pathak AP, Ulmer JL, Badruddoja MA, Krouwer HG. Characterization of a first-pass gradient-echo spin-echo method to predict brain tumor grade and angiogenesis. AJNR Am J Neuroradiol. 2004; 25:1524–32. [PubMed]
- 13. Sturchler-Pierrat C, Staufenbiel M. Pathogenic mechanisms of Alzheimer’s disease analyzed in the APP23 transgenic mouse model. Ann N Y Acad Sci. 2000; 920:134–39. https://doi.org/10.1111/j.1749-6632.2000.tb06915.x [PubMed]
- 14. Mahler J, Morales-Corraliza J, Stolz J, Skodras A, Radde R, Duma CC, Eisele YS, Mazzella MJ, Wong H, Klunk WE, Nilsson KP, Staufenbiel M, Mathews PM, et al. Endogenous murine Aβ increases amyloid deposition in APP23 but not in APPPS1 transgenic mice. Neurobiol Aging. 2015; 36:2241–47. https://doi.org/10.1016/j.neurobiolaging.2015.03.011 [PubMed]
- 15. Tang M, Ryman DC, McDade E, Jasielec MS, Buckles VD, Cairns NJ, Fagan AM, Goate A, Marcus DS, Xiong C, Allegri RF, Chhatwal JP, Danek A, et al, and Dominantly Inherited Alzheimer Network (DIAN). Neurological manifestations of autosomal dominant familial Alzheimer’s disease: a comparison of the published literature with the dominantly inherited Alzheimer network observational study (DIAN-OBS). Lancet Neurol. 2016; 15:1317–25. https://doi.org/10.1016/S1474-4422(16)30229-0 [PubMed]
- 16. Parnetti L, Chipi E, Salvadori N, D’Andrea K, Eusebi P. Prevalence and risk of progression of preclinical Alzheimer’s disease stages: a systematic review and meta-analysis. Alzheimers Res Ther. 2019; 11:7. https://doi.org/10.1186/s13195-018-0459-7 [PubMed]
- 17. van de Haar HJ, Burgmans S, Hofman PA, Verhey FR, Jansen JF, Backes WH. Blood-brain barrier impairment in dementia: current and future in vivo assessments. Neurosci Biobehav Rev. 2015; 49:71–81. https://doi.org/10.1016/j.neubiorev.2014.11.022 [PubMed]
- 18. Weller RO, Boche D, Nicoll JA. Microvasculature changes and cerebral amyloid angiopathy in Alzheimer’s disease and their potential impact on therapy. Acta Neuropathol. 2009; 118:87–102. https://doi.org/10.1007/s00401-009-0498-z [PubMed]
- 19. Brown WR, Thore CR. Review: cerebral microvascular pathology in ageing and neurodegeneration. Neuropathol Appl Neurobiol. 2011; 37:56–74. https://doi.org/10.1111/j.1365-2990.2010.01139.x [PubMed]
- 20. Fischer VW, Siddiqi A, Yusufaly Y. Altered angioarchitecture in selected areas of brains with Alzheimer’s disease. Acta Neuropathol. 1990; 79:672–79. https://doi.org/10.1007/BF00294246 [PubMed]
- 21. Maier FC, Keller MD, Bukala D, Bender B, Mannheim JG, Brereton IM, Galloway GJ, Pichler BJ. Quantification of β-amyloidosis and rCBF with dedicated PET, 7 T MR imaging, and high-resolution microscopic MR imaging at 16.4 T in APP23 mice. J Nucl Med. 2015; 56:1593–99. https://doi.org/10.2967/jnumed.115.159350 [PubMed]
- 22. Klohs J, Rudin M, Shimshek DR, Beckmann N. Imaging of cerebrovascular pathology in animal models of Alzheimer’s disease. Front Aging Neurosci. 2014; 6:32. https://doi.org/10.3389/fnagi.2014.00032 [PubMed]
- 23. Ambrose CT. The role of capillaries in the lesser ailments of old age and in Alzheimer’s disease and vascular dementia: the potential of pro-therapeutic angiogenesis. J Alzheimers Dis. 2016; 54:31–43. https://doi.org/10.3233/JAD-160303 [PubMed]
- 24. Guo Y, Zhang Q, Chen H, Jiang Y, Gong P. Overexpression of calcitonin gene-related peptide protects mouse cerebral microvascular endothelial cells from high-glucose-induced damage via ERK/HIF-1/VEGF signaling. J Physiol Sci. 2019; 69:939–52. https://doi.org/10.1007/s12576-019-00708-2 [PubMed]
- 25. Harris R, Miners JS, Allen S, Love S. VEGFR1 and VEGFR2 in Alzheimer’s disease. J Alzheimers Dis. 2018; 61:741–52. https://doi.org/10.3233/JAD-170745 [PubMed]
- 26. Pang Q, Zhang H, Chen Z, Wu Y, Bai M, Liu Y, Zhao Y, Tu F, Liu C, Chen X. Role of caveolin-1/vascular endothelial growth factor pathway in basic fibroblast growth factor-induced angiogenesis and neurogenesis after treadmill training following focal cerebral ischemia in rats. Brain Res. 2017; 1663:9–19. https://doi.org/10.1016/j.brainres.2017.03.012 [PubMed]
- 27. Zhao Q, Niu Y, Matsumoto K, Tsuneyama K, Tanaka K, Miyata T, Yokozawa T. Chotosan ameliorates cognitive and emotional deficits in an animal model of type 2 diabetes: possible involvement of cholinergic and VEGF/PDGF mechanisms in the brain. BMC Complement Altern Med. 2012; 12:188. https://doi.org/10.1186/1472-6882-12-188 [PubMed]
- 28. Meyer EP, Ulmann-Schuler A, Staufenbiel M, Krucker T. Altered morphology and 3D architecture of brain vasculature in a mouse model for Alzheimer’s disease. Proc Natl Acad Sci USA. 2008; 105:3587–92. https://doi.org/10.1073/pnas.0709788105 [PubMed]
- 29. Dennie J, Mandeville JB, Boxerman JL, Packard SD, Rosen BR, Weisskoff RM. NMR imaging of changes in vascular morphology due to tumor angiogenesis. Magn Reson Med. 1998; 40:793–99. https://doi.org/10.1002/mrm.1910400602 [PubMed]
- 30. Merlini M, Wanner D, Nitsch RM. Tau pathology-dependent remodelling of cerebral arteries precedes Alzheimer’s disease-related microvascular cerebral amyloid angiopathy. Acta Neuropathol. 2016; 131:737–52. https://doi.org/10.1007/s00401-016-1560-2 [PubMed]
- 31. Beckmann N, Schuler A, Mueggler T, Meyer EP, Wiederhold KH, Staufenbiel M, Krucker T. Age-dependent cerebrovascular abnormalities and blood flow disturbances in APP23 mice modeling Alzheimer’s disease. J Neurosci. 2003; 23:8453–59. https://doi.org/10.1523/JNEUROSCI.23-24-08453.2003 [PubMed]
- 32. Burke MJ, Nelson L, Slade JY, Oakley AE, Khundakar AA, Kalaria RN. Morphometry of the hippocampal microvasculature in post-stroke and age-related dementias. Neuropathol Appl Neurobiol. 2014; 40:284–95. https://doi.org/10.1111/nan.12085 [PubMed]
- 33. Munder T, Pfeffer A, Schreyer S, Guo J, Braun J, Sack I, Steiner B, Klein C. MR elastography detection of early viscoelastic response of the murine hippocampus to amyloid β accumulation and neuronal cell loss due to Alzheimer’s disease. J Magn Reson Imaging. 2018; 47:105–14. https://doi.org/10.1002/jmri.25741 [PubMed]
- 34. Calhoun ME, Burgermeister P, Phinney AL, Stalder M, Tolnay M, Wiederhold KH, Abramowski D, Sturchler-Pierrat C, Sommer B, Staufenbiel M, Jucker M. Neuronal overexpression of mutant amyloid precursor protein results in prominent deposition of cerebrovascular amyloid. Proc Natl Acad Sci USA. 1999; 96:14088–93. https://doi.org/10.1073/pnas.96.24.14088 [PubMed]
- 35. Sasaguri H, Nilsson P, Hashimoto S, Nagata K, Saito T, De Strooper B, Hardy J, Vassar R, Winblad B, Saido TC. APP mouse models for Alzheimer’s disease preclinical studies. EMBO J. 2017; 36:2473–87. https://doi.org/10.15252/embj.201797397 [PubMed]