


Introduction
Lung cancer has the highest incidence and mortality among all types of cancers. Non-small cell lung cancer (NSCLC) is the most common clinical subtype of lung cancer and lung adenocarcinoma is the most common histological subtype in NSCLC [1]. Despite recent advances in cancer therapeutic strategies, patients with NSCLC exhibit a poor 5-year survival rate (approximately 15%) [2], because it is usually diagnosed at an advanced stage and accompanied with aggressive local invasion, regional lymph node and distant metastasis [3]. Therefore, novel and effective therapies against lung cancer are still urgently needed.
Homeobox genes (HOX) have emerged as a novel class regulators of lung cancer. In particular, HOXC10 has been reported to promote progression of various types of cancer, such as breast cancer [4]. Homeobox genes encode transcription factors that bind to the promoters of various target genes through their homeodomain and play critical roles in cell differentiation and embryonic development [5]. In humans, there are four HOX clusters (A-D) located on four chromosomes (7, 17, 12 and 2, respectively). HOXC10 is a member of the HOXC cluster and contributes to the development of several types of cancers, including glioma, breast cancer, osteosarcoma, and thyroid cancer [6–9]. However, little is known about HOXC10’s expression and function in lung cancer. Methylation of cytosine in CpG dinucleotides within CpG islands located in gene promoters is a well-characterized epigenetic modification that regulates gene expression and consequently many cellular processes, including development and tumorigenesis [10]. Previous studies have shown that CpG islands are often enriched with G-quadruplex-forming sequences (G4s) [11]. G4s are stacks of G-quartets linked by loops, and the classical G4 forming sequence motifs comprise four tracts of two or more consecutive Gs separated by loop nucleotides. G4s play a crucial role in gene transcription and regulation. For example, G4 formation within the promoters of several oncogenes has been shown to suppress transcription of oncogenes such as c-MYC, KRAS, BCL-2, and WNT1 genes [12–15]. However, several studies also revealed that G-quadruplex structures in promoters up-regulated gene expression, such as RELAXIN and OCT4 [16, 17].
In this study, we assessed the expression of HOXC10 in human NSCLC cell lines and analyzed the functions of HOXC10 in tumor progression in vitro and in vivo. In addition, we focused on the molecular mechanisms that mediate upregulation of HOXC10 expression in NSCLC cells. We examined role of cytosine methylation and the formation of G-quadruplex in the HOXC10 promoter in upregulating HOXC10 gene expression. Our data collectively indicate an important role for HOXC10 in NSCLC cells and suggest HOXC10 as a potential therapeutic target.
Results
Elevated expression of HOXC10 in lung adenocarcinoma cells
We profiled transcriptomes of two human NSCLC cell lines, A549 that is well-differentiated with type II alveolar features, and NCI-H23 that is aggressive with mesenchymal features. A549 cells are abundant with epithelial markers and lack invasive ability, whereas NCI-H23 cells are low in epithelial markers and high in mesenchymal makers as reported by others and shown in our own RNA-SEQ data [18, 19]. The differentially expressed genes between two cell lines were defined as the genes with a greater than 2-fold difference and a false discovery value smaller than 0.01 as determined by EbSeq. We noticed that the differentially expressed genes included a large number of HOX genes that are critical regulators of development and cancer (Figure 1A) [20]. HOXC10 drew our attention because its expression was higher in the aggressive NCI-H23 cells than the well-differentiated A549 cells. Moreover, a recent report suggests it regulates cell death and sensitive to therapy in breast cancer [21]. We confirmed the robust expression of HOXC10 in NCI-H23 and modest expression of HOXC10 in A549 cells by qRT-PCR and immunoblotting (Figure 1B, 1C). We then interrogated the expression of HOXC10 in the RNA-SEQ data set of the TCGA Lung Adenocarcinoma cohort. we applied the default parameters set by cBIOPORTAL. “Elevated expression” and “No change” are defined based on whether HOXC10 expression is higher than 2 x Z scores in a sample. The patients with elevated expression of HOXC10 as defined by a Z-score greater than 2 using cBioportal analysis exhibited a trend of shorter overall survival and shorter disease free status than the patients without elevation of HOXC10, although the difference is slightly short of reaching statistical significance (Figure 1D, 1E).
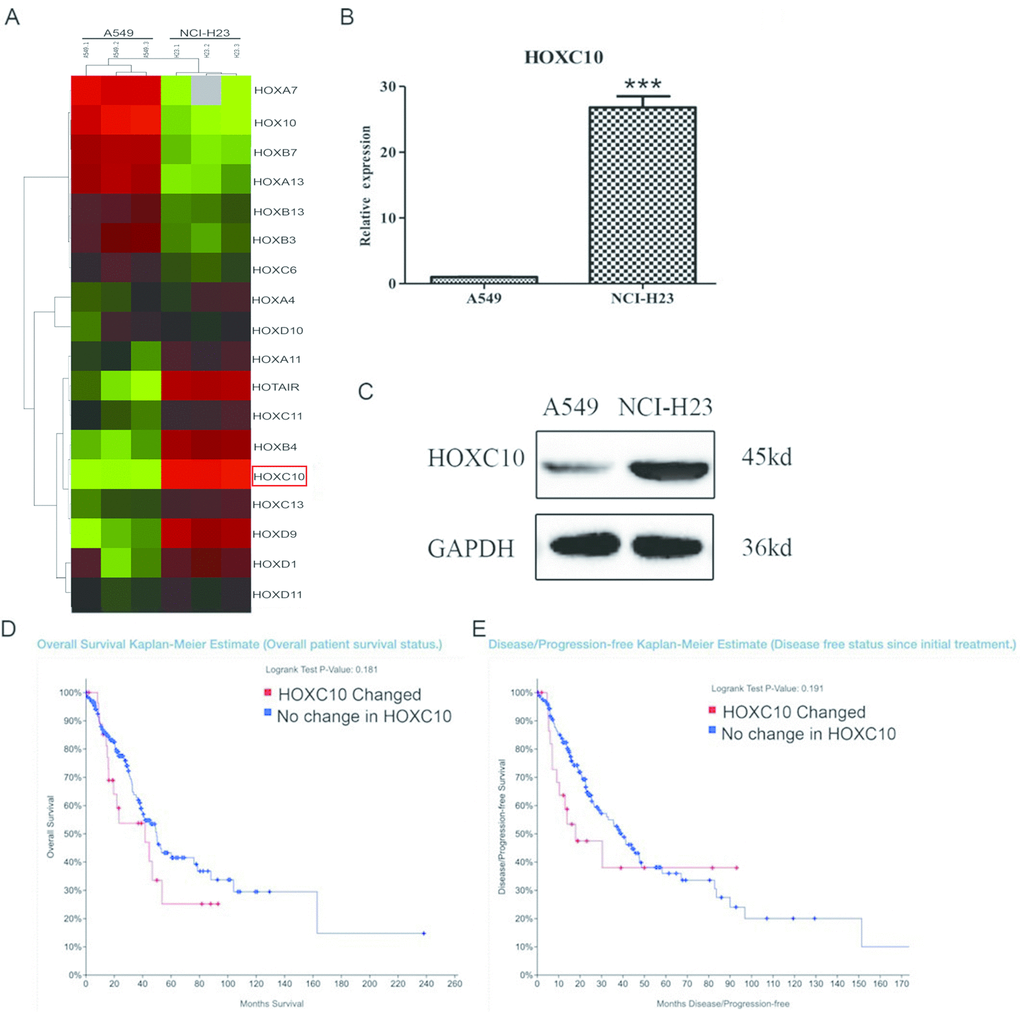
Figure 1. Expression of HOXC10 in lung adenocarcinoma cells. (A) Total cell RNA was extracted from A549 and NCI-H23 cells. The transcriptomes from A549 and NCI-H23 cells were obtained and compared using RNA-SEQ. The differentially expressed HOX genes were illustrated in heatmap. HOXC10 was marked by a red rectangle. (B) Similar to part A except that the RNA levels of HOXC10 were measured and compared between A549 and NCI-H23 cells using qRT-PCR. A fold change was obtained by normalizing to the housekeeping gene RPLP0 and setting the values from the DMSO control group to one. (C) Total protein was extracted from A549 and NCI-H23 cells. Immunoblotting was used to assess and compare the protein levels of HOXC10 between A549 and NCI-H23 cells. GAPDH was measured as a loading control. (D) Overall survival rate was compared between the patients with increase in HOXC10 expression and the rest patients in the TCGA Lung Adenocarcinoma cohort. (E) Diseases free status was compared between the patients with increase in HOXC10 expression and the rest patients in the TCGA Lung Adenocarcinoma cohort. When presented, means and standard deviations were obtained from at least 3 independent experiments. *** indicates a P value < 0.001.
Promotion of cell growth by overexpression of HOXC10 in A549 cells
To determine whether HOXC10 plays a critical role in cell viability, we overexpressed HOXC10 in the HOXC10 low A549 cells by inserting the human HOXC10 gene coding region into the pCDH backbone vector and transducing A549 cells with either the HOXC10 overexpressing lentiviral vector or the backbone control. We confirmed successful overexpression of HOXC10 by qRT-PCR and immunoblotting (Figure 2A, 2B). We then compared cell viability between control and HOXC10 overexpression A549 cells using MTT assays. As expected, the HOXC10 overexpressing A549 cells exhibited an 15% increase in cell viability over the control A549 cells as indicated by MTT assays (Figure 2C). We then questioned whether increased cell viability shown in MTT assays was associated with a decrease in apoptosis. We measured apoptosis using Annexin V-FITC Apoptosis Detection Kit. Indeed, overexpression of HOXC10 caused a 22% decrease in apoptosis (Figure 2D). Next, we examined the levels of several apoptosis associated proteins by western blot. As shown in Figure 2E, the protein level of Bax was decreased in A549 cells upon HOXC10 overexpression when compared with vector control A549 cells, whereas the protein level of Bcl-2 increased. These results suggest that overexpression of HOXC10 is sufficient to convey increased cell viability in the HOXC10 low A549 cells.
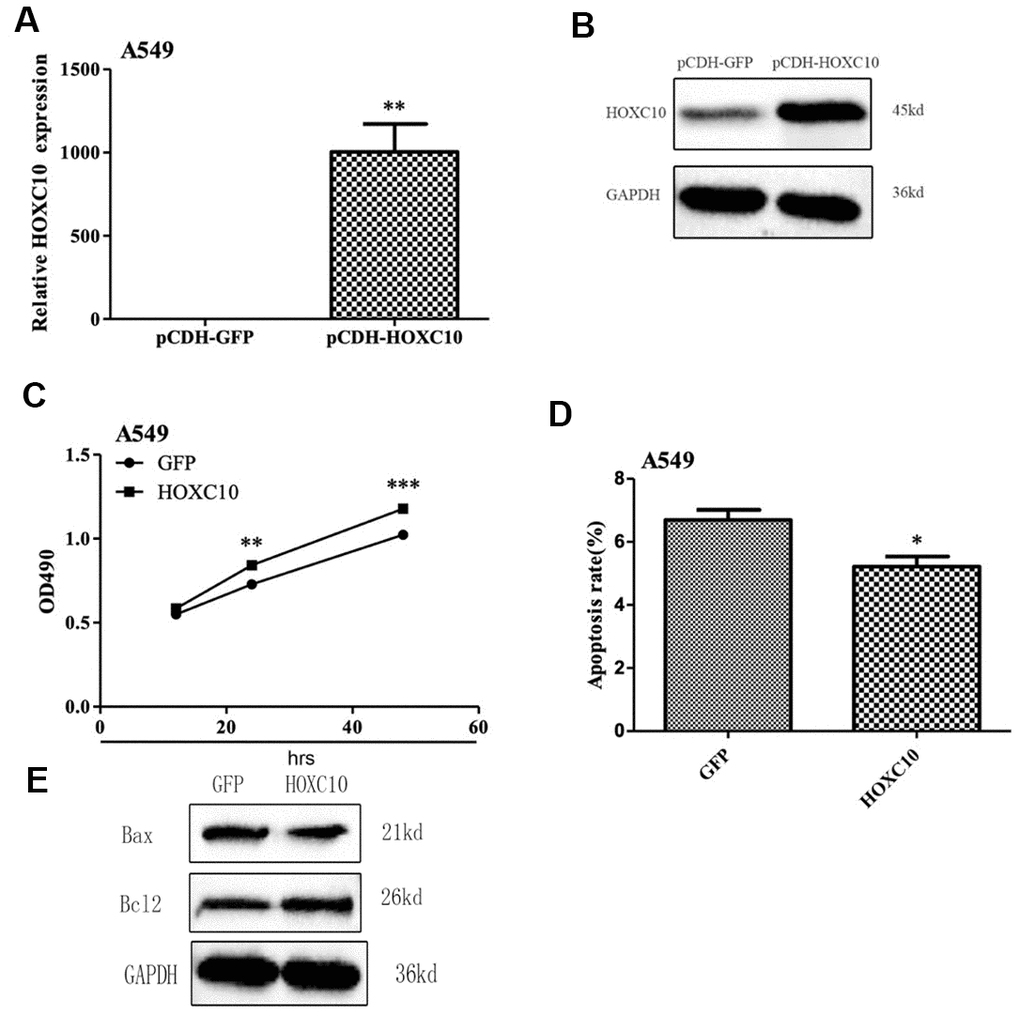
Figure 2. Promotion of cell growth by overexpression of HOXC10 in A549 cells. (A) A549 cells that stabily overexpress HOXC10 (pCDH_HOXC10) or control (pCDH_GFP) were generated as described in Methods. Total RNA was extracted and RNA levels of HOXC10 were assessed using qRT-PCR. A fold change was obtained by normalizing to the house keeping gene GAPDH and setting the values from the negative control pCDH_GFP to one. (B) Similar to part A except that the protein levels of HOXC10 were assessed using immnoblotting. (C) Similar to part A except that cell viability was measured using MTT assays. A fold change of the MTT values was obtained by setting the values from the negative control pCDH_GFP to one. (D) Similar to part A except that apoptosis was measured using Annexin V-FITC. Percentage of apoptotic cells were compared among the groups. (E) The expression of apoptosis related proteins in A549 cells with pCDH_HOXC10 or control transfected was measured by western blot analysis. When presented, means and standard deviations were obtained from at least 3 independent experiments. *, **, and *** indicate a P value < 0.05, 0.01, and 0.001, respectively.
Inhibition of cell growth by knockdown of HOXC10 in NCI-H23 cells
We also transfected the siRNA targeting HOXC10 mRNA into HOXC10 high NCI-H23 cells. As illustrated in Figure 3A, 3B, the mRNA and protein levels of HOXC10 were remarkably decreased in the siRNA3 transfected groups as compared to the control groups. Furthermore, MTT assay showed that knockdown of HOXC10 significantly decreased cell viability by 30% in NCI-H23 cells compared with the control groups (Figure 3C). We also performed Annexin V-FITC assay to evaluate the function of HOXC10 on apoptosis in NCI-H23 cells. As shown in Figure 3D, flow cytometry analysis revealed that knockdown of HOXC10 in NCI-H23 cell induced a 61.8% increase in apoptosis when compared with the control groups (Figure 3D). Meanwhile, Knockdown of HOXC10 led to decreased protein level of Bcl-2 and increased protein level of Bax in NCI-H23 cells as compared with control cells (Figure 3E).
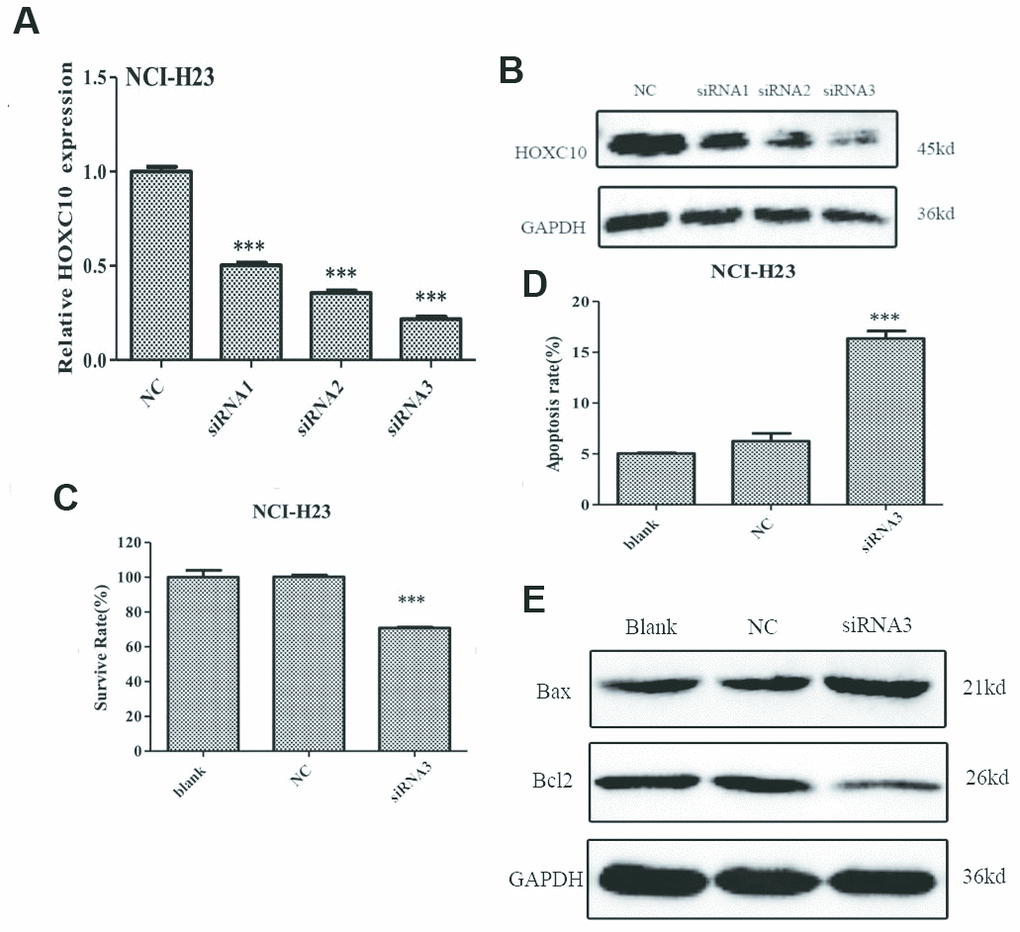
Figure 3. Inhibition of cell growth by knockdown of HOXC10 in NCI-H23 cells. (A) The HOXC10-specific siRNAs (siRNA 1-3) or negative control siRNA (NC) were transfected into NCI-H23 cells. Total RNA was extracted and RNA levels of HOXC10 were assessed using qRT-PCR. A fold change was obtained by normalizing to the house keeping gene GAPDH and setting the values from the negative control siRNA (NC) transfected group to one. (B) Similar to part A except that the protein levels of HOXC10 were assessed using immnoblotting. (C) Similar to part A except that cell viability was measured using MTT assays. A fold change of the MTT values was obtained by setting the values from the negative control siRNA (NC) transfected group one. (D) Similar to part A except that apoptosis was measured using Annexin V-FITC. Percentage of apoptotic cells were compared among the groups. (E) The expression of apoptosis related proteins in NCI-H23 cells with HOXC10-specific siRNA3 or negative control siRNA transfected was measured by western blot analysis. When presented, means and standard deviations were obtained from at least 3 independent experiments. *** indicates a P value < 0.001.
Promotion of tumor growth in mice by overexpression of HOXC10 in A549 cells
We then determined whether HOXC10 regulates growth of NSCLC cells in vivo. The A549 variant with stable overexpression of HOXC10 as demonstrated in Figure 2 and the backbone control variant were implanted into nude mice. Tumor growth were monitored weekly by measuring the volume and compared to the backbone control. Indeed, the HOXC10 overexpressing A549 tumors exhibited accelerated growth when compared to the control group (Figure 4A). The size difference in tumors between two groups were further illustrated in the tumors dissected from the implanted mice (Figure 4B). These findings suggest that HOXC10 promote growth of NSCLC cells in vitro and in vivo.
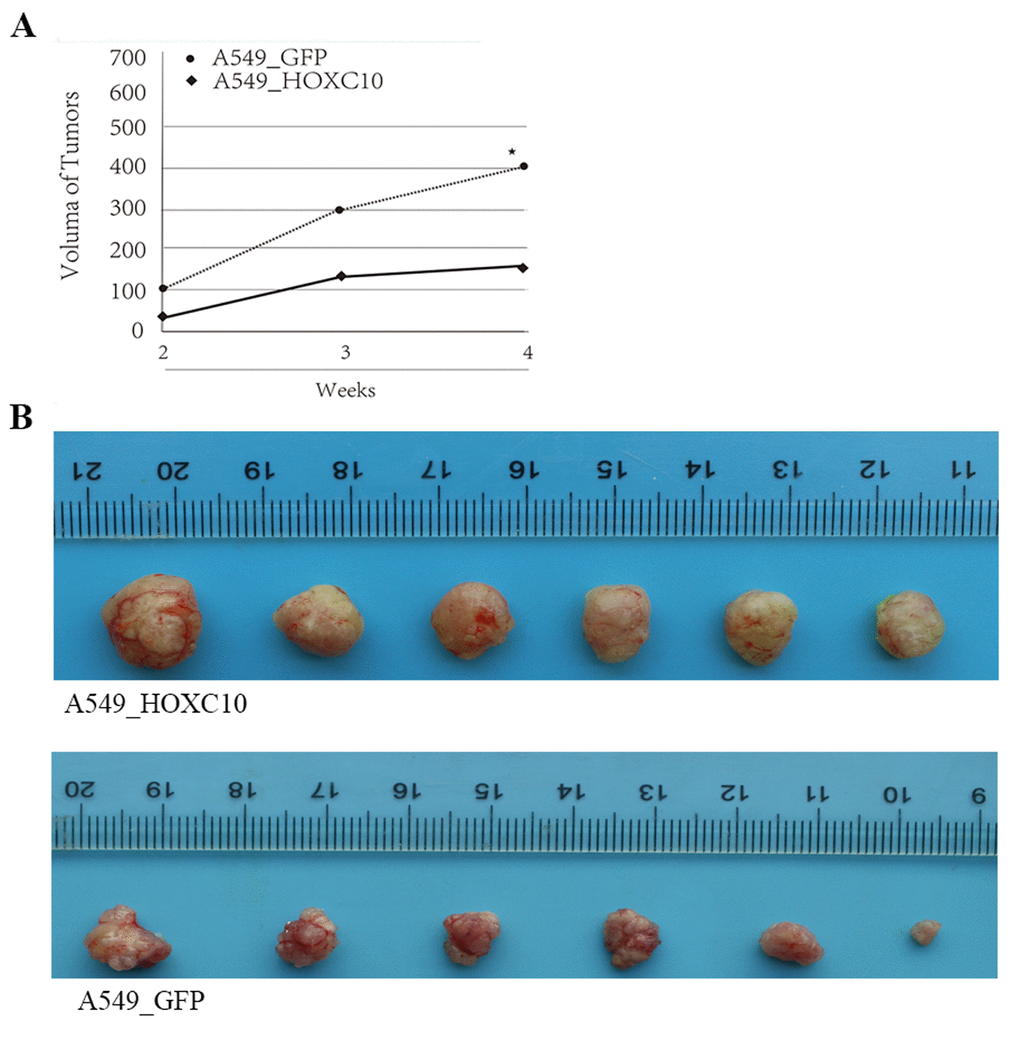
Figure 4. Promotion of tumor growth in mice by overexpression of HOXC10 in A549 cells. (A) A549 cells that stably overexpress HOXC10 (A549_HOXC10) or control (A549_GFP) were grafted into the flank of nude mice as described in the section of Materials and Methods. Volumes of the tumors formed by A549_HOXC10 and A549_GFP monitored from week 2 to week 4. Growth curves were illustrated. (B) The tumors were dissected and recorded on week 4 post inoculation. * indicates a P value < 0.05.
Epigenetic regulation of HOXC10 expression in NSCLC cells
We aimed to understand how HOXC10 is up-regulated in NSCLC cells. We noticed a CpG island that spans through the promoter, first exon, and first intron of the HOXC10 gene. Cytosine methylation in gene promoters has been linked to transcription repression [22]. Thus, we searched for a link between HOXC10 expression and cytosine methylation in the HOXC10 promoter associated CpG island from the the Cancer Cell Line Encyclopedia (CCLE) data set. We interrogated Methylation SEQ data from CCLE. We compared methylation profiles in the HOXC10 CpG island between A549 and NCI-H23 cells. Indeed, the HOXC10 CpG island exhibited hypermethylation in A549 cells relative to that in NCI-H23 (Supplementary Figure 1). Thus, an inverse correlation between HOXC10 expression and methylation was observed in A549 and NCI-H23 cells. To validate inverse correlation between methylation and expression of HOXC10 in A549 and NCI-H23 cells, we employed methylation-specific PCR to assess cytosine methylation in the HOXC10 associated CpG island [23]. The methylation-specific PCR products of the HOXC10 CpG island identified by BS-SEQ was around 50% in NCI-H23 cells of that in A549 cells (Figure 5A). In contrast the unmethylation-specific PCR products were higher in NCI-H23 cells than in A549 cells (Figure 5A). We then questioned whether inhibition of cytosine methylation was sufficient to increase HOXC10 expression in A549 cells. We treated A549 cells with a DNMT inhibitor, 5’Aza (1 μM) for 72 hrs. The mRNA levels of HOXC10 were stimulated to a 3.5-fold increase by 5-Aza-CdR over the vehicle DMSO treated group in A549 cells (Figure 5B). These findings indicate a critical role for cytosine methylation in upregulation of HOXC10 expression in NSCLC cells.
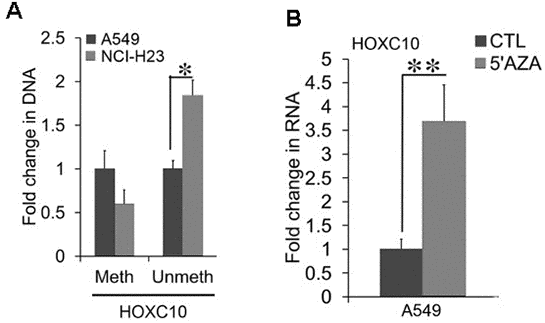
Figure 5. Association between CpG methylation and the expression of HOXC10. (A) Total cell DNA was extracted from A549 and NCI-H23 cell cultures. Cytosine methylation in the HOXC10 CpG island was compared between two culture conditions using bisulfite treatment coupled with methylation-specific qPCR. A fold change of the methylated and unmethylated PCR products were obtained by setting the values from 2D culture to one. (B) Total cell RNA was extracted from A549 cells exposed to either a DNMT inhibitor, 5-Aza-CdR (1 μM) or DMSO for 72 hrs. The RNA levels of HOXC10 were measured using qRT-PCR. A fold change was obtained by normalizing to the housekeeping gene RPLP0 and setting the values from the DMSO group to one. When presented, means and standard deviations were obtained from at least 3 independent experiments. * and ** indicate a P value < 0.05 and 0.01, respectively.
G-quadruplex-mediated regulation of HOXC10
CpG islands are frequently enriched with G4s [11]. Thus, we searched for G4 motifs in the HOXC10 CpG island using QGRS Mapper, an algorithm that identifies G4 forming sequences [24]. We identified a G4 motif in the HOXC10 CpG island using the formula [G3N1–7G3N1–7 G3N1–7 G3] (Figure 6A). Formation of G-quadruplex by the G4 motif in the HOXC10 CpG island was supported by survey of a recent genome wide sequencing of G4 formation by ChIP assays with a G4-specific antibody BG4 coupled with next generation sequencing (BG4 ChIP-SEQ) (SRA# SRP068243) [25]. A BG4 ChIP peak that was called in the HOXC10 CpG island harbored the G4 motif identified by QGRS Mapper (Figure 6B). We then employed BG4 ChIP to compare G4 formation in the HOXC10 CpG island between A549 and NCI-H23 cells (Figure 6C). Indeed, the BG4 ChIP signal in the G4 harboring region was higher in the HOXC10 high NCI-H23 cells than the HOXC10 low A549 cells (Figure 6C).
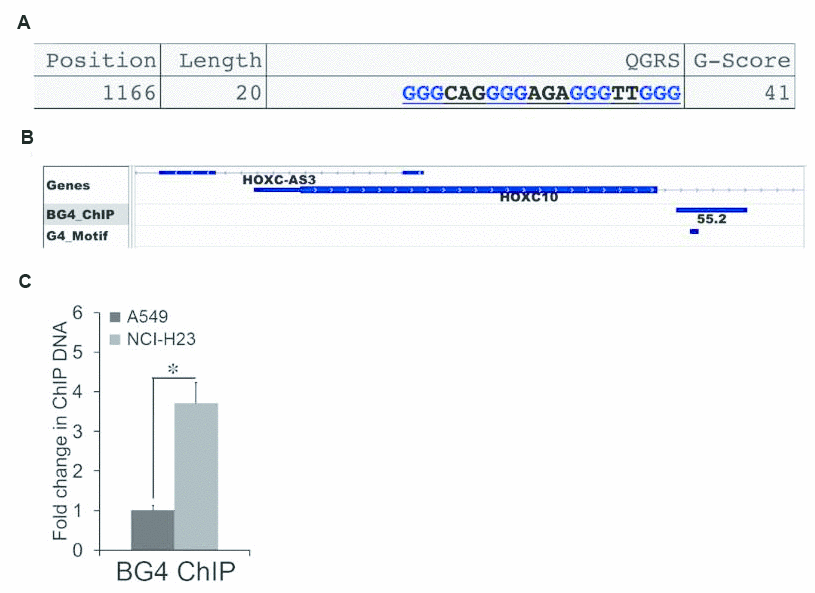
Figure 6. Association between G-quadruplex and the expression of HOXC10. (A) One G4 motif was identified by QGRS Mapper in the HOXC10 CpG island. The sequences, length, and position of the G4 motif were illustrated. (B) The BED file of a genome-wide profiling of G4 formation using BG4-ChIP SEQ was extracted and analyzed. The G4 track was visualized using IGV Genome Browser. The G4 peak called within the HOXC10 CpG island was illustrated. The G4 motif identified by QGRS was marked within the G4 peak. (C) Formation of G4 within the HOXC10 CpG island was assessed by ChIP assays using a G4-specific antibody BG4 in A549 and NCI-H23 cells. A fold change of the BG4 associated G4 region in NCI-H23 cells over A549 cells was obtained by setting the values from 2D culture to one. When presented, means and standard deviations were obtained from at least 3 independent experiments. * indicates a P value < 0.05.
To assess the role of G4 in the expression of HOXC10, we examined the effects of TAP1, a G4 disrupting ligand on the RNA levels of HOXC10 in the HOXC10 high NCI-H23 cells (Figure 7A). Exposure to TAP1 (2 μM) for 4 days resulted in a greater than 70% decrease in the RNA levels of HOXC10 in NCI-H23 cells (Figure 7A). Consistently, TAP1 substantially reduced the BG4 ChIP signal in NCI-H23 cells (Figure 7B). In contrast, exposure to pyridostatin (5 μM), a G4 enhancing ligand for 48 hrs increased the RNA levels of HOXC10 in HOXC10 low A549 cells (7C). These findings suggest that G4 formation in the HOXC10 CpG island mediates the expression of HOXC10 in NSCLC cells.
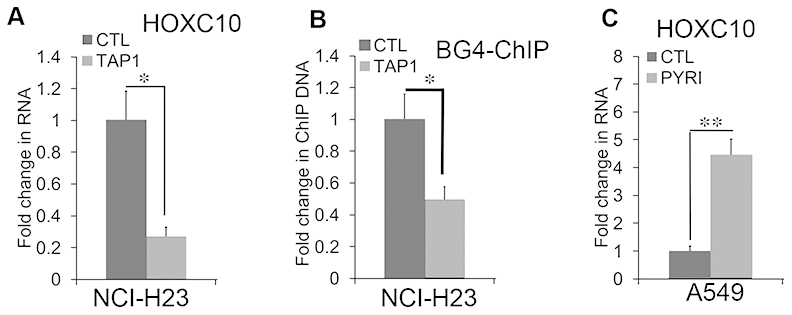
Figure 7. G-quadruplex-mediated regulation of HOXC10 expression. (A) NCI-H23 cells were exposed to the G4 disruptive ligand TAP1 (2 μM) for 4 days. Total RNA was extracted and assessed for the RNA levels of HOXC10 using qRT-PCR. A fold change was obtained by normalizing to the housekeeping gene RPLP0 and setting the values from the DMSO control group to one. (B) Similar to part D except that the BG4 ChIP signals were compared between the DMSO control and TAP1 treated groups. (C) A549 cells were exposed to the G4 enhancing ligand pyridostatin (PYRI) (5 μM) for 48 hrs. Total RNA was extracted and assessed for the RNA levels of HOXC10 using qRT-PCR. A fold change was obtained by normalizing to the housekeeping gene RPLP0 and setting the values from the DMSO group to one. When presented, means and standard deviations were obtained from at least 3 independent experiments. * and ** indicate a P value < 0.05 and 0.01, respectively.
Discussion
HOXC10 is a critical gene that regulates the development of spinal cord, formation of neurons, and tumorigenesis [26–28]. Aberrant overexpression of HOXC10 and its role in cancer progression has been reported in several types of cancers. However, the expression and functions of HOXC10 in lung cancer remains unknown.
In the present study, we demonstrated that the expression HOXC10 was upregulated in the aggressive NCI-H23 cells and modestly expressed in the well-differentiated A549 cells. Elevated expression of HOXC10 was associated with poor overall and disease-free survival in the TCGA Lung Adenocarcinoma cohort (Figure 1D, 1E). These findings indicated clinical significance of elevated expression of HOXC10 in lung cancer. Our analyses of HOXC10 function in lung cancer further supported this notion. The clinical significance of HOXC10 in NSCLC was further supported by two recent studies that relate elevated HOXC10 expression to poor prognosis and disruption of epigenetic staging in NSCLC [29, 30]. Silencing HOXC10 expression significantly repressed proliferation and promoted apoptosis in NCI-H23 cells. In contrast, forced overexpression of HOXC10 promoted cell growth and decreased apoptosis in the HOXC10 low A549 cells. More importantly, HOXC10 overexpression in A549 cells was sufficient to promote tumor growth in vivo. We also observed altered expression of the apoptosis-related genes in response to the overexpression of HOXC10 in A549 cell line and knockdown of HOXC10 in NCI-H23 cells. Bcl-2 is a proto-oncogene that inhibits apoptosis and promotes survival of cancer cells under deleterious condition [31]. Bax as a pro-apoptotic protein can initiate cell death pathways, although it has similar sequence homology with Bcl-2 [32]. The ratio of Bcl-2 and Bax determines the response to a death signal via modulating membrane permeability of transition pore opening. Our results indicated that overexpressed HOXC10 can inhibit A549 cell apoptosis by increasing the ratio of Bcl-2/Bax, whereas knockdown of HOXC10 in NCI-H23 cells decreased them.
Since we discovered that HOXC10 plays a critical role in NSCLC cell proliferation and apoptosis, we aimed to dissect the molecular mechanism that upregulate the expression of HOXC10 in NSCLC cells. We demonstrated that hypomethylation was one mechanism for aberrant overexpression of HOXC10 in NSCLC cells. This is consistent with Kim’s study that suggested hypomethylation of HOXC10 CpG sites was associated with overexpression of HOXC10 in gastric cancer [6]. Moreover, Pathiraja et al. reported that hypermethylation of the HOXC10 CpG island was associated with transcriptional silencing in breast cancer cells [7].
Several recent reports suggest a link between G4 and chromatin staging for active transcription, especially histone acetylation and cytosine hypomethylation [33, 34]. We identified a G4 motif in the HOXC10 CpG island and postulated that G4 formation mediated upregulation of HOXC10 expression in NSCLC cells (Figures 6, 7). Promoting G4 has been extensively investigated as a therapeutic approach in cancer because targeting G4s with small molecules has been reported to be a strategy to suppress the expression of oncogenes, such as Myc, Kars and Kit [35]. Development of G4 stabilizing/enhancing ligands for cancer therapy has been largely based on the premise that accumulation of G4 in the oncogenes’ promoters can silence the expression of oncogenes. However, our characterization of G4s in the HOXC10 CpG island challenges this oversimplified paradigm. Our results indicated that G4 formation was critical for upregulation of HOXC10 in NSCLC cells. This notion is based on our findings that enhancing G4 by the stabilizing ligands can increase the expression of HOXC10, whereas disrupting G4 by TAP1 can decrease the expression of HOXC10 (Figures 6, 7). We have not identified any genetic difference in the HOXC10 promoter and gene body between A549 and NCI-H23 cells based on our analyses of the available data. However, we speculate that G4 formation may activate gene expression via facilitating transcription factor binding and staging chromatin structure favorable for transcription as proposed in a recent review of the function of G4 in human biology [36]. The different G4 formation in the HOXC10 gene between A549 and NCI-H23 may result from different activity of the enzymes responsible for G4 formation and disruption. Further analyses are needed to fully understand how G4 formation upregulates HOXC10 expression in NSCLC cells. Therefore, it is imperative to thoroughly understand how G4 upregulates and down-regulates genes in a genomic context dependent manner. Given the link between G4 formation and transcriptionally active chromatin stage, our results warrant further investigation of coordination of these epigenetic codes in regulation of gene expression in lung cancer cells.
Overall, our study indicated a key role of HOXC10 in the proliferation and apoptosis of NSCLC cells in vivo and in vitro. Our results suggested that HOXC10 promoted survival via upregulation of Bcl-2. Moreover, we revealed a new mechanism mediated by DNA demethylation and G4 formation in promoting HOXC10 expression and lung cancer development. Thus, HOXC10 emerges as novel therapeutic target due to its regulation of proliferation and survival and a target of G4 disrupting agents that are well advanced in preclinical and clinical anticancer research.
Materials and Methods
Reagents and plasmids
5-Aza-2′-deoxycytidine (5-Aza-2dC), a small molecular inhibitor of DNA methyltransfereases (DNMT), was purchased from BioVision (Milpitas, CA). A HOXC10-specific antibody (ab15390) was purchased from Abcam (Cambridge, MA). A Bcl-2-speicfica antibody (12789-1-AP) and a Bax-specific antibody (60267-1-Ig) were purchased from Proteintech Group (Chicago, IL). Pyridostatin, a G4 stabilizing ligand was obtained from Cayman (Ann Arbor, MI). TAP1, a G4 disrupting ligand, was kindly provided by Dr. Shankar Balasubramanian at University of Cambridge [37]. Sequences of the primers and siRNAs were listed in Supplementary Table 1.
Cell culture
Human non small lung cancer cell lines A549 and NCI-H23 were purchased from ATCC and cultured in RPMI1640 as we described elsewhere (Manassas, VA) [38].
Transfection
The human HOXC10-specific siRNAs were purchased from GenePharma (Shanghai, China). All the siRNAs were transfected at 60 nM into NCI-H23 cells using RNAiMAX according to the reverse transfection protocol provided by the vendor (Invitrogen, Carlsbad CA) [39].
Generation of HOXC10 stable A549 variants
The constructed HOXC10 overexpression plasmids were transfected into 293 T cells, together with package plasmids pCDH-GFP (pCDH-HOXC10), delta8.9 and VSVG at the ration of 15:12:8 using Transfection Reagent Lipofectamine 2000 (Invitrogen). The lentivirus particles containing supernatants were collected and filtered through 0.4 μm filter membrane after 72 h. A549 cells were plated in 6-well plates with 1 × 10⁶ cells per well and transfected by collected lentivirus particles. The transfected cells were selected by puromycin for 2 weeks. Establishment of stable HOXC10 overexpressing A549 cells was verified by Western blot.
RNA extraction and quantitative RT-PCR
Total cell RNA was extracted using Trizol per the protocol provided by the vendor (Invitrogen, Carlsbad CA) as we previously described (33). The RNA levels of each gene were quantified using qRT-PCR on StepOne Plus Thermal Cycler (Invitrogen, Carlsbad CA) and compared among the groups using the delta CT method [40]. A fold change of each RNA transcript was obtained by normalizing to the house keep gene GAPDH and setting the values from the control group to one.
Cell proliferation and viability assay
Cell viability was assessed when HOXC10 was overexpressed in A549 cells and knockdown in NCI-H23 cells, respectively. Cell viability was assessed using MTT Assays per the provider’s instructions (ThermoFisher, Waltham, MA) [41].
Assessment of apoptosis
Cell apoptosis was evaluated by flow cytometry using AnnexinV FITC Apoptosis Detection Kit according to the manufacturer’s instructions (Vazyme Biotech Co., Nanjing, China). Briefly, the cells (1×10⁵) were harvested and washed twice in phosphate-buffered saline (PBS) and resuspended in 500 μL of binding buffer and then stained in 10 μL of Annexin V and 5-μL propidium iodide (PI) and analyzed using a flow cytometer (Becton Dickinson, Franklin Lakes, NJ, USA).
RNA-SEQ analysis
In house RNA-SEQ data were generated from human NSCLC cell lines A549 and H23 at Washington State University Spokane Genomic Core. Libraries were constructed using the Illumina TruSeq Stranded Total RNA Library Prep Kit/Ribo-Zero Gold kit. RNA-SEQ was carried out on ILLUMINA HISEQ 2500. Roughly 40 million paired end stranded 100 bp reads were generated from each RNA sample. The RNA-SEQ data can be accessed at NCBI GEO (GSE119513). All RNA-SEQ data were analyzed using the Star-RSEM-EbSeq pipeline. Three biological replicates from each cell line were included in our analyses. A transcript was defined as differentially expressed between A549 and NCI-H23 cells when its difference between two cell lines was greater than 2-fold and its false discovery rate (FDR) was smaller than 0.01.
BS-SEQ analysis
Raw whole-genome bisulfite sequencing (BS-SEQ) reads from MCF-7, MDA-MB-468, T47D, and MDA-MB-231 cells were obtained from the NCBI Sequence Read Archive (SRA# SRP005601). The BS-SEQ data was analyzed using methylKit [42]. Only the cytosine sites with a combined reads of methylated and unmethylated cytosine greater than 10 and below the 99.9th percentile were included in our analyses.
Implantation of lung cancer cells
All mouse studies were carried out following the animal protocol approved by the Institute Animal Care and Use Committee at Wuhan Servivebio. Subcutaneous implantation of human NSCLC cell line A549 cells (2 × 10⁶cells/mouse) into male nude and syngeneic mice was carried out as we previously described [43]. Each group of tumor graft consisted of 7 mice. Tumor growth was monitored daily after implantation. The tumor mass was dissected from mice at four weeks after implantation and processed for weighing and H&E staining.
Chromatin immunoprecipitation for G-quadruplex motifs
Chromatin Immunoprecipitation (ChIP) assay was employed to assess G4 formation in the HOXC10 CpG island region. BG4, a G4-specific antibody was purchased from Millipore and used in ChIP assays to immunoprecipitated G4 motifs as described elsewhere [25].
Immunoblot
Total cell lysates were extracted from A549 and H23 cells as well as their variants with HOXC10 overexpressed or knockdown. Immunoblotting was used to assess the protein levels of the indicated genes and the loading control gene GAPDH [44].
Statistical analysis
When presented, means and standard deviations were obtained from at least three independent experiments. A P value between any two compared groups was determined using unpaired two-tailed Student’s t-test.
Author Contributions
Miao Li and Bin Shan Designed the study; John Simon Alsager, Zhaokai Wang, Lin Cheng conducted experiments and collected data; Miao Li analyzed and interpreted data; Bin Shan drafted the manuscript; Miao Li and Bin Shan supervised the whole study; All authors read and approved the final version of the manuscript.
Conflicts of Interest
There are no conflicts of interest from the authors.
Funding
This work was supported by the Liaoning Province education Foundation (LQNK201730) and Natural Science Foundation of Liaoning Province (2020-MS-162).
Editorial Note
This corresponding author has a verified history of publications using the personal email addresses for correspondence.
References
- 1. Siegel RL, Miller KD, Jemal A. Cancer statistics, 2018. CA Cancer J Clin. 2018; 68:7–30. https://doi.org/10.3322/caac.21442 [PubMed]
- 2. Ma L, Wang R, Nan Y, Li W, Wang Q, Jin F. Phloretin exhibits an anticancer effect and enhances the anticancer ability of cisplatin on non-small cell lung cancer cell lines by regulating expression of apoptotic pathways and matrix metalloproteinases. Int J Oncol. 2016; 48:843–53. https://doi.org/10.3892/ijo.2015.3304 [PubMed]
- 3. Yang Y, Ahn YH, Chen Y, Tan X, Guo L, Gibbons DL, Ungewiss C, Peng DH, Liu X, Lin SH, Thilaganathan N, Wistuba II, Rodriguez-Canales J, et al. ZEB1 sensitizes lung adenocarcinoma to metastasis suppression by PI3K antagonism. J Clin Invest. 2014; 124:2696–708. https://doi.org/10.1172/JCI72171 [PubMed]
- 4. Sadik H, Korangath P, Nguyen NK, Gyorffy B, Kumar R, Hedayati M, Teo WW, Park S, Panday H, Munoz TG, Menyhart O, Shah N, Pandita RK, et al. HOXC10 expression supports the development of chemotherapy resistance by fine tuning DNA repair in breast cancer cells. Cancer Res. 2016; 76:4443–56. https://doi.org/10.1158/0008-5472.CAN-16-0774 [PubMed]
- 5. McGinnis W, Krumlauf R. Homeobox genes and axial patterning. Cell. 1992; 68:283–302. https://doi.org/10.1016/0092-8674(92)90471-n [PubMed]
- 6. Kim J, Bae DH, Kim JH, Song KS, Kim YS, Kim SY. HOXC10 overexpression promotes cell proliferation and migration in gastric cancer. Oncol Rep. 2019; 42:202–12. https://doi.org/10.3892/or.2019.7164 [PubMed]
- 7. Pathiraja TN, Nayak SR, Xi Y, Jiang S, Garee JP, Edwards DP, Lee AV, Chen J, Shea MJ, Santen RJ, Gannon F, Kangaspeska S, Jelinek J, et al. Epigenetic reprogramming of HOXC10 in endocrine-resistant breast cancer. Sci Transl Med. 2014; 6:229ra41. https://doi.org/10.1126/scitranslmed.3008326 [PubMed]
- 8. Xie X, Xiao Y, Huang X. Homeobox C10 knockdown suppresses cell proliferation and promotes cell apoptosis in osteosarcoma cells through regulating caspase 3. Onco Targets Ther. 2018; 11:473–82. https://doi.org/10.2147/OTT.S143440 [PubMed]
- 9. Feng X, Li T, Liu Z, Shi Y, Peng Y. HOXC10 up-regulation contributes to human thyroid cancer and indicates poor survival outcome. Mol Biosyst. 2015; 11:2946–54. https://doi.org/10.1039/c5mb00253b [PubMed]
- 10. Sharma S, Kelly TK, Jones PA. Epigenetics in cancer. Carcinogenesis. 2010; 31:27–36. https://doi.org/10.1093/carcin/bgp220 [PubMed]
- 11. Halder R, Halder K, Sharma P, Garg G, Sengupta S, Chowdhury S. Guanine quadruplex DNA structure restricts methylation of CpG dinucleotides genome-wide. Mol Biosyst. 2010; 6:2439–47. https://doi.org/10.1039/c0mb00009d [PubMed]
- 12. Siddiqui-Jain A, Grand CL, Bearss DJ, Hurley LH. Direct evidence for a g-quadruplex in a promoter region and its targeting with a small molecule to repress c-MYC transcription. Proc Natl Acad Sci USA. 2002; 99:11593–98. https://doi.org/10.1073/pnas.182256799 [PubMed]
- 13. Cogoi S, Xodo LE. G-quadruplex formation within the promoter of the KRAS proto-oncogene and its effect on transcription. Nucleic Acids Res. 2006; 34:2536–49. https://doi.org/10.1093/nar/gkl286 [PubMed]
- 14. Dai J, Chen D, Jones RA, Hurley LH, Yang D. NMR solution structure of the major g-quadruplex structure formed in the human BCL2 promoter region. Nucleic Acids Res. 2006; 34:5133–44. https://doi.org/10.1093/nar/gkl610 [PubMed]
- 15. Wang JM, Huang FC, Kuo MH, Wang ZF, Tseng TY, Chang LC, Yen SJ, Chang TC, Lin JJ. Inhibition of cancer cell migration and invasion through suppressing the Wnt1-mediating signal pathway by g-quadruplex structure stabilizers. J Biol Chem. 2014; 289:14612–23. https://doi.org/10.1074/jbc.M114.548230 [PubMed]
- 16. Gu HP, Lin S, Xu M, Yu HY, Du XJ, Zhang YY, Yuan G, Gao W. Up-regulating relaxin expression by g-quadruplex interactive ligand to achieve antifibrotic action. Endocrinology. 2012; 153:3692–700. https://doi.org/10.1210/en.2012-1114 [PubMed]
- 17. Renčiuk D, Ryneš J, Kejnovská I, Foldynová-Trantírková S, Andäng M, Trantírek L, Vorlíčková M. G-quadruplex formation in the Oct4 promoter positively regulates Oct4 expression. Biochim Biophys Acta Gene Regul Mech. 2017; 1860:175–83. https://doi.org/10.1016/j.bbagrm.2016.11.002 [PubMed]
- 18. Thomson S, Buck E, Petti F, Griffin G, Brown E, Ramnarine N, Iwata KK, Gibson N, Haley JD. Epithelial to mesenchymal transition is a determinant of sensitivity of non-small-cell lung carcinoma cell lines and xenografts to epidermal growth factor receptor inhibition. Cancer Res. 2005; 65:9455–62. https://doi.org/10.1158/0008-5472.CAN-05-1058 [PubMed]
- 19. Han SY, Jeong YJ, Choi Y, Hwang SK, Bae YS, Chang YC. Mitochondrial dysfunction induces the invasive phenotype, and cell migration and invasion, through the induction of AKT and AMPK pathways in lung cancer cells. Int J Mol Med. 2018; 42:1644–52. https://doi.org/10.3892/ijmm.2018.3733 [PubMed]
- 20. Yu M, Zhan J, Zhang H. HOX family transcription factors: related signaling pathways and post-translational modifications in cancer. Cell Signal. 2020; 66:109469. https://doi.org/10.1016/j.cellsig.2019.109469 [PubMed]
- 21. Ansari KI, Hussain I, Kasiri S, Mandal SS.HOXC10 isoverexpressed in breast cancer and transcriptionallyregulated by estrogen via involvement of histonemethylases MLL3 and MLL4. J Mol Endocrinol. 201248:61–75. https://doi.org/10.1530/JME-11-0078 [PubMed]
- 22. Luo C, Hajkova P, Ecker JR. Dynamic DNA methylation: in the right place at the right time. Science. 2018; 361:1336–40. https://doi.org/10.1126/science.aat6806 [PubMed]
- 23. Li LC, Dahiya R. MethPrimer: designing primers for methylation PCRs. Bioinformatics. 2002; 18:1427–31. https://doi.org/10.1093/bioinformatics/18.11.1427 [PubMed]
- 24. Kikin O, D’Antonio L, Bagga PS. QGRS mapper: a web-based server for predicting g-quadruplexes in nucleotide sequences. Nucleic Acids Res. 2006; 34:W676–82. https://doi.org/10.1093/nar/gkl253 [PubMed]
- 25. Hänsel-Hertsch R, Beraldi D, Lensing SV, Marsico G, Zyner K, Parry A, Di Antonio M, Pike J, Kimura H, Narita M, Tannahill D, Balasubramanian S. G-quadruplex structures mark human regulatory chromatin. Nat Genet. 2016; 48:1267–72. https://doi.org/10.1038/ng.3662 [PubMed]
- 26. Choe A, Phun HQ, Tieu DD, Hu YH, Carpenter EM. Expression patterns of Hox10 paralogous genes during lumbar spinal cord development. Gene Expr Patterns. 2006; 6:730–37. https://doi.org/10.1016/j.modgep.2005.12.004 [PubMed]
- 27. Wu Y, Wang G, Scott SA, Capecchi MR. Hoxc10 and Hoxd10 regulate mouse columnar, divisional and motor pool identity of lumbar motoneurons. Development. 2008; 135:171–82. https://doi.org/10.1242/dev.009225 [PubMed]
- 28. Li J, Tong G, Huang C, Luo Y, Wang S, Zhang Y, Cheng B, Zhang Z, Wu X, Liu Q, Li M, Li L, Ni B. HOXC10 promotes cell migration, invasion, and tumor growth in gastric carcinoma cells through upregulating proinflammatory cytokines. J Cell Physiol. 2020; 235:3579–91. https://doi.org/10.1002/jcp.29246 [PubMed]
- 29. Guerra SL, Maertens O, Kuzmickas R, De Raedt T, Adeyemi RO, Guild CJ, Guillemette S, Redig AJ, Chambers ES, Xu M, Tiv H, Santagata S, Jänne PA, et al. A deregulated HOX gene axis confers an epigenetic vulnerability in KRAS-mutant lung cancers. Cancer Cell. 2020; 37:705–19.e6. https://doi.org/10.1016/j.ccell.2020.03.004 [PubMed]
- 30. Tang XL, Ding BX, Hua Y, Chen H, Wu T, Chen ZQ, Yuan CH. HOXC10 promotes the metastasis of human lung adenocarcinoma and indicates poor survival outcome. Front Physiol. 2017; 8:557. https://doi.org/10.3389/fphys.2017.00557 [PubMed]
- 31. Vaux DL, Cory S, Adams JM. Bcl-2 gene promotes haemopoietic cell survival and cooperates with c-myc to immortalize pre-B cells. Nature. 1988; 335:440–42. https://doi.org/10.1038/335440a0 [PubMed]
- 32. Suzuki M, Youle RJ, Tjandra N. Structure of bax: coregulation of dimer formation and intracellular localization. Cell. 2000; 103:645–54. https://doi.org/10.1016/s0092-8674(00)00167-7 [PubMed]
- 33. Mao SQ, Ghanbarian AT, Spiegel J, Martínez Cuesta S, Beraldi D, Di Antonio M, Marsico G, Hänsel-Hertsch R, Tannahill D, Balasubramanian S. DNA g-quadruplex structures mold the DNA methylome. Nat Struct Mol Biol. 2018; 25:951–57. https://doi.org/10.1038/s41594-018-0131-8 [PubMed]
- 34. Varizhuk A, Isaakova E, Pozmogova G. DNA g-quadruplexes (G4s) modulate epigenetic (Re)Programming and chromatin remodeling: transient genomic G4s assist in the establishment and maintenance of epigenetic marks, while persistent G4s may erase epigenetic marks. Bioessays. 2019; 41:e1900091. https://doi.org/10.1002/bies.201900091 [PubMed]
- 35. Hänsel-Hertsch R, Di Antonio M, Balasubramanian S. DNA g-quadruplexes in the human genome: detection, functions and therapeutic potential. Nat Rev Mol Cell Biol. 2017; 18:279–84. https://doi.org/10.1038/nrm.2017.3 [PubMed]
- 36. Rhodes D, Lipps HJ. G-quadruplexes and their regulatory roles in biology. Nucleic Acids Res. 2015; 43:8627–37. https://doi.org/10.1093/nar/gkv862 [PubMed]
- 37. Waller ZA, Sewitz SA, Hsu ST, Balasubramanian S. A small molecule that disrupts g-quadruplex DNA structure and enhances gene expression. J Am Chem Soc. 2009; 131:12628–33. https://doi.org/10.1021/ja901892u [PubMed]
- 38. Li C, Nguyen HT, Zhuang Y, Lin Z, Flemington EK, Zhuo Y, Kantrow SP, Morris GF, Sullivan DE, Shan B. Comparative profiling of miRNA expression of lung adenocarcinoma cells in two-dimensional and three-dimensional cultures. Gene. 2012; 511:143–50. https://doi.org/10.1016/j.gene.2012.09.093 [PubMed]
- 39. Li M, Li X, Zhuang Y, Flemington EK, Lin Z, Shan B. Induction of a novel isoform of the lncRNA HOTAIR in claudin-low breast cancer cells attached to extracellular matrix. Mol Oncol. 2017; 11:1698–710. https://doi.org/10.1002/1878-0261.12133 [PubMed]
- 40. Zhuang Y, Nguyen HT, Burow ME, Zhuo Y, El-Dahr SS, Yao X, Cao S, Flemington EK, Nephew KP, Fang F, Collins-Burow B, Rhodes LV, Yu Q, et al. Elevated expression of long intergenic non-coding RNA HOTAIR in a basal-like variant of MCF-7 breast cancer cells. Mol Carcinog. 2015; 54:1656–67. https://doi.org/10.1002/mc.22237 [PubMed]
- 41. Shan B, Morris GF. Binding sequence-dependent regulation of the human proliferating cell nuclear antigen promoter by p53. Exp Cell Res. 2005; 305:10–22. https://doi.org/10.1016/j.yexcr.2004.09.033 [PubMed]
- 42. Akalin A, Kormaksson M, Li S, Garrett-Bakelman FE, Figueroa ME, Melnick A, Mason CE. methylKit: a comprehensive R package for the analysis of genome-wide DNA methylation profiles. Genome Biol. 2012; 13:R87. https://doi.org/10.1186/gb-2012-13-10-r87 [PubMed]
- 43. Nguyen HT, Zhuang Y, Sun L, Kantrow SP, Kolls JK, You Z, Zhuo Y, Shan B. Src-mediated morphology transition of lung cancer cells in three-dimensional organotypic culture. Cancer Cell Int. 2013; 13:16. https://doi.org/10.1186/1475-2867-13-16 [PubMed]
- 44. Deskin B, Lasky J, Zhuang Y, Shan B. Requirement of HDAC6 for activation of Notch1 by TGF-β1. Sci Rep. 2016; 6:31086. https://doi.org/10.1038/srep31086 [PubMed]