


Introduction
Liver cancer is one of the greatest threats to human health worldwide, with hepatocellular carcinoma (HCC) accounting for approximately 80% of these cases [1]. Due to its complex pathogeny, heterogeneity of cancer cells, and low rates of diagnosis at early stages, the treatment of this disease is still not optimal and patient prognosis is poor [2]. Despite extensive high-throughput sequencing technologies and microarray analyses to clarify molecular targets associated with the progression of HCC, small sample sizes in individual studies and the diversity of technology platforms utilized have led to substantial discrepancies in the research, making statistical analyses difficult. Recently, integrated bioinformatics methods and data reanalysis have been used to overcome this problem [3–5].
The role of epigenetics in cancer progression has attracted increasing attention. Abnormal DNA methylation can modulate the expression of cancer-related genes at the transcriptional level and predict prognosis for patients [6]. As an important epigenetic regulatory mechanism, DNA methylation is involved in the modulation of cancer cell proliferation, apoptosis, and invasion [7–9]. Although some research has shown that the abnormal methylation of certain genes affects HCC cell senescence, tumor growth, metastasis, hepatic carcinogenesis, and patient prognosis [10–12], a comprehensive integrative analysis of such gene networks has not been performed.
Genomic DNA copy number can affect gene expression and is involved in cancer progression. Alterations to copy number signatures can lead to transcriptome imbalances and the abnormal expression of cancer-related genes, which can be used to predict both overall survival and sensitivity to drug treatment [2, 13]. Therefore, a combination of the information from DNA copy number arrays, DNA methylation arrays, mRNA detection, and protein level detection can sufficiently clarify the molecular mechanisms and predict novel treatment targets for HCC.
In this study, The Cancer Genome Atlas (TCGA) HCC cohort and Gene Expression Omnibus (GEO) datasets were used to identify differentially-expressed genes (DEGs) between HCC and normal tissues. Twelve upregulated hub genes were selected to detect the association between their expression and clinical prognosis. Moreover, their methylation levels, gene copy numbers, and relationships with immune cell infiltration were assessed. Finally, we identified three upregulated genes that could serve as diagnostic and prognostic indicators for HCC patients.
Results
Identification of DEGs in HCC
We first obtained the gene expression information for HCC and non-tumor liver tissues from three GEO datasets and a TCGA cohort and performed data pre-procession using GEO2R and GEPIA2 websites to screen DEGs based on the cut-off criteria of a p-value < 0.01 and [log2FC (fold-change)] > 1. Figure 1A–1C shows the DEGs from GSE112790, GSE121248, and GSE124535 databases, respectively, based on a volcano plot. We also identified DEGs in the TCGA cohort and visualized their chromosomal locations (Figure 1D). These DEGs were distributed in all chromosomes. A total of 176 upregulated genes (Supplementary Table 1) were found to be common to all four datasets (Figure 1E).
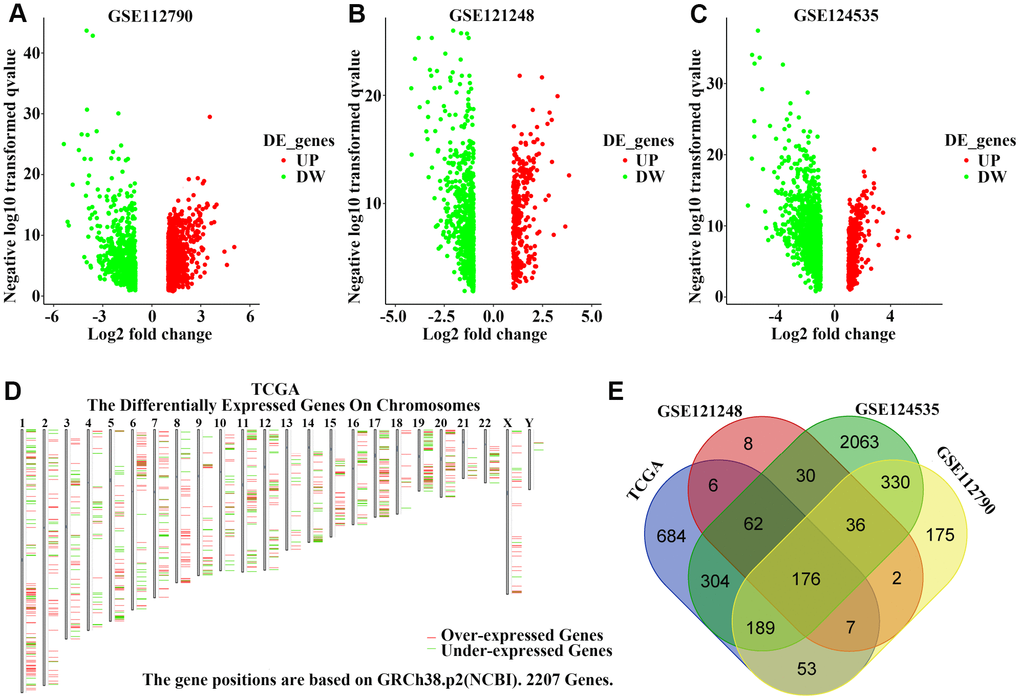
Figure 1. Identification of upregulated genes in hepatocellular carcinoma (HCC) tissues. (A–C) Volcano plot visualizing the differentially-expressed genes between HCC and non-tumor tissues in (A) GSE112790, (B) GSE121248, and (C) GSE124535 datasets. Each symbol represents a gene, and red or green colors indicate upregulated or downregulated genes, respectively. (D) The specific chromosomal locations of differentially-expressed genes between HCC and non-tumor tissues in the TCGA cohort. Red indicates overexpressed genes and green indicates downregulated genes. The vertical line represents chromosomes. (E) Common upregulated genes among GSE112790, GSE121248, GSE124535, and TCGA datasets.
Functional enrichment analysis, PPI network construction, and module analysis
To investigate the biological significance of these overlapping genes, we uploaded the list of 176 upregulated genes into Metascape software for functional enrichment analysis. Upregulated genes were mainly enriched in biological processes such as cell cycle, chromosome condensation, and DNA replication, as well as molecular functions such as protein serine kinase activity, ECM-receptor interaction, and activation of E2F1 target genes. Most enriched clusters were associated with cancer. Figure 2A–2B shows the top 20 clusters of significantly-enriched terms. Next, Metascape and Cytoscape (v3.1.2) were used to construct the PPI network of the 176 upregulated genes (Figure 2C). We identified four significant modules by performing cluster analysis of the PPI network with the Cytoscape MCODE plug-in based on the degree of importance (Figure 2D). We then performed GO and pathway enrichment analyses of the genes in these modules (Figure 2D). The genes in Module 1 were mainly enriched in sister chromatid cohesion, mitotic prometaphase, and M phase. Genes in Module 2 were mainly correlated with cell cycle, DNA conformation change, and unwinding of DNA. Genes in Module 3 were mainly enriched in signaling by PDGF, membrane-ECM interactions, and focal adhesion. Genes in Module 4 were mainly correlated with the Fanconi anemia pathway, pid Fanconi pathway, and interstrand cross-link repair (Figure 2D).
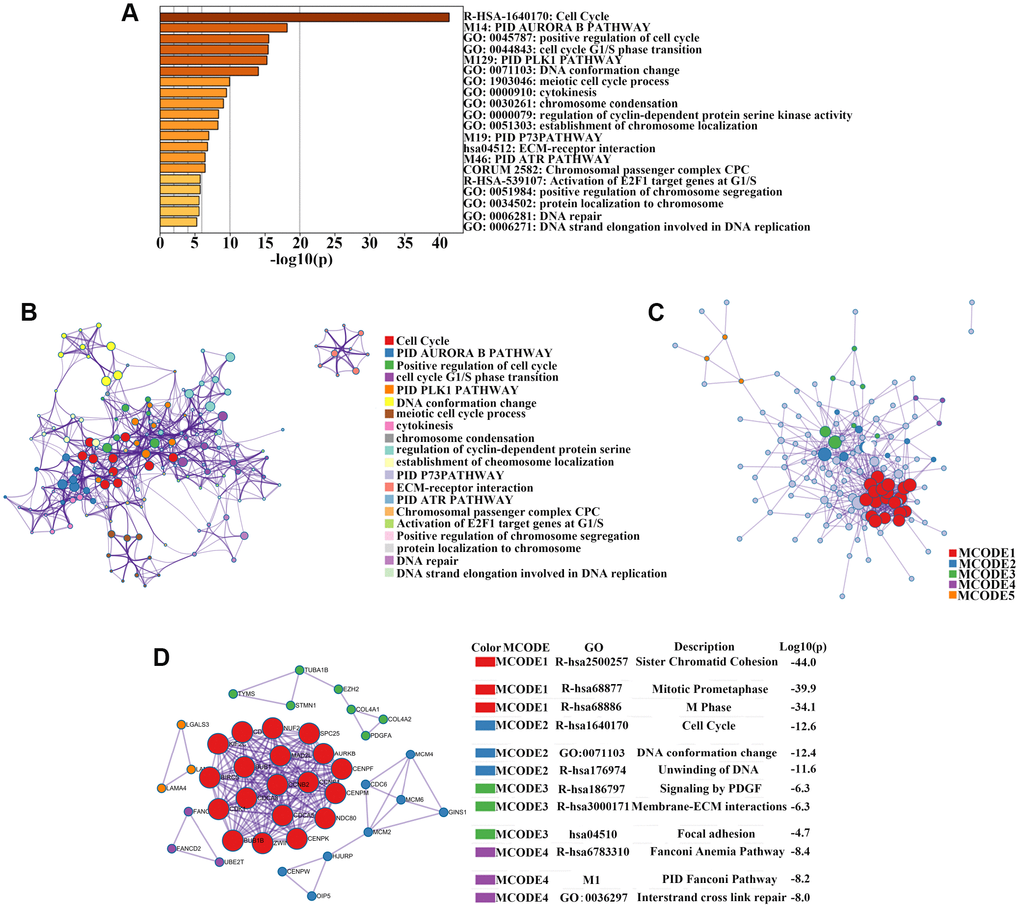
Figure 2. Enrichment analysis, protein–protein interaction (PPI) network construction, and module analysis. (A) Metascape bar graph to view the top 20 non-redundant enrichment clusters of upregulated genes. The enriched biological processes were ranked by p-value. A deeper color indicates a smaller p-value. (B) Metascape visualization of the networks of the top 20 clusters. Each node represents one enriched term colored by cluster ID; nodes that share the same cluster are typically close to each other. Node size is proportional to the number of input genes falling into that term. Thicker edges indicate higher similarity. (C) PPI network construction of upregulated genes. (D) Four sub-networks were identified by Cytoscape MCODE plug-in analysis. Ingenuity pathway analysis of genes in each sub-network to obtain the biological pathways.
Identification of HCC prognosis-related genes with lower methylation levels
Among the 176 upregulated genes, we screened 57 (Supplementary Table 2) that were associated with higher protein levels in HCC tissues based on GSE124535 datasets (Figure 3A). We finally obtained 12 upregulated genes (KPNA2, CDK1, MCM3, SPATS2, TARBP1, PRC1, RRM2, FEN1, NT5DC2, LRRC1, MCM6, and RNASEH2A) by selecting overlapping genes between the hypomethylation set and those for which expression was negatively associated with overall survival (OS) and disease free survival (DFS) in HCC patients (Figure 3B). Levels of all 12 hub genes were negatively correlated with OS and DFS for HCC patients from the TCGA cohort (Figure 3C–3F, Supplementary Figure 1). In addition, the expression of these 12 genes was associated with individual cancer stages and tumor grade (Figure 3G–3J, Supplementary Figure 2). As shown in Figure 4A, mRNA levels of these 12 hub genes were higher in cancer than in normal liver tissues based on the TCGA cohort. Each column represents a sample and each row represents a gene; the color indicates the expression levels.
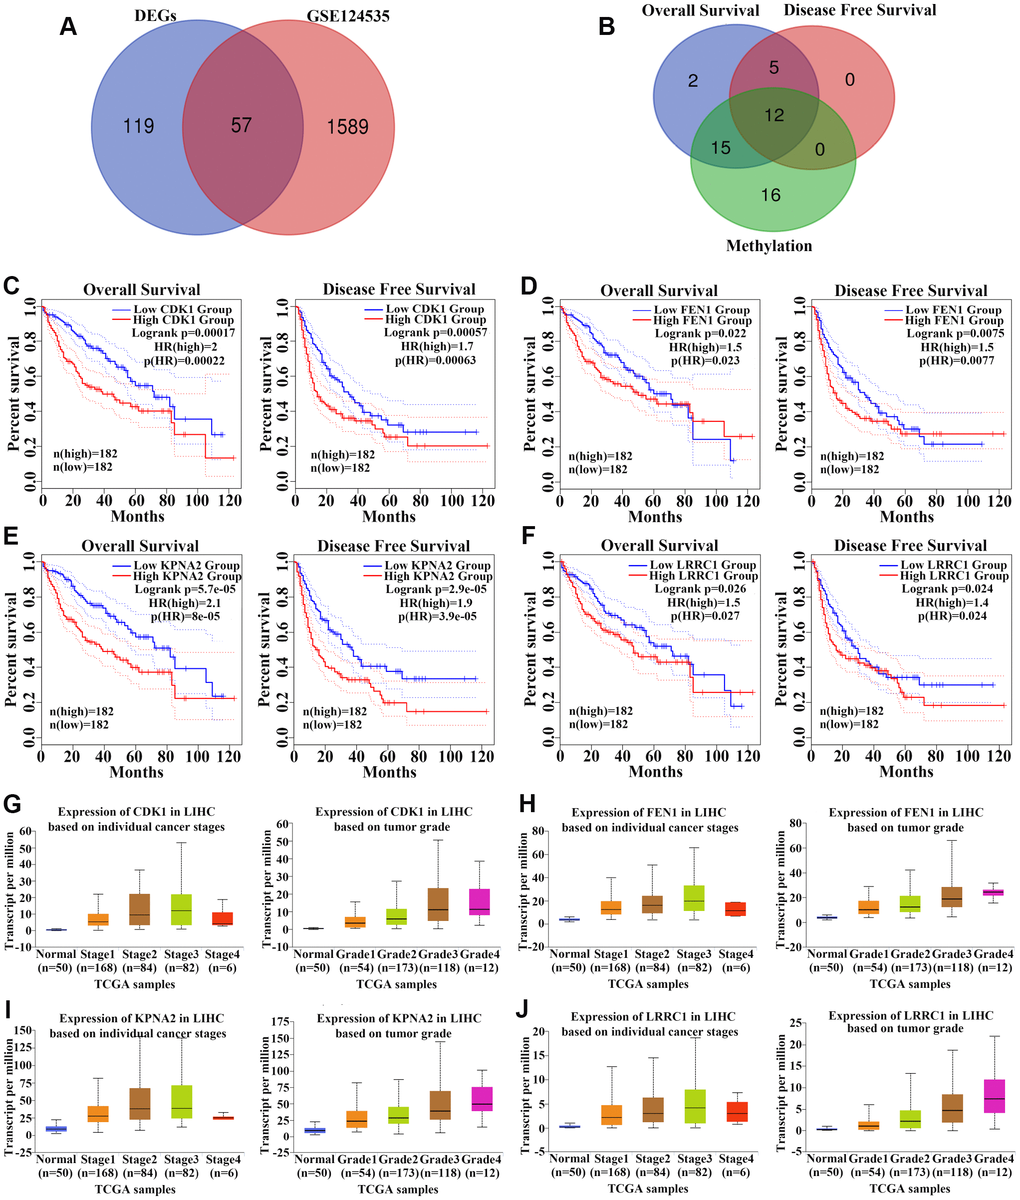
Figure 3. Identification of 12 upregulated hub genes among HCC datasets. (A) Among the 176 upregulated genes, 57 genes with higher protein levels in HCC tissues based on GSE124535 datasets were obtained. (B) We identified 12 upregulated hub genes by considering genes that were negatively associated with overall survival (OS) and disease-free survival (DFS) in HCC patients and genes that were hypomethylated. (C–F) Analysis of the association between CDK1 (C), FEN1 (D), KPNA2 (E), and LRRC1 (F) expression and OS/DFS among HCC patients in the TCGA cohort. (G–J) Analysis of the association between CDK1 (C), FEN1 (D), KPNA2 (E), and LRRC1 (F) expression and cancer stage/tumor grade among HCC patients in the TCGA cohort. p-values are shown in Supplementary Table 3.
Next, we obtained protein expression data for eight genes from the Human Protein Atlas database. All eight genes were upregulated in HCC as compared to levels in normal tissues based on immunohistochemical staining analysis (Figure 4B–4C). A review of the literature found that six of the 12 upregulated genes (KPNA2, CDK1, TARBP1, PRC1, FEN1, and MCM6) were overexpressed in HCC tissue compared to levels in non-tumor tissue based on immunohistochemical staining [14–23]. We detected the expression of the other six genes (MCM3, SPATS2, RRM2, NT5DC2, LRRC1, and RNASEH2A) in 30 pairs of HCC and para-carcinoma tissue by immunohistochemical staining assays. MCM3 and RNASEH2A immunoreactivity was observed in both the cell nucleus and cytoplasm, whereas the other four proteins (SPATS2, RRM2, NT5DC2, and LRRC1) were all localized to the cytoplasm of HCC cells (Figure 5A–5B). The expression of four proteins (MCM3, RRM2, NT5DC2, and RNASEH2A) was significantly upregulated in HCC tissues compared to that in non-tumor tissues (Figure 5A–5C). The positive expression rate of SPATS2 and LRRC1 was higher in HCC tissues, but there was no statistical difference (P = 0.054 and P = 0.265 respectively; Figure 5C). Further increasing the number of samples might thus be required. In addition, based on the expression of these 12 genes, we could effectively distinguish HCC patients from healthy controls in the TCGA cohort by PCA analysis (Figure 4D). Furthermore, all of these genes, except LRRC1, were upregulated in most cancers, except the kidney chromophobe, in the TCGA pan-cancer cohort (Figure 6A–6D, Supplementary Figure 3). Survival analysis showed that the levels of these 12 genes were also associated with OS (Figure 6E) and DFS (Figure 6F) in a range of different cancer types.
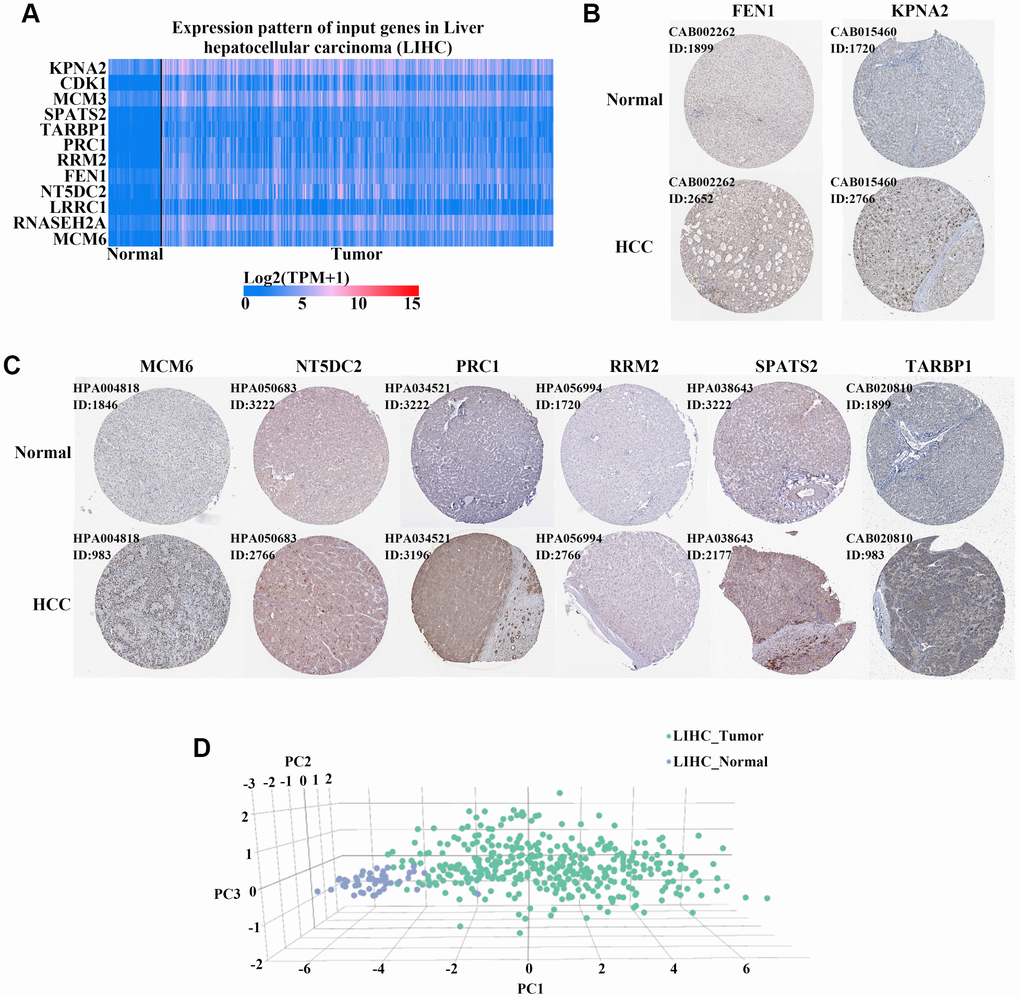
Figure 4. Verification of the expression of 12 hub genes in HCC. (A) Heatmaps of the levels of 12 hub genes comparing HCC and normal liver tissues in the TCGA cohort. Red and blue colors indicate higher and lower expression, respectively. (B–C) Eight hub genes were upregulated in HCC compared to expression in normal tissues based on immunohistochemical staining analysis of the Human Protein Atlas database. Antibody numbers and patient/healthy control ID numbers were annotated. (D) Three-dimensional (3D) principle component analysis (PCA) score plot showing that HCC patients can be effectively distinguished from healthy controls based on the expression of these 12 genes.
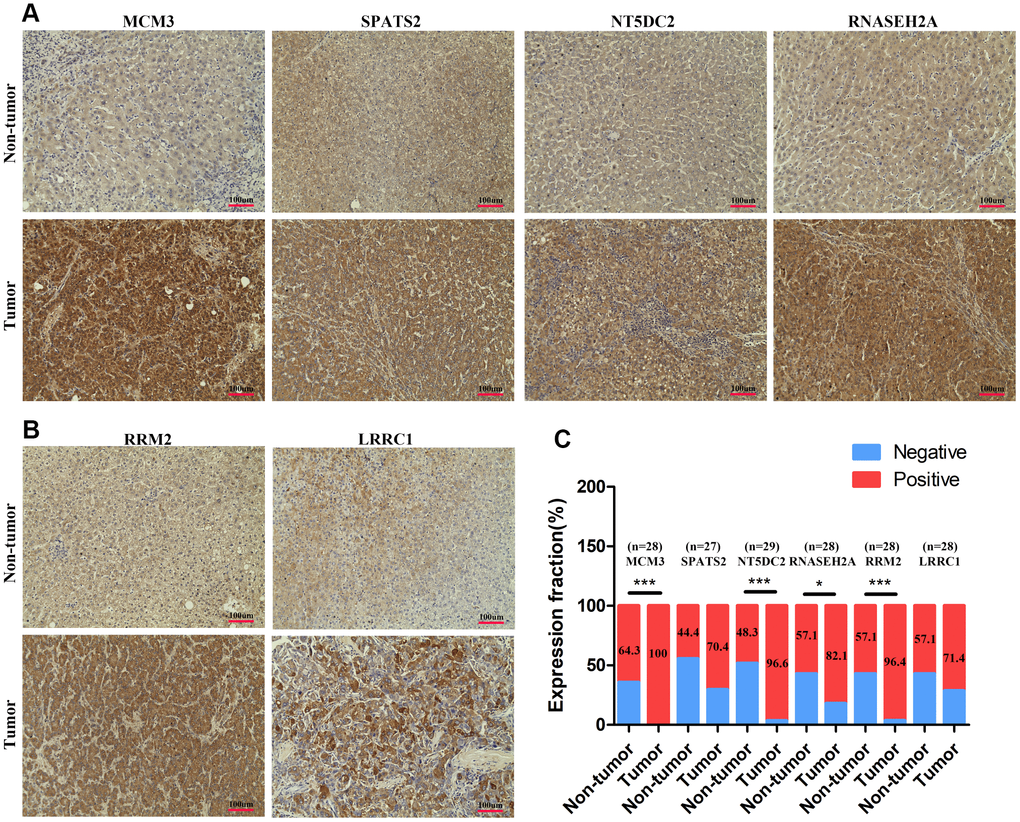
Figure 5. The expression levels of MCM3, SPATS2, NT5DC2, RNASEH2A, LRRC1, and RRM2 in HCC tissues. (A–B) Immunohistochemical staining analysed expression levels of MCM3, SPATS2, NT5DC2, RNASEH2A, LRRC1, and RRM2 in HCC and non-tumor tissues. (C) Positive expression percentage of the six genes in HCC and non-tumor tissues was showed. Fewer than 30 samples due to de-fragmentation. *P < 0.05; **P < 0.01; ***P < 0.001.
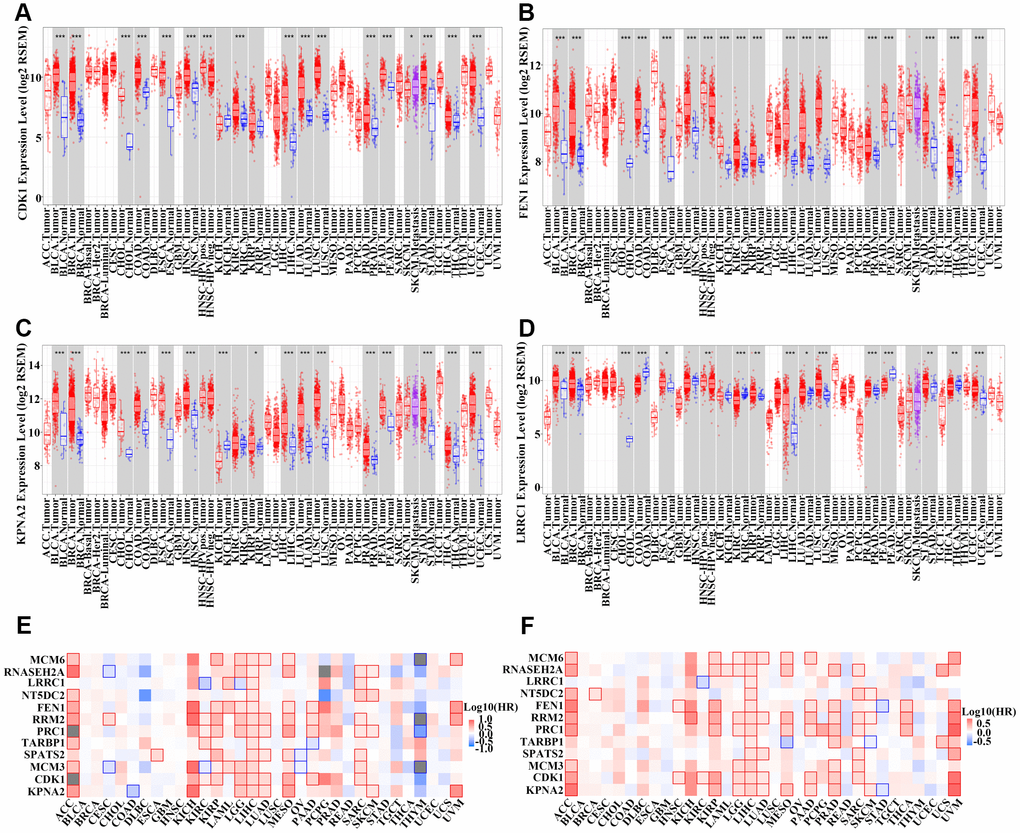
Figure 6. Detection of the expression of 12 hub genes in other types of cancer. (A–D) Boxplot of CDK1 (A), FEN1 (B), KPNA2 (C), and LRRC1 (D) expression in different types of cancer and normal tissues from the TCGA pan-cancer cohort. (E–F) Survival analysis examining the correlation between 12 hub genes and overall survival (OS) (E) or disease-free survival (DFS) (F) among different types of cancer patients in the TCGA cohort. Red wireframe indicates statistical differences. Red and blue colors show that gene expression was negatively and positively correlated with OS/DFS, respectively.
Functional analyses of upregulated hub genes
Studies have shown that KPNA2 can inhibit cell apoptosis and promote cell proliferation, migration, and invasion in HCC [24–26]. CDK1 can increase cellular viability and promote proliferation in HCC cell lines [15, 27]. Further, PRC1 can promote cell proliferation, migration, and invasion, promote tumor growth and metastasis, increase chemoresistance, and inhibit apoptosis in HCC [17–20]. It was also reported that RRM2 promotes HCC cell proliferation, inhibits apoptosis in vitro, and promotes tumor growth in vivo [28, 29]. FEN1 promotes HCC cell migration, invasion in vitro and promotes tumor growth and lung metastasis in vivo [21]. Meanwhile, LRRC1 enhances HCC cell proliferation in vitro and promotes tumor growth in vivo [30]. It was also reported that MCM6 increases the proliferative and migratory/invasive capability of HCC cells in vitro, in addition to increasing the tumor volume, weight, and the number of pulmonary metastases in vivo [22, 23].
To examine the biological functions of MCM3, SPATS2, TARBP1, NT5DC2, and RNASEH2A in HCC, we transfected Huh7 and SK-Hep-1 cells with siRNA targeting these five genes. qRT-PCR and western blot assays verified the interference efficiency (Supplementary Figure 4A–4C). We found that silencing MCM3 expression suppressed Huh7 and SK-Hep-1 cell proliferation according to CCK-8 assays and reduced the percentage of S-phase cells according to EdU-incorporation assays (Figure 7) but had no effect on the migration and invasion of HCC cells (Supplementary Figure 6A–6C and Supplementary Figure 6E). SPATS2 knockdown suppressed the proliferation, migration, and invasion of Huh7 and SK-Hep-1 cells (Figure 7, Figure 8A–8B, Figure 8D, and Figure 8F). Silencing RNASEH2A expression decreased the migratory and invasive capability but did not affect the proliferative capacity of Huh7 and SK-Hep-1 cells (Figure 8A–8C, Figure 8E, and Supplementary Figure 5). Both NT5DC2 and TARBP1 knockdown did not affect HCC cell proliferation, migration, and invasion (Supplementary Figures 5 and 6). The expression of NT5DC2 could not be knocked down in SK-Hep-1 cells, and thus, we only performed functional analysis of this marker using Huh7 cells.
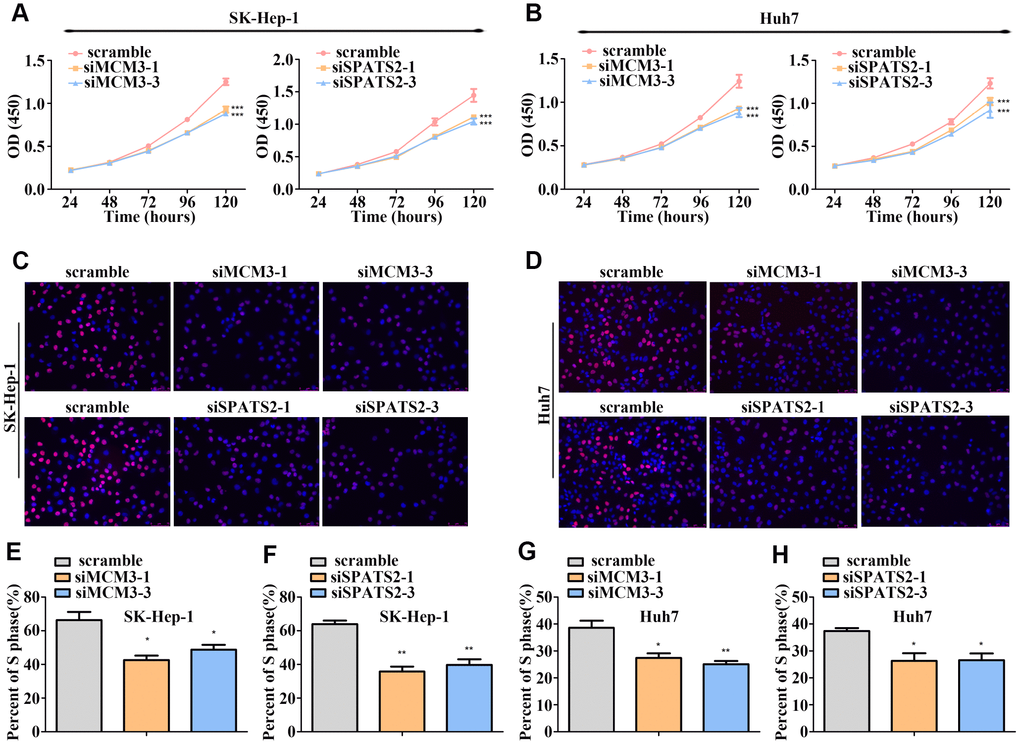
Figure 7. MCM3 and SPATS2 promotes HCC cell proliferation. (A–B) Proliferation of HCC cells with MCM3 or SPATS2 knockdown according to CCK-8 analysis. (C–D) EdU assays showing the proportion of S-phase cell after downregulating the expression of MCM3 or SPATS2. Nuclei of S-phase cells were pink. (E–H) Statistical analysis of EdU incorporation. *P < 0.05; **P < 0.01; ***P < 0.001.
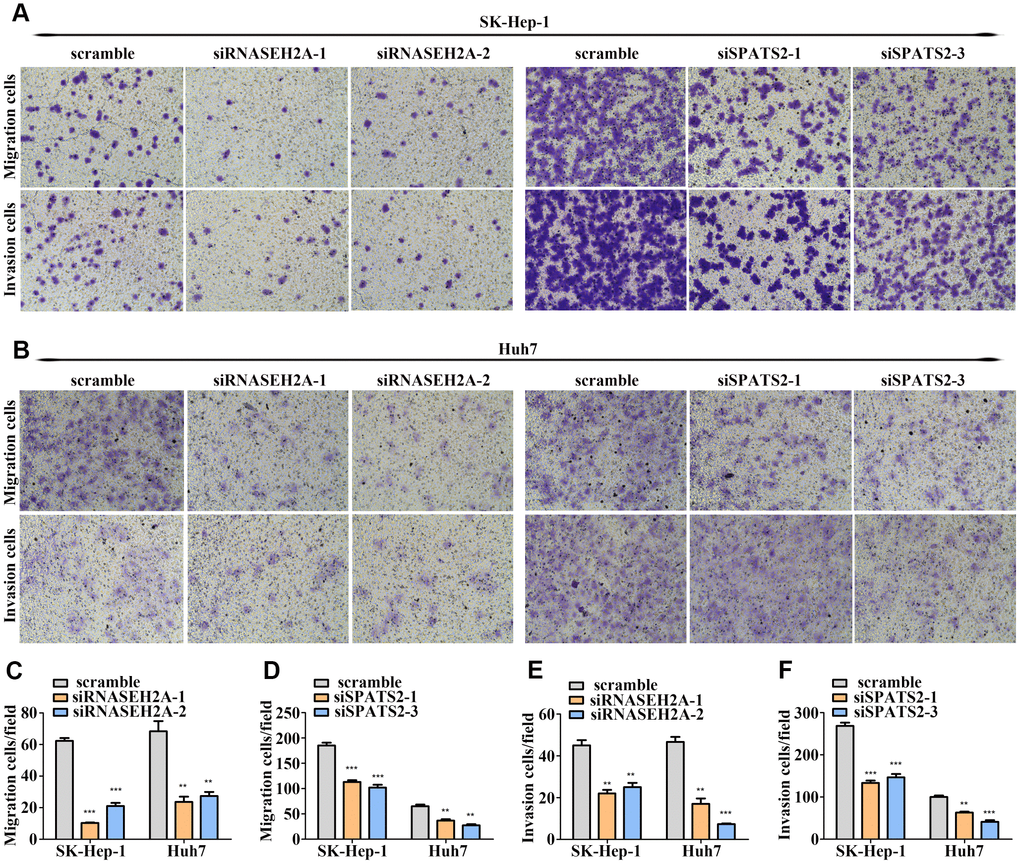
Figure 8. RNASEH2A and SPATS2 promotes HCC cell migration and invasion. (A–B) HCC cell migration and invasion were detected after downregulating the expression of RNASEH2A or SPATS2 by Transwell and Boyden assays. (C–F) Statistical analysis of Transwell and Boyden assay results. *P < 0.05; **P < 0.01; ***P < 0.001.
Methylation and gene copy number analyses of upregulated hub genes
We further determined the methylation status of the aforementioned 12 upregulated genes in the TCGA cohort and analyzed the correlation between mRNA expression and DNA methylation levels. The 12 genes had lower methylation levels in primary HCC compared to those in normal liver tissues (Figure 9A–9D, Supplementary Figure 7A–7D, and Supplementary Figure 7I–7L). Additionally, DNA methylation levels of all hub genes were negatively associated with mRNA expression (Figure 9E–9H, Supplementary Figure 7E–7H, and Supplementary Figure 7M–7P), suggesting that DNA methylation might regulate the mRNA expression of these genes. Further, the associations between copy number and the mRNA expression levels of the 12 genes were also tested. The mRNA levels of seven genes including CDK1, FEN1, KPNA2, MCM3, RRM2, SPATS2, and TARBP1 were found to be positively related to copy number (Figure 9I–9L, Supplementary Figure 8), indicating that gene copy number might also contribute to the upregulation of these genes. Additionally, the methylation level of KPNA2, LRRC1, and MCM3 was positively associated with OS for HCC patients (Figure 9M–9O), and the methylation level of KPNA2 and MCM3 was negatively associated with pathologic T stage for this cohort (Figure 9P–9Q). This suggested that the methylation status of these three genes is related to clinical features among HCC patients.
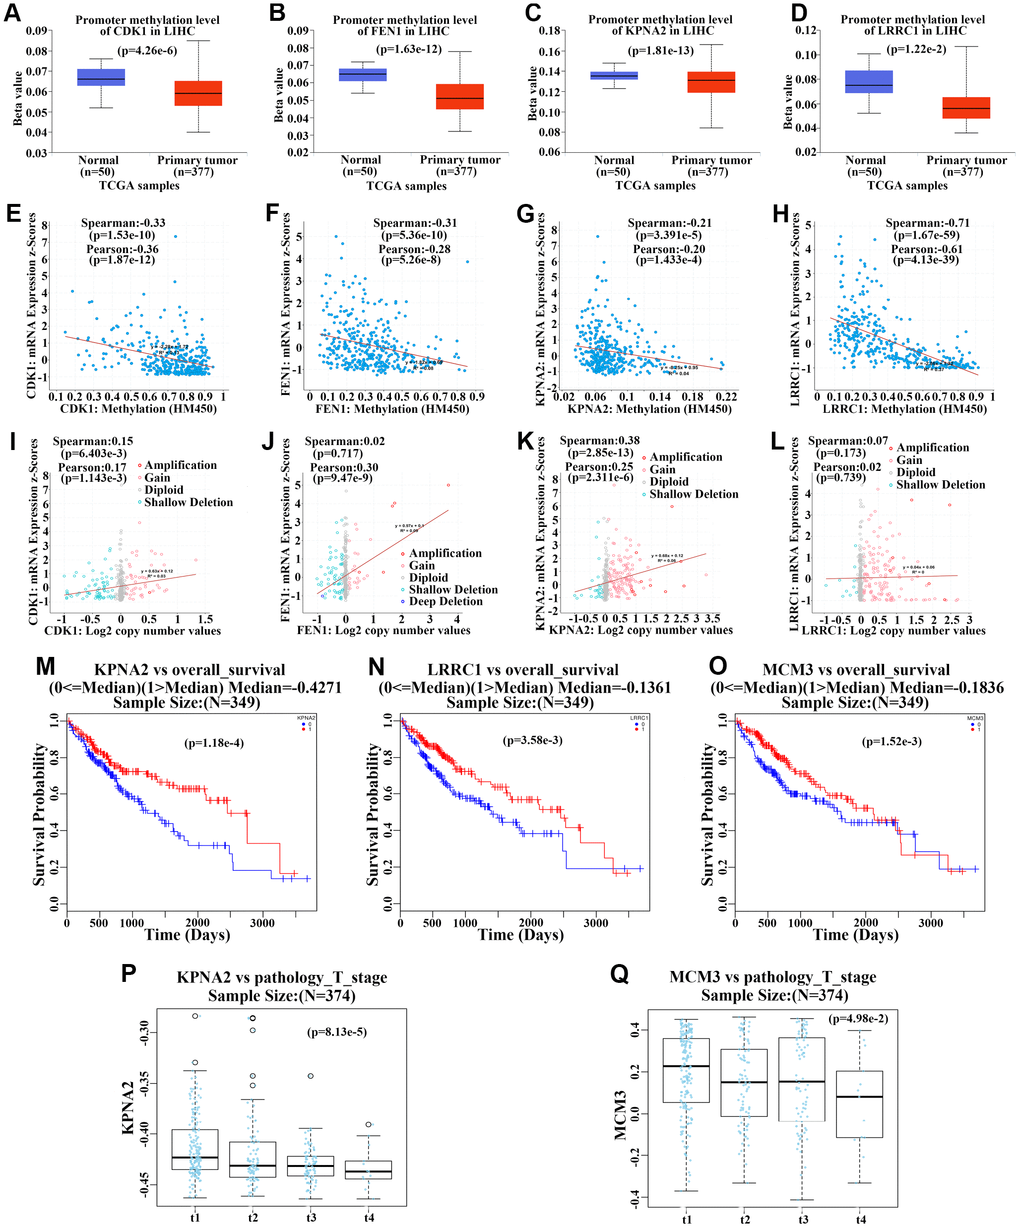
Figure 9. Methylation and gene copy number analyses of upregulated hub genes. (A–D) Methylation levels of CDK1 (A), FEN1 (B), KPNA2 (C), and LRRC1 (D) in primary hepatocellular carcinoma (HCC) tumors and normal tissues from the TCGA cohort. (E–H) Correlation analysis of methylation levels of CDK1 (E), FEN1 (F), KPNA2 (G), and LRRC1 (H) and their mRNA expression in HCC based on the TCGA cohort. (I–L) Correlation analysis of gene copy numbers of CDK1 (I), FEN1 (J), KPNA2 (K), and LRRC1 (L) and their mRNA expression in HCC based on the TCGA cohort. (M–O) Survival analysis of the correlation between methylation levels of KPNA2 (M), LRRC1 (N), and MCM3 (O) and overall survival (OS) in HCC patients from the TCGA cohort. (P–Q) Analysis of the association between KPNA2 (P) and MCM3 (Q) methylation and pathologic T stage in HCC patients of the TCGA cohort.
Correlation between hub gene levels and immune cell infiltration
We then performed an interrelation analysis comparing infiltrating immune cells in HCC tissues and the expression of upregulated genes, except LRRC1, using Timer software. Among these 11 genes, the expression levels of all but TARBP1 were positively related to the infiltration levels of B cells, CD8+ T cells, CD4+ T cells, macrophages, neutrophils, and dendritic cells in HCC tissues, suggesting that higher expression levels of these 10 genes indicate an advantage for cancer immunotherapy (Figure 10A–10C and Supplementary Figure 9).
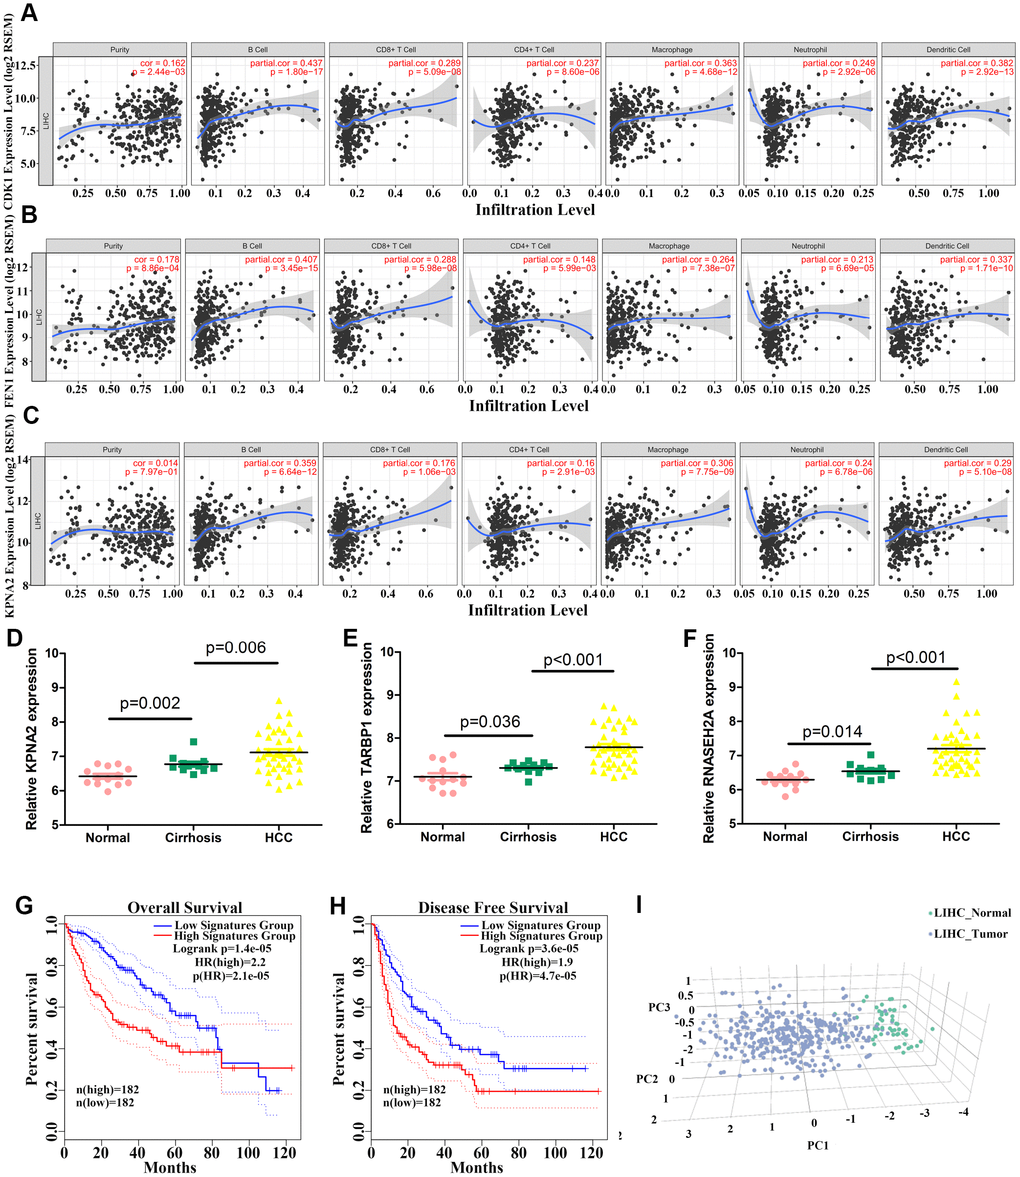
Figure 10. Correlation between levels of hub genes and immune cell infiltration and identification of three hub genes. (A–C) Correlation between CDK1 (A), FEN1 (B), and KPNA2 (C) levels and immune cell infiltration in hepatocellular carcinoma (HCC) tissues. Each dot represents a sample in the TCGA cohort. (D–F) KPNA2 (D), TARBP1 (E), and RNASEH2A (F) mRNA levels in normal, cirrhosis, and HCC samples from GSE89377. (G–H) Analysis of the correlation between three-hub gene expression signatures and overall survival (OS) (G) or disease-free survival (DFS) (H) for HCC patients of the TCGA cohort. (I) HCC patients could be effectively distinguished from healthy controls by principle component analysis (PCA) based on expression of the three genes.
A combination of the three upregulated hub genes can provide diagnostic and prognostic value for HCC patients
We finally selected three upregulated hub genes (KPNA2, TARBP1, and RNASEH2A) for which expression was systematically increased from normal liver to cirrhosis and HCC tissues based on the GSE89377 dataset (Figure 10D–10F). Combined expression signatures of these three genes were negatively related to OS and DFS for HCC patients in the TCGA cohort (Figure 10G–10H). The signature score was calculated based on the mean log2(TPM+1) value of each gene. Further, we could effectively and accurately distinguish HCC patients from healthy controls by PCA analysis based on the three-gene expression signature (Figure 10I).
Discussion
HCC remains a dominant cause of cancer-related death despite dramatic improvements in its treatment. Here, we screened DEGs in HCC tissues and investigated these genes in-depth based on expression levels, survival, methylation status, DNA copy number, and immune cell infiltration. We finally identified three hub genes that could provide comprehensive diagnostic and prognostic value for HCC patients.
GO enrichment and functional pathway analyses of 176 upregulated genes showed that these genes were mainly involved in cell cycle, the Aurora B pathway, positive regulation of cell cycle, cell cycle G1/S phase transition, and the PLK1 pathway. Aurora B is a crucial regulator of accurate mitosis and its abnormal expression is associated with cancer progression [31, 32]. The PLK1 pathway also participates in the regulation of cell mitosis and acts as an oncogenic factor to promote cancer development [33, 34]. PPI network analysis demonstrated the most important regulatory functions of the upregulated genes, including sister chromatid cohesion, mitotic prometaphase, M phase, cell cycle, and DNA conformational changes. This was consistent with GO analysis results. These results indicate that the upregulated genes are mainly involved in tumor growth modulation, suggesting their relevance to HCC pathogenesis and progression.
Combining survival and DNA methylation analyses, we obtained 12 upregulated hub genes. The majority of these were previously proven to play important roles in cancer progression [16, 30, 35–42], indicating the consistency of our data with other research reports. Their levels were also positively associated with cancer stages and tumor grade, suggesting significant roles in the development of HCC. Furthermore, we showed that all 12 genes could predict HCC patient prognosis and that a combination of them could serve as a biomarker to accurately distinguish patients from healthy controls. Indeed, we provide foundational data suggesting that all of these genes could serve as promising prognostic indicators and therapeutic targets.
The observed hypomethylation of the 12 genes and the negative correlation between methylation status and mRNA levels in HCC indicate that DNA hypomethylation could account for such abnormal expression patterns. Nevertheless, the copy numbers of only seven genes (CDK1, FEN1, KPNA2, MCM3, RRM2, SPATS2, and TARBP1) were found to be positively associated with mRNA levels. This indicates that DNA methylation and copy number might coordinately modulate the expression of these genes.
Cancer immunotherapy, and especially multiple immune checkpoint inhibitors, has received increasing attention and has become a promising treatment strategy in recent years [43, 44]. The levels of all hub genes identified in this study, except TARBP1 and LRRC1, were able to predict immune cell infiltration in HCC tissues. Reports have shown that the clinical efficacy of checkpoint inhibitors is significantly dependent on the number of pre-existing tumor-infiltrating immune cells [45, 46]. Our data suggested that higher expression levels of these 10 genes could indicate an advantage for checkpoint inhibitor therapy, potentially providing guidance for cancer immunotherapy. To better screen prognostic and diagnostic markers, we finally identified three hub genes (KPNA2, TARBP1, and RNASEH2A) for which expression could collectively and precisely predict patient prognosis. The combination of these three genes will be more meaningful and convenient for clinical applications than the 12 genes.
In conclusion, by integrating bioinformatic analyses, we obtained a combination of several hub genes with potential clinical significance for HCC. More work is required to better reveal their functions and the underlying mechanisms with respect to HCC progression, as well as their potential applications for disease diagnosis and prognosis.
Materials and Methods
Microarray data
The mRNA expression data, methylation data, and corresponding clinical information for HCC patients were obtained from The Cancer Genome Atlas (TCGA; https://tcga-data.nci.nih.gov/tcga/) cohort. The GEPIA2 website was used to screen DEGs between HCC samples and normal tissue and to visualize the expression patterns and chromosomal locations of the upregulated genes.
Additionally, four microarray datasets (GSE124535, GSE112790, GSE121248, and GSE89377) were downloaded from the Gene Expression Omnibus (GEO; http://www.ncbi.nlm.nih.gov/geo) databases. GSE124535 data are based on GPL20795 platforms and include mRNA and protein expression information from 35 paired HCC and non-tumor tissues. GSE112790 data are based on GPL570 platforms and include mRNA expression information from 183 HCC patients and 15 adjacent liver tissues. GSE121248 data are based on GPL570 platforms and include mRNA expression information from 70 HCC and 37 adjacent normal tissues. GSE89377 data are based on GPL6947 platforms and include mRNA expression information from 107 samples covering different stages of HCC development. GEO2R was used to screen DEGs between HCC samples and non-tumor controls. We used the criteria of a p-value < 0.01 and [log2FC] > 1 to define DEGs, as well as an online Venn diagram tool (http://bioinfogp.cnb.csic.es/tools/venny/) to screen overlapping DEGs.
Functional enrichment analysis, establishment of protein-protein interaction (PPI) network, and modular analysis of upregulated genes
Functional enrichment analysis was performed using Metascape (http://metascape.org/gp/index.html#/main/step1). Specifically, we submitted our 176 upregulated genes into this platform. Gene Ontology (GO) terms for biological process, cellular component, and molecular function categories, as well as Kyoto Encyclopedia of Genes and Genomes pathways, were found to be enriched and a p-value < 0.05 was considered statistically significant. The most enriched term within a cluster was represented.
Metascape can be used to automatically analyze the biological significance of a large number of genes. We use Metascape and Cytoscape software to construct the PPI network comprising the 176 upregulated genes. We identified all significantly enriched terms, which were then hierarchically clustered into a tree based on Kappa-statistical similarities among their gene memberships. Next, a 0.3 kappa score was applied as the threshold to divide the tree into term clusters, and a subset of representative terms were selected from this cluster and converted into a network layout. More specifically, each term was represented by a circle node, where its size was proportional to the number of input genes that fell into that term, and its color represented its cluster identity. Terms with a similarity score > 0.3 were linked by an edge (the thickness of the edge represents the similarity score) and the network was visualized with Cytoscape (v3.1.2) (http://www.cytoscape.org/) with a “force-directed” layout and with edges bundled for clarity. We used Molecular Complex Detection (MCODE), a plug-in in Cytoscape, to filter the modules from the PPI network and to obtain the most important module based on the MCODE score and node number.
Survival analysis
The association between the expression levels of DEGs and OS or DFS was analyzed using the Kaplan–Meier survival method based on the TCGA HCC cohort. Cancer samples were divided into two groups based on the expression of genes to plot survival curves. A p-value < 0.05 was regarded as statistically significant.
Validation of the 12 upregulated genes
An expression heatmap of the 12 genes in HCC and normal liver tissues based on the TCGA cohort was produced using UALCAN software (http://ualcan.path.uab.edu/index.html). To detect translational levels of the 12 genes, we obtained immunohistochemistry sections of HCC and normal tissues from the Human Protein Atlas database (https://www.proteinatlas.org/). Furthermore, we constructed expression box plots for the 12 genes in different types of tumors and normal tissues based on data from the TCGA pan-cancer cohort using Timer software (https://cistrome.shinyapps.io/timer/).
Methylation and gene copy number analyses
We compared the methylation levels of 12 genes between normal and primary tumor tissues based on information from the TCGA HCC cohort, which included human cancer methylation data from microarray and sequencing technology. We also examined the association between the expression levels of the 12 genes and their DNA methylation patterns or copy numbers using cBioPortal software (http://www.cbioportal.org/).
Correlation between gene expression and immune cell infiltration
We used Timer software (https://cistrome.shinyapps.io/timer/), which includes different types of cancer samples accessible in the TCGA cohort, to examine the correlation between expression of the 12 genes and tumor-infiltrating immune cells (TIICs; B cells, CD4+ T cells, CD8+ T cells, neutrophils, macrophages, and dendritic cells). Timer applies a deconvolution method to infer the abundance of TIICs from gene expression profiles. In brief, the informative immune signature genes that are negatively associated with tumor purity (percentage of malignant cells in a tumor tissue) for each tumor type were selected. Then, constrained least squares fitting on the immune signature genes was used to infer the abundance of TIICs [47, 48].
Principal component analysis (PCA)
We performed PCA using GEPIA2 websites to distinguish HCC patients from healthy controls based on levels of the upregulated genes. PCA is capable of reducing the dimensionality of redundant and noisy information from complex massive datasets. We transformed the original variables into three new orthogonal variables called principal components (PCs). A PC score plot was obtained to represent clear clustering of the target points.
siRNA transfection
siRNA was purchased from RiboBio (Guangzhou, China) and was transfected into HCC cells using Lipofectamine RNAiMAX (Invitrogen) at a working concentration of 100 nM according to manufacturer instructions.
Cell culture, quantitative reverse transcription polymerase chain reaction (qRT-PCR), Western blotting, Cell Counting Kit (CCK)-8 assay, 5-ethynyl-2′-deoxyuridine (EdU)-incorporation assay, transwell-migration, and Boyden-invasion assays
The details of these assays were described previously [49]. Primer sequences are listed in Supplementary Table 4. Antibodies are listed in Supplementary Table 5.
Immunohistochemical staining
Immunohistochemical staining of the HCC tissue microarray (Chaoxing Biotechnology, Shanghai, China) was carried out following the manufacturer’s protocol. The score standard for the intensity of staining was as follows: 0, negative; 1, weak; 2, medium; 3, strong. The extent of staining was scored as: 0, 0%; 1, 1–25%; 2, 26–50%; 3, 51–75%; 4, 76–100%. Total scores of 2 or lower were defined as the negative group, whereas total scores of 3 or higher were defined as the positive group. Antibodies are listed in Supplementary Table 5.
Statistical analysis
We used SPSS 16.0 software (Chicago, IL, USA) to perform data analysis. A Student’s t test was utilized to assess significance of data from two groups, and one-way analysis of variance (ANOVA) followed by Dunnett’s multiple comparison was performed to evaluate differences between multiple groups. Correlation analysis was undertaken using Pearson or Spearman tests. Overall and disease-free survival were evaluated using the Kaplan–Meier method. P < 0.05 was considered statistically significant.
Supplementary Materials
Author Contributions
SH designed and performed the experiments, analyzed the data, and drafted the paper. YQ, MZ, WL, and HW revised the paper. All authors read and approved the final manuscript.
Acknowledgments
We would like to thank Editage (https://www.editage.cn) for English language editing.
Conflicts of Interest
The authors declare that they have no conflicts of interest.
Funding
This work was supported by the National Key Research and Development Program of China (No. 2017YFA0205200), National Natural Science Foundation of China (No. 81571785, 81771957, and 81502642), China postdoctoral Science Foundation (No. 2018M631039), and Natural Science Foundation of Guangdong Province, China (No. 2016A030311055, 2016A030313770, and 2018A030313074).
References
- 1. Bray F, Ferlay J, Soerjomataram I, Siegel RL, Torre LA, Jemal A. Global cancer statistics 2018: GLOBOCAN estimates of incidence and mortality worldwide for 36 cancers in 185 countries. CA Cancer J Clin. 2018; 68:394–424. https://doi.org/10.3322/caac.21492 [PubMed]
- 2. Dang H, Takai A, Forgues M, Pomyen Y, Mou H, Xue W, Ray D, Ha KC, Morris QD, Hughes TR, Wang XW. Oncogenic activation of the RNA binding protein NELFE and MYC signaling in hepatocellular carcinoma. Cancer Cell. 2017; 32:101–114.e8. https://doi.org/10.1016/j.ccell.2017.06.002 [PubMed]
- 3. Ni M, Liu X, Wu J, Zhang D, Tian J, Wang T, Liu S, Meng Z, Wang K, Duan X, Zhou W, Zhang X. Identification of candidate biomarkers correlated with the pathogenesis and prognosis of non-small cell lung cancer via integrated bioinformatics analysis. Front Genet. 2018; 9:469. https://doi.org/10.3389/fgene.2018.00469 [PubMed]
- 4. Hou Q, Bing ZT, Hu C, Li MY, Yang KH, Mo Z, Xie XW, Liao JL, Lu Y, Horie S, Lou MW. RankProd combined with genetic algorithm optimized artificial neural network establishes a diagnostic and prognostic prediction model that revealed C1QTNF3 as a biomarker for prostate cancer. EBioMedicine. 2018; 32:234–44. https://doi.org/10.1016/j.ebiom.2018.05.010 [PubMed]
- 5. Yang Y, Lu Q, Shao X, Mo B, Nie X, Liu W, Chen X, Tang Y, Deng Y, Yan J. Development of a three-gene prognostic signature for hepatitis B virus associated hepatocellular carcinoma based on integrated transcriptomic analysis. J Cancer. 2018; 9:1989–2002. https://doi.org/10.7150/jca.23762 [PubMed]
- 6. Zhang X, Feng H, Li D, Liu S, Amizuka N, Li M. Identification of differentially expressed genes induced by aberrant methylation in oral squamous cell carcinomas using integrated bioinformatic analysis. Int J Mol Sci. 2018; 19:E1698. https://doi.org/10.3390/ijms19061698 [PubMed]
- 7. Gündert M, Edelmann D, Benner A, Jansen L, Jia M, Walter V, Knebel P, Herpel E, Chang-Claude J, Hoffmeister M, Brenner H, Burwinkel B. Genome-wide DNA methylation analysis reveals a prognostic classifier for non-metastatic colorectal cancer (ProMCol classifier). Gut. 2019; 68:101–10. https://doi.org/10.1136/gutjnl-2017-314711 [PubMed]
- 8. Cheng PF, Shakhova O, Widmer DS, Eichhoff OM, Zingg D, Frommel SC, Belloni B, Raaijmakers MI, Goldinger SM, Santoro R, Hemmi S, Sommer L, Dummer R, Levesque MP. Methylation-dependent SOX9 expression mediates invasion in human melanoma cells and is a negative prognostic factor in advanced melanoma. Genome Biol. 2015; 16:42. https://doi.org/10.1186/s13059-015-0594-4 [PubMed]
- 9. Hlady RA, Sathyanarayan A, Thompson JJ, Zhou D, Wu Q, Pham K, Lee JH, Liu C, Robertson KD. Integrating the Epigenome to Identify Drivers of Hepatocellular Carcinoma. Hepatology. 2019; 69:639–52. https://doi.org/10.1002/hep.30211 [PubMed]
- 10. Mudbhary R, Hoshida Y, Chernyavskaya Y, Jacob V, Villanueva A, Fiel MI, Chen X, Kojima K, Thung S, Bronson RT, Lachenmayer A, Revill K, Alsinet C, et al. UHRF1 overexpression drives DNA hypomethylation and hepatocellular carcinoma. Cancer Cell. 2014; 25:196–209. https://doi.org/10.1016/j.ccr.2014.01.003 [PubMed]
- 11. Xiong L, Wu F, Wu Q, Xu L, Cheung OK, Kang W, Mok MT, Szeto LLM, Lun CY, Lung RW, Zhang J, Yu KH, Lee SD, et al. Aberrant enhancer hypomethylation contributes to hepatic carcinogenesis through global transcriptional reprogramming. Nat Commun. 2019; 10:335. https://doi.org/10.1038/s41467-018-08245-z [PubMed]
- 12. Jin H, Wang C, Jin G, Ruan H, Gu D, Wei L, Wang H, Wang N, Arunachalam E, Zhang Y, Deng X, Yang C, Xiong Y, et al. Regulator of calcineurin 1 gene isoform 4, down-regulated in hepatocellular carcinoma, prevents proliferation, migration, and invasive activity of cancer cells and metastasis of orthotopic tumors by inhibiting nuclear translocation of NFAT1. Gastroenterology. 2017; 153:799–811.e33. https://doi.org/10.1053/j.gastro.2017.05.045 [PubMed]
- 13. Macintyre G, Goranova TE, De Silva D, Ennis D, Piskorz AM, Eldridge M, Sie D, Lewsley LA, Hanif A, Wilson C, Dowson S, Glasspool RM, Lockley M, et al. Copy number signatures and mutational processes in ovarian carcinoma. Nat Genet. 2018; 50:1262–70. https://doi.org/10.1038/s41588-018-0179-8 [PubMed]
- 14. Jiang P, Tang Y, He L, Tang H, Liang M, Mai C, Hu L, Hong J. Aberrant expression of nuclear KPNA2 is correlated with early recurrence and poor prognosis in patients with small hepatocellular carcinoma after hepatectomy. Med Oncol. 2014; 31:131. https://doi.org/10.1007/s12032-014-0131-4 [PubMed]
- 15. Cai J, Li B, Zhu Y, Fang X, Zhu M, Wang M, Liu S, Jiang X, Zheng J, Zhang X, Chen P. Prognostic Biomarker Identification Through Integrating the Gene Signatures of Hepatocellular Carcinoma Properties. EBioMedicine. 2017; 19:18–30. https://doi.org/10.1016/j.ebiom.2017.04.014 [PubMed]
- 16. Ye J, Wang J, Tan L, Yang S, Xu L, Wu X, Deng H, Tan H. Expression of protein TARBP1 in human hepatocellular carcinoma and its prognostic significance. Int J Clin Exp Pathol. 2015; 8:9089–96. [PubMed]
- 17. Tang H, Zhao H, Yu ZY, Feng X, Fu BS, Qiu CH, Zhang JW. MicroRNA-194 inhibits cell invasion and migration in hepatocellular carcinoma through PRC1-mediated inhibition of Wnt/β-catenin signaling pathway. Dig Liver Dis. 2019; 51:1314–22. https://doi.org/10.1016/j.dld.2019.02.012 [PubMed]
- 18. Liu X, Li Y, Meng L, Liu XY, Peng A, Chen Y, Liu C, Chen H, Sun S, Miao X, Zhang Y, Zheng L, Huang K. Reducing protein regulator of cytokinesis 1 as a prospective therapy for hepatocellular carcinoma. Cell Death Dis. 2018; 9:534. https://doi.org/10.1038/s41419-018-0555-4 [PubMed]
- 19. Wang Y, Shi F, Xing GH, Xie P, Zhao N, Yin YF, Sun SY, He J, Wang Y, Xuan SY. Protein Regulator of Cytokinesis PRC1 Confers Chemoresistance and Predicts an Unfavorable Postoperative Survival of Hepatocellular Carcinoma Patients. J Cancer. 2017; 8:801–08. https://doi.org/10.7150/jca.17640 [PubMed]
- 20. Chen J, Rajasekaran M, Xia H, Zhang X, Kong SN, Sekar K, Seshachalam VP, Deivasigamani A, Goh BK, Ooi LL, Hong W, Hui KM. The microtubule-associated protein PRC1 promotes early recurrence of hepatocellular carcinoma in association with the Wnt/β-catenin signalling pathway. Gut. 2016; 65:1522–34. https://doi.org/10.1136/gutjnl-2015-310625 [PubMed]
- 21. Li C, Zhou D, Hong H, Yang S, Zhang L, Li S, Hu P, Ren H, Mei Z, Tang H. TGFβ1- miR-140-5p axis mediated up-regulation of Flap Endonuclease 1 promotes epithelial-mesenchymal transition in hepatocellular carcinoma. Aging (Albany NY). 2019; 11:5593–612. https://doi.org/10.18632/aging.102140 [PubMed]
- 22. Liu Z, Li J, Chen J, Shan Q, Dai H, Xie H, Zhou L, Xu X, Zheng S. MCM family in HCC: MCM6 indicates adverse tumor features and poor outcomes and promotes S/G2 cell cycle progression. BMC Cancer. 2018; 18:200. https://doi.org/10.1186/s12885-018-4056-8 [PubMed]
- 23. Liu M, Hu Q, Tu M, Wang X, Yang Z, Yang G, Luo R. MCM6 promotes metastasis of hepatocellular carcinoma via MEK/ERK pathway and serves as a novel serum biomarker for early recurrence. J Exp Clin Cancer Res. 2018; 37:10. https://doi.org/10.1186/s13046-017-0669-z [PubMed]
- 24. Zan Y, Wang B, Liang L, Deng Y, Tian T, Dai Z, Dong L. MicroRNA-139 inhibits hepatocellular carcinoma cell growth through down-regulating karyopherin alpha 2. J Exp Clin Cancer Res. 2019; 38:182. https://doi.org/10.1186/s13046-019-1175-2 [PubMed]
- 25. Guo X, Wang Z, Zhang J, Xu Q, Hou G, Yang Y, Dong C, Liu G, Liang C, Liu L, Zhou W, Liu H. Upregulated KPNA2 promotes hepatocellular carcinoma progression and indicates prognostic significance across human cancer types. Acta Biochim Biophys Sin (Shanghai). 2019; 51:285–92. https://doi.org/10.1093/abbs/gmz003 [PubMed]
- 26. Hass HG, Vogel U, Scheurlen M, Jobst J. Gene-expression Analysis Identifies Specific Patterns of Dysregulated Molecular Pathways and Genetic Subgroups of Human Hepatocellular Carcinoma. Anticancer Res. 2016; 36:5087–95. https://doi.org/10.21873/anticanres.11078 [PubMed]
- 27. Zhang D, Liu E, Kang J, Yang X, Liu H. MiR-3613-3p affects cell proliferation and cell cycle in hepatocellular carcinoma. Oncotarget. 2017; 8:93014–28. https://doi.org/10.18632/oncotarget.21745 [PubMed]
- 28. Gao J, Chen H, Yu Y, Song J, Song H, Su X, Li W, Tong X, Qian W, Wang H, Dai J, Guo Y. Inhibition of hepatocellular carcinoma growth using immunoliposomes for co-delivery of adriamycin and ribonucleotide reductase M2 siRNA. Biomaterials. 2013; 34:10084–98. https://doi.org/10.1016/j.biomaterials.2013.08.088 [PubMed]
- 29. Satow R, Shitashige M, Kanai Y, Takeshita F, Ojima H, Jigami T, Honda K, Kosuge T, Ochiya T, Hirohashi S, Yamada T. Combined functional genome survey of therapeutic targets for hepatocellular carcinoma. Clin Cancer Res. 2010; 16:2518–28. https://doi.org/10.1158/1078-0432.CCR-09-2214 [PubMed]
- 30. Li Y, Zhou B, Dai J, Liu R, Han ZG. Aberrant upregulation of LRRC1 contributes to human hepatocellular carcinoma. Mol Biol Rep. 2013; 40:4543–51. https://doi.org/10.1007/s11033-013-2549-8 [PubMed]
- 31. Yu J, Zhou J, Xu F, Bai W, Zhang W. High expression of Aurora-B is correlated with poor prognosis and drug resistance in non-small cell lung cancer. Int J Biol Markers. 2018; 33:215–21. https://doi.org/10.1177/1724600817753098 [PubMed]
- 32. Huang D, Huang Y, Huang Z, Weng J, Zhang S, Gu W. Relation of AURKB over-expression to low survival rate in BCRA and reversine-modulated aurora B kinase in breast cancer cell lines. Cancer Cell Int. 2019; 19:166. https://doi.org/10.1186/s12935-019-0885-z [PubMed]
- 33. Liu Z, Sun Q, Wang X. PLK1, A potential target for cancer therapy. Transl Oncol. 2017; 10:22–32. https://doi.org/10.1016/j.tranon.2016.10.003 [PubMed]
- 34. Yang X, Chen G, Li W, Peng C, Zhu Y, Yang X, Li T, Cao C, Pei H. Cervical cancer growth is regulated by a c-ABL-PLK1 signaling axis. Cancer Res. 2017; 77:1142–54. https://doi.org/10.1158/0008-5472.CAN-16-1378 [PubMed]
- 35. Zhang H, Ba S, Mahajan D, Lee JY, Ye R, Shao F, Lu L, Li T. Versatile Types of DNA-Based Nanobiosensors for Specific Detection of Cancer Biomarker FEN1 in Living Cells and Cell-Free Systems. Nano Lett. 2018; 18:7383–88. https://doi.org/10.1021/acs.nanolett.8b03724 [PubMed]
- 36. Christiansen A, Dyrskjøt L. The functional role of the novel biomarker karyopherin α 2 (KPNA2) in cancer. Cancer Lett. 2013; 331:18–23. https://doi.org/10.1016/j.canlet.2012.12.013 [PubMed]
- 37. Valverde LF, de Freitas RD, Pereira TA, de Resende MF, Agra IM, Dos Santos JN, Dos Reis MG, Sales CB, Gurgel Rocha CA. MCM3: A novel proliferation marker in oral squamous cell carcinoma. Appl Immunohistochem Mol Morphol. 2018; 26:120–25. https://doi.org/10.1097/PAI.0000000000000397 [PubMed]
- 38. Guo S, Ran H, Xiao D, Huang H, Mi L, Wang X, Chen L, Li D, Zhang S, Han Q, Zhou T, Li A, Man J. NT5DC2 promotes tumorigenicity of glioma stem-like cells by upregulating fyn. Cancer Lett. 2019; 454:98–107. https://doi.org/10.1016/j.canlet.2019.04.003 [PubMed]
- 39. Su W, Han HH, Wang Y, Zhang B, Zhou B, Cheng Y, Rumandla A, Gurrapu S, Chakraborty G, Su J, Yang G, Liang X, Wang G, et al. The polycomb repressor complex 1 drives double-negative prostate cancer metastasis by coordinating stemness and immune suppression. Cancer Cell. 2019; 36:139–155.e10. https://doi.org/10.1016/j.ccell.2019.06.009 [PubMed]
- 40. Xu J, Liu H, Yang Y, Wang X, Liu P, Li Y, Meyers C, Banerjee NS, Wang HK, Cam M, Lu W, Chow LT, Xie X, et al. Genome-wide profiling of cervical RNA-binding proteins identifies human papillomavirus regulation of RNASEH2A expression by viral E7 and E2F1. MBio. 2019; 10:e02687–18. https://doi.org/10.1128/mBio.02687-18 [PubMed]
- 41. Rasmussen RD, Gajjar MK, Tuckova L, Jensen KE, Maya-Mendoza A, Holst CB, Møllgaard K, Rasmussen JS, Brennum J, Bartek J
Jr , Syrucek M, Sedlakova E, Andersen KK, et al. BRCA1-regulated RRM2 expression protects glioblastoma cells from endogenous replication stress and promotes tumorigenicity. Nat Commun. 2016; 7:13398. https://doi.org/10.1038/ncomms13398 [PubMed] - 42. Damas ND, Marcatti M, Côme C, Christensen LL, Nielsen MM, Baumgartner R, Gylling HM, Maglieri G, Rundsten CF, Seemann SE, Rapin N, Thézenas S, Vang S, et al. SNHG5 promotes colorectal cancer cell survival by counteracting STAU1-mediated mRNA destabilization. Nat Commun. 2016; 7:13875. https://doi.org/10.1038/ncomms13875 [PubMed]
- 43. Gauthier L, Morel A, Anceriz N, Rossi B, Blanchard-Alvarez A, Grondin G, Trichard S, Cesari C, Sapet M, Bosco F, Rispaud-Blanc H, Guillot F, Cornen S, et al. Multifunctional natural killer cell engagers targeting NKp46 trigger protective tumor immunity. Cell. 2019; 177:1701–1713.e16. https://doi.org/10.1016/j.cell.2019.04.041 [PubMed]
- 44. Di Pilato M, Kim EY, Cadilha BL, Prüßmann JN, Nasrallah MN, Seruggia D, Usmani SM, Misale S, Zappulli V, Carrizosa E, Mani V, Ligorio M, Warner RD, et al. Targeting the CBM complex causes Treg cells to prime tumours for immune checkpoint therapy. Nature. 2019; 570:112–16. https://doi.org/10.1038/s41586-019-1215-2 [PubMed]
- 45. Garris CS, Arlauckas SP, Kohler RH, Trefny MP, Garren S, Piot C, Engblom C, Pfirschke C, Siwicki M, Gungabeesoon J, Freeman GJ, Warren SE, Ong S, et al. Successful anti-PD-1 cancer immunotherapy requires T cell-dendritic cell crosstalk involving the cytokines IFN-gamma and IL-12. Immunity. 2018; 49:1148–1161.e7. https://doi.org/10.1016/j.immuni.2018.09.024 [PubMed]
- 46. Naing A, Infante JR, Papadopoulos KP, Chan IH, Shen C, Ratti NP, Rojo B, Autio KA, Wong DJ, Patel MR, Ott PA, Falchook GS, Pant S, et al. PEGylated IL-10 (Pegilodecakin) induces systemic immune activation, CD8(+) T cell invigoration and polyclonal T cell expansion in cancer patients. Cancer Cell. 2018; 34:775–791.e3. https://doi.org/10.1016/j.ccell.2018.10.007 [PubMed]
- 47. Li T, Fan J, Wang B, Traugh N, Chen Q, Liu JS, Li B, Liu XS. TIMER: A Web Server for Comprehensive Analysis of Tumor-Infiltrating Immune Cells. Cancer Res. 2017; 77:e108–10. https://doi.org/10.1158/0008-5472.CAN-17-0307 [PubMed]
- 48. Li B, Severson E, Pignon JC, Zhao H, Li T, Novak J, Jiang P, Shen H, Aster JC, Rodig S, Signoretti S, Liu JS, Liu XS. Comprehensive analyses of tumor immunity: implications for cancer immunotherapy. Genome Biol. 2016; 17:174. https://doi.org/10.1186/s13059-016-1028-7 [PubMed]
- 49. Hua S, Lei L, Deng L, Weng X, Liu C, Qi X, Wang S, Zhang D, Zou X, Cao C, Liu L, Wu D. miR-139-5p inhibits aerobic glycolysis, cell proliferation, migration, and invasion in hepatocellular carcinoma via a reciprocal regulatory interaction with ETS1. Oncogene. 2018; 37:1624–36. https://doi.org/10.1038/s41388-017-0057-3 [PubMed]