


Introduction
Esophageal cancer (EC) is one of the most prevalent malignancies and common causes of cancer-related death globally [1]. The main pathological subtypes included esophageal adenocarcinoma (EA) and esophageal squamous cell carcinoma (ESCC). ESCC accounts for 90% of EC in Asian countries, including China and Japan [2]. Although great advances in treatment were achieved in last decades, the prognosis of EC is still unsatisfactory [3, 4].
Cancer is the phonotypic end point of accumulated genetic and epigenomic alterations [5]. Many endogenous and exogenous factors, such as DNA damage repair inactivation, DNA erroneous replication, microsatellite instability, and carcinogen exposure, lead to increased somatic mutations [6]. The total number of mutations occurring in a tumor specimen is termed tumor mutation burden (TMB), which sketches out the status of genomic mutation [6]. Increasing attentions have been drawn to the linkage of genomic mutation profiling to patient characteristics with clinical outcome recently.
Previous evidence suggested that higher TMB was likely to harbor more neoantigens as targets for activated immune cells [7]. The impacts of the TMB on tumor progression or immune infiltration are still to be investigated [8]. Many studies revealed the link between immunotherapy responses and TMB [9–12]. While not all mutations generate immunogenic, only a few mutations can be recognized by T cells [13–15]. Therefore, understanding the immune cell composition and function is critical to effectively manage cancer progression and immune response.
In the presented study, we analyzed the difference of clinical features, such as ages, genders, tumor grades, tumor stages, races and radiation, between high TMB (TMB-H) and low TMB (TMB-L) groups. Then, we evaluated the genomic landscape of EC patients, and their associations with clinical parameters (genders, TNM stages, T stage, N stage and M stage) and overall survival (OS). Additionally, the correlation between TMB and immune cell infiltration was analyzed in EC patients with or without radiotherapy. Our analysis showed that TMB might be a potential prognostic assessment marker. Especially for patients not receiving radiotherapy, the prognosis of TMB-H patients was significantly poorer than that of TMB-L patients, which might result from the different degrees of regulatory T cell infiltration.
Results
Mutational genomic landscape
The summary of mutational genomic landscape was shown in Figure 1. By calculating the 9 variant classifications separately, missense mutation had the highest mutation frequency in the total mutation frequency (Figure 1A). In addition, single nucleotide polymorphism (SNP) was more common than INS and DEL (Figure 1B). Single nucleotide variants (SNVs) were classified into 6 base substitutions (C > A, C > G, C > T, T > A, T > C and T > G), and the results indicated C > T had the highest incidence (16511 times, Figure 1C). The values of variants varied from 0 to 1585, with a median value of 87 (Figure 1D). Missense mutation had the highest mutation frequency in personal mutation frequency (Figure 1E). We calculated the genes with the highest mutational rate, and the top 10 mutated genes were as follows: TP53, TTN, MUC16, SYNE1, CSMD3, MUC4, FLG, PCLO, DNAH5 and HMCN1 (Figure 1F). The waterfall map summarized the high mutated genes and their mutation classification (Figure 2). In addition, the proportion of more mutated genes was visualized using the genecloud (Supplementary Figure 1). Genes with mutation frequency ≥ 5 times were presented in the genecloud, which was consistent with the results in Figure 1F and Figure 2. These high mutated genes might be functionally related, therefore, we further studied their interaction. The co-occurrence and exclusive relationships between these mutant genes were shown in Supplementary Figure 2. The co-occurrence correlation between RYR2 and FLG was the most significant (P < 0.001).
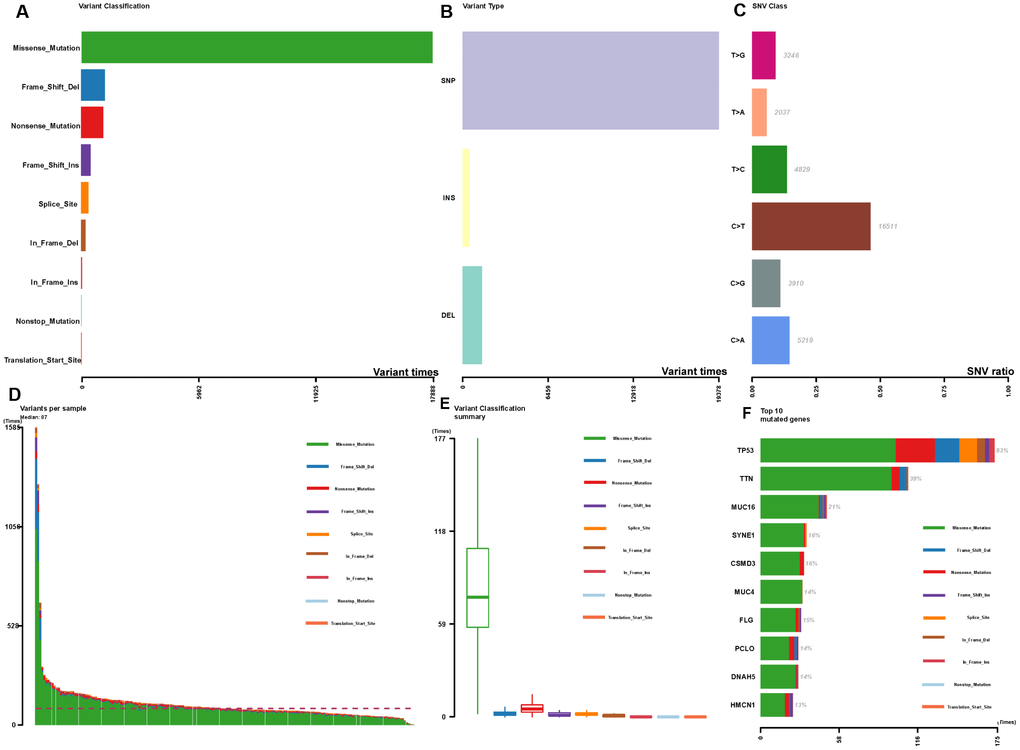
Figure 1. Summary of the mutation information with statistical calculations. (A–C) Classification of mutation types according to different categories, in which missense mutation accounts for the most fraction, SNP showed more frequency than insertion or deletion, and C>T was the most common of SNV; (D, E) TMB in specific samples; (F) the top 10 mutated genes in EC.
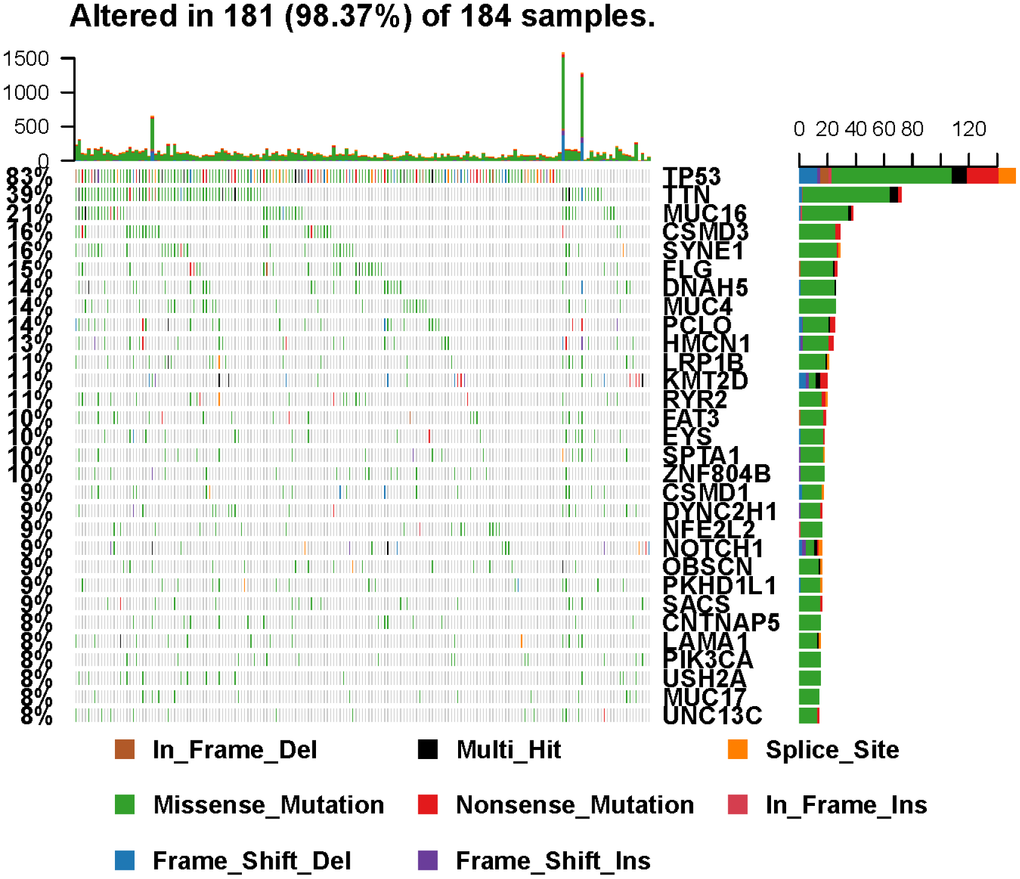
Figure 2. Landscape of mutation profiles in EC samples. Mutation information of each gene in each sample was shown in the waterfall plot, in which various colors with annotations at the bottom represented the different mutation types. The barplot above the legend exhibited the mutational burden.
An overview of the clinical implications associated with TMB
These 182 patients included in this study were consisted of 95 ESCC and 87 EA. The general characteristics of patients with EC were shown in Table 1. To determine the critical value of TMB, population was divided into 2 groups by mean values. The clinical factors, such as ages, genders, tumor grades, tumor stages, races and radiation, were not associated with TMB levels (P > 0.05). In addition, the level of TMB in EA was significantly higher than that in ESCC, but there was no significant difference of OS between the 2 tumor subtypes (Supplementary Figure 3).
Table 1. General characteristics of patients with esophageal cancer.
| Characteristics | TMB-L group (n = 134) | TMB-H group (n = 48) | ES | P value | |||||||||||||||||||||||||||||||||||||||||||||||||||||||||||||||||||||||||||||||||||||||||||||||
| Age (years) | 62.95 (28.01-90.06) | 68.61 (44.02-90.06) | -2.265 | 0.605 | |||||||||||||||||||||||||||||||||||||||||||||||||||||||||||||||||||||||||||||||||||||||||||||||
| Gender | 0.179 | 0.677 | |||||||||||||||||||||||||||||||||||||||||||||||||||||||||||||||||||||||||||||||||||||||||||||||||
| Male (%) | 115 (85.82%) | 40 (83.33%) | |||||||||||||||||||||||||||||||||||||||||||||||||||||||||||||||||||||||||||||||||||||||||||||||||
| Tumor grade (n) | 4.431 | 0.219 | |||||||||||||||||||||||||||||||||||||||||||||||||||||||||||||||||||||||||||||||||||||||||||||||||
| G1 | 13 | 6 | |||||||||||||||||||||||||||||||||||||||||||||||||||||||||||||||||||||||||||||||||||||||||||||||||
| G2 | 60 | 15 | |||||||||||||||||||||||||||||||||||||||||||||||||||||||||||||||||||||||||||||||||||||||||||||||||
| G3 | 36 | 12 | |||||||||||||||||||||||||||||||||||||||||||||||||||||||||||||||||||||||||||||||||||||||||||||||||
| unknow | 25 | 15 | |||||||||||||||||||||||||||||||||||||||||||||||||||||||||||||||||||||||||||||||||||||||||||||||||
| Stage (n) | 1.945 | 0.746 | |||||||||||||||||||||||||||||||||||||||||||||||||||||||||||||||||||||||||||||||||||||||||||||||||
| I | 15 | 3 | |||||||||||||||||||||||||||||||||||||||||||||||||||||||||||||||||||||||||||||||||||||||||||||||||
| II | 57 | 21 | |||||||||||||||||||||||||||||||||||||||||||||||||||||||||||||||||||||||||||||||||||||||||||||||||
| III | 37 | 17 | |||||||||||||||||||||||||||||||||||||||||||||||||||||||||||||||||||||||||||||||||||||||||||||||||
| IV | 7 | 2 | |||||||||||||||||||||||||||||||||||||||||||||||||||||||||||||||||||||||||||||||||||||||||||||||||
| unknow | 18 | 5 | |||||||||||||||||||||||||||||||||||||||||||||||||||||||||||||||||||||||||||||||||||||||||||||||||
| Race | 7.712 | 0.052 | |||||||||||||||||||||||||||||||||||||||||||||||||||||||||||||||||||||||||||||||||||||||||||||||||
| White | 79 | 33 | |||||||||||||||||||||||||||||||||||||||||||||||||||||||||||||||||||||||||||||||||||||||||||||||||
| Asian | 39 | 7 | |||||||||||||||||||||||||||||||||||||||||||||||||||||||||||||||||||||||||||||||||||||||||||||||||
| Black or African American | 5 | 0 | |||||||||||||||||||||||||||||||||||||||||||||||||||||||||||||||||||||||||||||||||||||||||||||||||
| Unknown | 11 | 8 | |||||||||||||||||||||||||||||||||||||||||||||||||||||||||||||||||||||||||||||||||||||||||||||||||
| Radiation | 1.288 | 0.525 | |||||||||||||||||||||||||||||||||||||||||||||||||||||||||||||||||||||||||||||||||||||||||||||||||
| Yes | 15 | 3 | |||||||||||||||||||||||||||||||||||||||||||||||||||||||||||||||||||||||||||||||||||||||||||||||||
| No | 96 | 38 | |||||||||||||||||||||||||||||||||||||||||||||||||||||||||||||||||||||||||||||||||||||||||||||||||
| unknow | 23 | 7 | |||||||||||||||||||||||||||||||||||||||||||||||||||||||||||||||||||||||||||||||||||||||||||||||||
| TMB: tumor mutation burden; TMB-H: high TMB; TMB-L: low TMB; ES: effect size. | |||||||||||||||||||||||||||||||||||||||||||||||||||||||||||||||||||||||||||||||||||||||||||||||||||
After integrating TMB and clinical information (genders, TNM stages, T stage, N stage and M stage), univariate and multivariate regression analysis on the impacts of prognosis were performed. The univariate regression analysis indicated that TMB, TNM stages, T stage, N stage and M stage were high-risk prognostic factors (hazard ratio > 1 and P < 0.05, Figure 3A). Multivariate regression analysis suggested TMB as the independent prognostic factor (hazard ratio = 1.051, P = 0.003, Figure 3B). Then, we further studied the relationship between TMB and TNM stages, and found that there was no significant correlation between TMB and TNM stages (TNM stage: P = 0.808, Figure 3C; T stage: P = 0.396, Figure 3D; N stage: P = 0.963, Figure 3E and M stage: P = 0.811, Figure 3F).
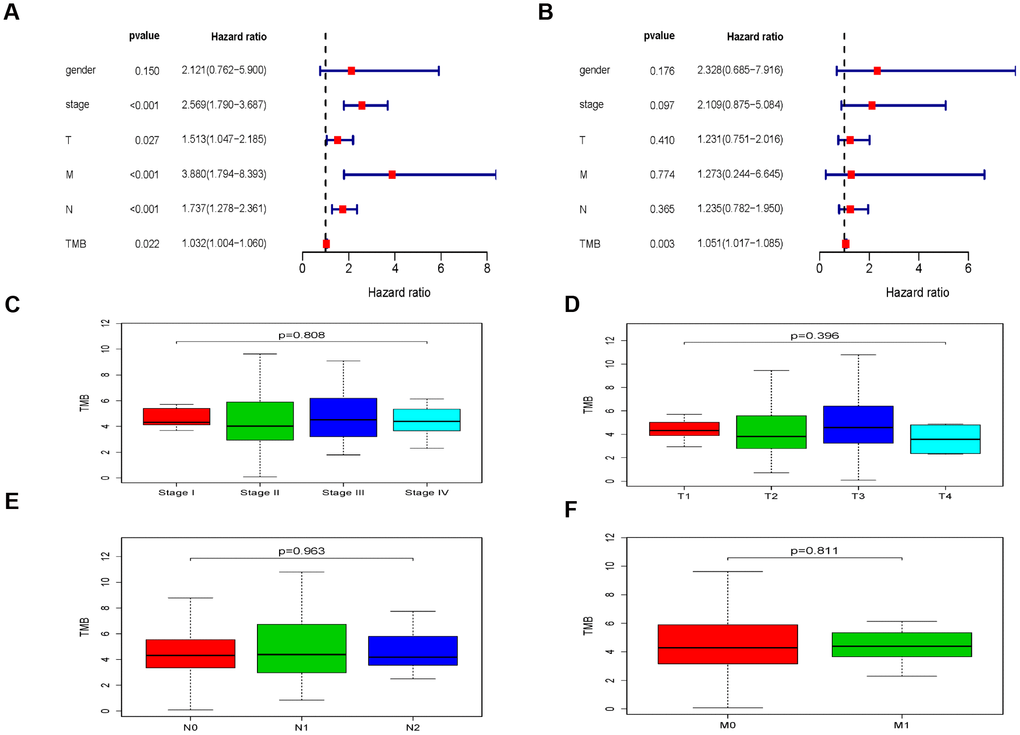
Figure 3. The clinical implications associated with TMB. (A) The univariate regression analysis of TMB and clinical information. (B) The multivariate regression analysis of TMB and clinical information. (C–F) The relationship between TMB and TNM stages.
Kaplan-Meier analysis indicated that there was no significant difference of OS between the TMB-H group and TMB-L groups (P = 0.082, Figure 4A). Considering the effects of radiotherapy on TMB and prognosis, we performed a subgroup analysis based on whether they received radiotherapy or not. There was no significant difference of OS between the TMB-H and TMB-L group in EC patients receiving radiotherapy (P = 0.165, Figure 4B), however, OS of the TMB-H group decreased significantly in EC patients who did not receive radiotherapy (P = 0.038, Figure 4C).
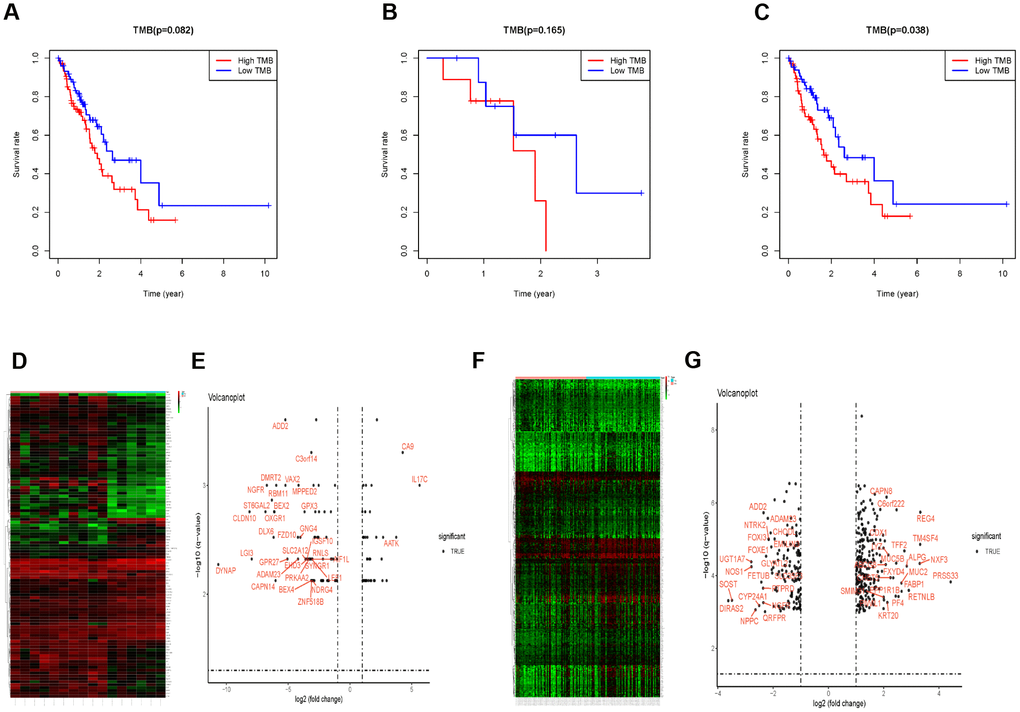
Figure 4. The subgroup analysis in patients receiving radiotherapy or not. (A) Survival analysis to explore the OS of EC patients between the TMB-H and TMB-L group. (B) OS between the TMB-H and TMB-L group of patients receiving radiotherapy. (C) OS of the TMB-H group decreased significantly in EC patients with radiotherapy. (D–G) The different gene expression between the TMB-H and TMB-L groups in EC patients receiving radiotherapy or not.
Immune infiltration between the TMB-H group and TMB-L group
Prior to the immune infiltration, differences of gene expression between the TMB-H and TMB-L groups were calculated and visualized by “limma” package (Radiotherapy: Figure 4D and 4E; without Radiotherapy: Figure 4F and 4G). Based on this differentially expressed data, we used the deconvolution method to calculate the difference of immune cell infiltration between the TMB-H and TMB-L groups. The TMB-H group had significantly increased Tregs cell infiltration in EC patients who did not receive radiotherapy (P = 0.033), while there was no significantly different infiltration of 22 kinds of immune cells among patients receiving radiotherapy (Figure 5).
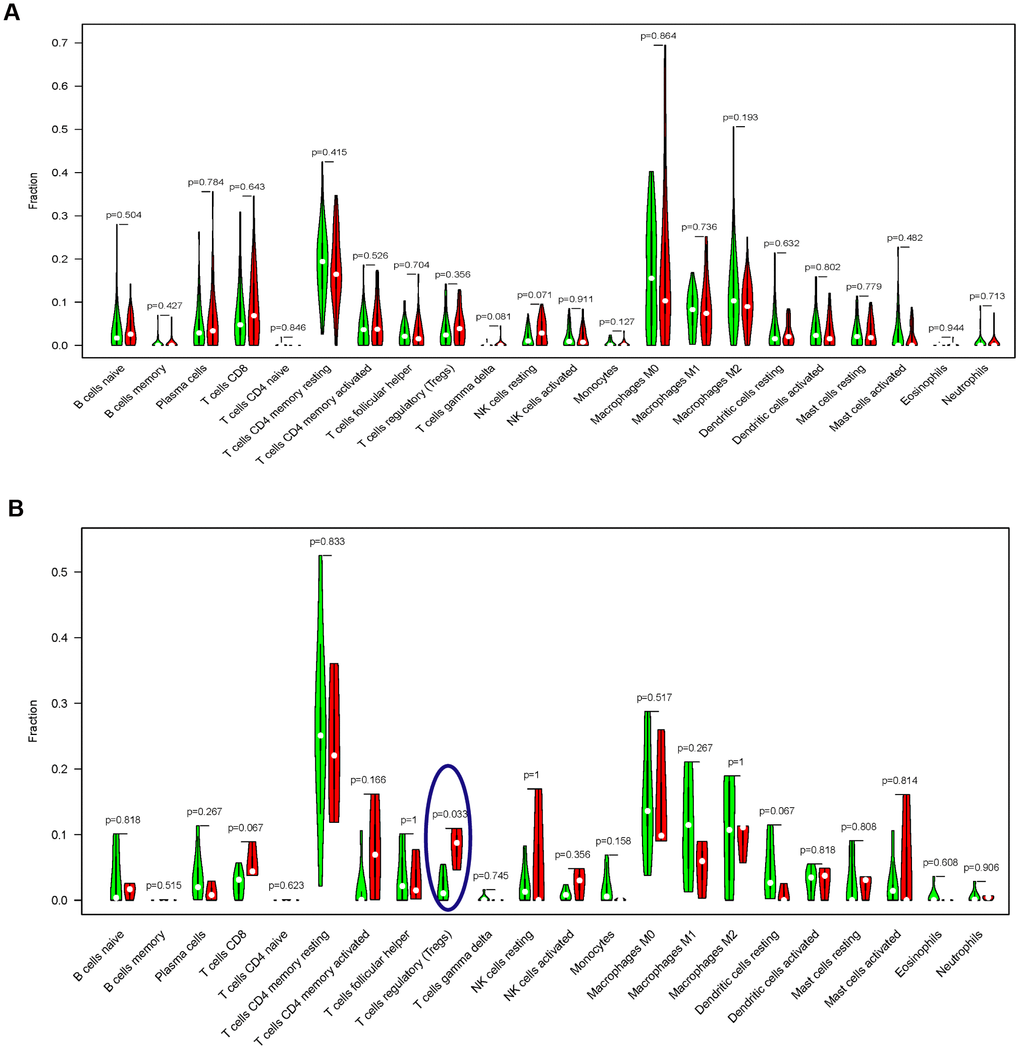
Figure 5. Comparisons of 22 important immune fractions between the TMB-H and TMB-L groups. (A) No significant difference of the 22 important immune cell infiltration between the TMB-H and TMB-L groups in EC patients with radiotherapy; (B) The levels of Tregs cell infiltration in the TMB-L group were lower compared with those in the TMB-H group of EC patients without radiotherapy.
Discussion
With the rapid development of microarray sequencing, researchers are increasingly exploring new targets and performing external validations using statistical algorithms in cancer. However, most current studies have not effectively classified and analyzed the components of immune cells and the TMB, which may markedly affect the characteristics of cancer treatment response, especially precision radiotherapy. The CheckMate 227 trial recently established a TMB of ≥10 mutations per 106 bases as a robust and independent biomarker of response [16]. These data recently led radiation oncologists to speculate whether the improved efficacy was caused by radiation-induced TMB. As a tumor with high mutational loads, EC was estimated to have 3,000 to 300,000 mutations per tumor [17, 18]. Therefore, we attempted to explore immune cell components and degrees of TMB, extracting significant biomarkers of large prognostic value to understand tumor progression in EC patients with or without radiotherapy.
We constructed a model based on the TMB status and classified EC patients into TMB-H and TMB-L groups by the mean of population TMB. Patients with less TMB had a better prognosis, suggesting that TMB as a risk-independent prognostic factor. Cigarette smoking was identified as an important pathogenic factor for ESCC [19]. The TMB-H group was composed of smoking, aging and other cancer risk factors related patients, which accorded with the results of adverse prognosis. Our study suggested that TMB was an important prognostic factor for EC, however, there was no difference of survival analysis results. To explain this contradiction, subgroup analysis was performed based on whether patients received radiotherapy or not.
Our study is the first to analyze the correlation between radiotherapy and TMB in EC patients. For EC patients who did not receive radiotherapy, the OS of the TMB-L group was significantly prolonged. Excluding the interference of radiotherapy, TMB was a prognostic factor. Radiotherapy might improve the impact of TMB on EC via regulating immune infiltration. Treg cell infiltration was induced in the TMB-H group of EC patients who did not receive radiotherapy. Treg cell plays a central role for maintenance of immune homeostasis and self-tolerance [20–23]. It was well recognized that the immunosuppression caused by the accumulation of Treg cells in the tumor microenvironment led to poor prognosis in cancer patients [24–27]. In addition, Treg cells were also important prognostic variables in patients receiving radiotherapy [28]. Previous studies reported that the numbers of Treg cells and their immunosuppressive functions were both increased after radiotherapy [29–32]. Treg cells were reported to weaken the clearance of cancer cells by radiotherapy and induce resistance to radiotherapy [33].
TMB is associated with the abundance of neoantigens and increased immunogenicity [34, 35], as well as increased immunogenicity [36]. High TMB reflects the presence of mutation-associated neoantigens, with consequent increased lymphocyte infiltration in the tumor microenvironment [37, 38]. Treg cell infiltration in the TMB-H group was significantly higher than that in the TMB-L group for EC patients without radiotherapy, while there was no difference of Treg cell infiltration in EC patients receiving radiotherapy. Whether radiotherapy balanced the Treg cell infiltration, or Treg cell infiltration was affected by other characteristics of EC patients receiving radiotherapy still needs to be further explored.
It should be noted that the correlation between the infiltration of immune cells and the level of TMB was not consistent in different tumors. For example, most of the immune signatures were upregulated in the TMB-L subtype, while downregulated in the TMB-L subtype of cervical squamous cell carcinoma. The Treg cells were inclined to be upregulated in the TMB-L subtype of various cancer types, however, we found that high TMB was associated with elevated Treg cell infiltration in EC patients without radiotherapy. Some studies suggested that high TMB resulted in numerous neoantigens that incited anti-tumor immune responses [11], and that high TMB was associated with genomic instability, resulting in induced anti-tumor immune responses [39]. Another reason behind the discrepancy could be that most of the TCGA patients were not treated with immunotherapy. Indeed, for the TCGA cases likely with immunotherapy such as melanoma, higher TMB was associated with better prognosis.
There were some limitations in our research that could not be ignored. First, the number of patients receiving radiotherapy reported in the TCGA database was small. The limited sample size led to instability of statistical results. Second, we did not exclude the extreme value of poor prognosis (such as OS < 90 days). The existence of these data would most likely interfere with the outcome of survival analysis.
Together, we performed a comprehensive analysis on TMB in EC, and our results suggested that TMB could be considered as a prognostic marker in the patients who did not receive radiotherapy. The prognosis of the TMB-H patients was significantly lower than that of TMB-L, which might be related to the difference in Treg cell infiltration. Further studies are needed to characterize molecular subtyping based on TMB and to explore potential relationships between Treg cell infiltration and TMB.
Materials and Methods
Data extraction from dataset
All the EC patients’ somatic mutations data, transcriptome sequencing data, and clinical information were downloaded and collected from The Cancer Genome Atlas (TCGA, https://portal.gdc.cancer.gov/). TMB was defined by the number of somatic mutations per genomic area for target sequencing. Specifically, TMB is calculated by the total number of somatic mutations / total covered bases.
Mutation signature analysis
Mutation signature analysis was performed to devolve cancer somatic mutation counts, stratified by mutation contexts or biologically meaningful subgroups, into a set of characteristic signatures and to infer the pattern of each discovered signatures across samples. All SNVs were classified into 96 possible mutation categories based on the 6 base substitutions (C > A, C > G, C > T, T > A, T > C and T > G) and 16 possible combinations of neighboring bases within the trinucleotide sequence context. In order to compare the eigenvalues of the TBM-L group and TMB-H group, Wilcoxon test was used to identify the difference of mutation characteristics.
Gene expression analysis
The raw biological data of DNA microarray were preprocessed and normalized to remove bias and ensure the uniformity and integrity. Background correction, propensity analysis, normalization and visualization output of probe data were then performed with robust multi-array average analysis algorithm in “limma” package. Differential expression genes (DEGs) were determined between the TBM-L and TMB-H group. The cut-offs were (|log2(FC)| > 1 and P value < 0.05.
Analysis of the correlation between TMB and clinical data
Clinicopathological parameters including TNM stages in EC patients were analyzed and displayed according the TMB scores. The Wilcox test (gender, M stage and TMB) or Kruskal test (TNM stages, T stage and N stage) was utilized to measure statistically significance. The primary end point of survival comparison for EC patients was OS, which was evaluated from the date of first therapy to the date of death or last follow-up. The EC patients were divided into 2 subgroups based on whether they received radiotherapy or not. The prognosis of the 2 subgroups was then analyzed separately. The follow-up duration was estimated using the Kaplan-Meier method and log-rank test in distinct curves. All hypothetical tests were two-sided and P value < 0.05 was considered significant in all tests.
Immune infiltration
The relative levels of distinct immune cell types were quantified using CIBERSORT within a complex gene expression mixture. Each immune cell subtype was characterized and quantified using gene expression signatures consistent of ~500 genes in CIBERSORT. Here, gene expression datasets were prepared using standard annotation files and data uploaded to the CIBERSORT web portal (http://cibersort.stanford.edu/), with the algorithm run using the default signature matrix at 1,000 permutations.
Supplementary Materials
Author Contributions
The work presented here was carried out in collaboration among all authors. CX and YG defined the research theme, discussed analyses, interpretation, and presentation. CY and LX drafted the manuscript, analyzed the data, developed the algorithm and interpreted the results. CY, KC, JZ, YL, WS, NZ, JR and JZ co-worked on associated data collection and helped to draft the manuscript. CY and LX helped to perform the statistical analysis, software and reference collection. All authors read and approved the final manuscript.
Conflicts of Interest
The authors declare no conflicts of interests.
Funding
This work was supported by grants from the Chinese National Natural Science Foundation (81773236, 81800429, and 81972852), Health Commission of Hubei Province (WJ2019Q047 and WJ2019H002), the Fundamental Research Funds for the Central Universities (2042018kf0065, 2042018kf1037, and 2042019kf0329), Young and Middle-Aged Medical Backbone Talents (WHQG201902), Medical Science Advancement Program (Basic Medical Sciences) of Wuhan University (TFJC2018005), and Zhongnan Hospital of Wuhan University Science, Technology and Innovation Seed Fund (znpy2017001, and znpy2017049, znpy2018028, and znpy2018070).
References
- 1. Ferlay J, Shin HR, Bray F, Forman D, Mathers C, Parkin DM. Estimates of worldwide burden of cancer in 2008: GLOBOCAN 2008. Int J Cancer. 2010; 127:2893–917. https://doi.org/10.1002/ijc.25516 [PubMed]
- 2. Nakamura M, Iwahashi M, Nakamori M, Ojima T, Katsuda M, Iida T, Hayata K, Kato T, Yamaue H. New prognostic score for the survival of patients with esophageal squamous cell carcinoma. Surg Today. 2014; 44:875–83. https://doi.org/10.1007/s00595-013-0628-z [PubMed]
- 3. Siewert JR, Stein HJ, Feith M, Bruecher BL, Bartels H, Fink U. Histologic tumor type is an independent prognostic parameter in esophageal cancer: lessons from more than 1,000 consecutive resections at a single center in the Western world. Ann Surg. 2001; 234:360–67. https://doi.org/10.1097/00000658-200109000-00010 [PubMed]
- 4. Wang J, Wu N, Zheng QF, Yan S, Lv C, Li SL, Yang Y. Evaluation of the 7th edition of the TNM classification in patients with resected esophageal squamous cell carcinoma. World J Gastroenterol. 2014; 20:18397–403. https://doi.org/10.3748/wjg.v20.i48.18397 [PubMed]
- 5. Stratton MR, Campbell PJ, Futreal PA. The cancer genome. Nature. 2009; 458:719–24. https://doi.org/10.1038/nature07943 [PubMed]
- 6. Chalmers ZR, Connelly CF, Fabrizio D, Gay L, Ali SM, Ennis R, Schrock A, Campbell B, Shlien A, Chmielecki J, Huang F, He Y, Sun J, et al. Analysis of 100,000 human cancer genomes reveals the landscape of tumor mutational burden. Genome Med. 2017; 9:34. https://doi.org/10.1186/s13073-017-0424-2 [PubMed]
- 7. Wang C, Liang H, Lin C, Li F, Xie G, Qiao S, Shi X, Deng J, Zhao X, Wu K, Zhang X. Molecular Subtyping and Prognostic Assessment Based on Tumor Mutation Burden in Patients with Lung Adenocarcinomas. Int J Mol Sci. 2019; 20. https://doi.org/10.3390/ijms20174251 [PubMed]
- 8. Li F, Kitajima S, Kohno S, Yoshida A, Tange S, Sasaki S, Okada N, Nishimoto Y, Muranaka H, Nagatani N, Suzuki M, Masuda S, Thai TC, et al. Retinoblastoma Inactivation Induces a Protumoral Microenvironment via Enhanced CCL2 Secretion. Cancer Res. 2019; 79:3903–15. https://doi.org/10.1158/0008-5472.CAN-18-3604 [PubMed]
- 9. Van Allen EM, Miao D, Schilling B, Shukla SA, Blank C, Zimmer L, Sucker A, Hillen U, Foppen MH, Goldinger SM, Utikal J, Hassel JC, Weide B, et al. Genomic correlates of response to CTLA-4 blockade in metastatic melanoma. Science. 2015; 350:207–11. https://doi.org/10.1126/science.aad0095 [PubMed]
- 10. June CH, O’Connor RS, Kawalekar OU, Ghassemi S, Milone MC. CAR T cell immunotherapy for human cancer. Science. 2018; 359:1361–65. https://doi.org/10.1126/science.aar6711 [PubMed]
- 11. Rizvi NA, Hellmann MD, Snyder A, Kvistborg P, Makarov V, Havel JJ, Lee W, Yuan J, Wong P, Ho TS, Miller ML, Rekhtman N, Moreira AL, et al. Cancer immunology. Mutational landscape determines sensitivity to PD-1 blockade in non-small cell lung cancer. Science. 2015; 348:124–28. https://doi.org/10.1126/science.aaa1348 [PubMed]
- 12. Hugo W, Zaretsky JM, Sun L, Song C, Moreno BH, Hu-Lieskovan S, Berent-Maoz B, Pang J, Chmielowski B, Cherry G, Seja E, Lomeli S, Kong X, et al. Genomic and Transcriptomic Features of Response to Anti-PD-1 Therapy in Metastatic Melanoma. Cell. 2017; 168:542. https://doi.org/10.1016/j.cell.2017.01.010 [PubMed]
- 13. Coulie PG, Van den Eynde BJ, van der Bruggen P, Boon T. Tumour antigens recognized by T lymphocytes: at the core of cancer immunotherapy. Nat Rev Cancer. 2014; 14:135–46. https://doi.org/10.1038/nrc3670 [PubMed]
- 14. Carreno BM, Magrini V, Becker-Hapak M, Kaabinejadian S, Hundal J, Petti AA, Ly A, Lie WR, Hildebrand WH, Mardis ER, Linette GP. Cancer immunotherapy. A dendritic cell vaccine increases the breadth and diversity of melanoma neoantigen-specific T cells. Science. 2015; 348:803–08. https://doi.org/10.1126/science.aaa3828 [PubMed]
- 15. Snyder A, Chan TA. Immunogenic peptide discovery in cancer genomes. Curr Opin Genet Dev. 2015; 30:7–16. https://doi.org/10.1016/j.gde.2014.12.003 [PubMed]
- 16. Hellmann MD, Ciuleanu TE, Pluzanski A, Lee JS, Otterson GA, Audigier-Valette C, Minenza E, Linardou H, Burgers S, Salman P, Borghaei H, Ramalingam SS, Brahmer J, et al. Nivolumab plus Ipilimumab in Lung Cancer with a High Tumor Mutational Burden. N Engl J Med. 2018; 378:2093–104. https://doi.org/10.1056/NEJMoa1801946 [PubMed]
- 17. Lawrence MS, Stojanov P, Polak P, Kryukov GV, Cibulskis K, Sivachenko A, Carter SL, Stewart C, Mermel CH, Roberts SA, Kiezun A, Hammerman PS, McKenna A, et al. Mutational heterogeneity in cancer and the search for new cancer-associated genes. Nature. 2013; 499:214–18. https://doi.org/10.1038/nature12213 [PubMed]
- 18. Dhupar R, Van Der Kraak L, Pennathur A, Schuchert MJ, Nason KS, Luketich JD, Lotze MT. Targeting Immune Checkpoints in Esophageal Cancer: A High Mutational Load Tumor. Ann Thorac Surg. 2017; 103:1340–49. https://doi.org/10.1016/j.athoracsur.2016.12.011 [PubMed]
- 19. Domper Arnal MJ, Ferrández Arenas Á, Lanas Arbeloa Á. Esophageal cancer: risk factors, screening and endoscopic treatment in Western and Eastern countries. World J Gastroenterol. 2015; 21:7933–43. https://doi.org/10.3748/wjg.v21.i26.7933 [PubMed]
- 20. Kim JM, Rasmussen JP, Rudensky AY. Regulatory T cells prevent catastrophic autoimmunity throughout the lifespan of mice. Nat Immunol. 2007; 8:191–97. https://doi.org/10.1038/ni1428 [PubMed]
- 21. Lahl K, Loddenkemper C, Drouin C, Freyer J, Arnason J, Eberl G, Hamann A, Wagner H, Huehn J, Sparwasser T. Selective depletion of Foxp3+ regulatory T cells induces a scurfy-like disease. J Exp Med. 2007; 204:57–63. https://doi.org/10.1084/jem.20061852 [PubMed]
- 22. Wolf D, Sopper S, Pircher A, Gastl G, Wolf AM. Treg(s) in Cancer: friends or Foe? J Cell Physiol. 2015; 230:2598–605. https://doi.org/10.1002/jcp.25016 [PubMed]
- 23. Zou W. Regulatory T cells, tumour immunity and immunotherapy. Nat Rev Immunol. 2006; 6:295–307. https://doi.org/10.1038/nri1806 [PubMed]
- 24. Hiraoka N, Onozato K, Kosuge T, Hirohashi S. Prevalence of FOXP3+ regulatory T cells increases during the progression of pancreatic ductal adenocarcinoma and its premalignant lesions. Clin Cancer Res. 2006; 12:5423–34. https://doi.org/10.1158/1078-0432.CCR-06-0369 [PubMed]
- 25. Ino Y, Yamazaki-Itoh R, Shimada K, Iwasaki M, Kosuge T, Kanai Y, Hiraoka N. Immune cell infiltration as an indicator of the immune microenvironment of pancreatic cancer. Br J Cancer. 2013; 108:914–23. https://doi.org/10.1038/bjc.2013.32 [PubMed]
- 26. Tang Y, Xu X, Guo S, Zhang C, Tang Y, Tian Y, Ni B, Lu B, Wang H. An increased abundance of tumor-infiltrating regulatory T cells is correlated with the progression and prognosis of pancreatic ductal adenocarcinoma. PLoS One. 2014; 9:e91551. https://doi.org/10.1371/journal.pone.0091551 [PubMed]
- 27. Ene-Obong A, Clear AJ, Watt J, Wang J, Fatah R, Riches JC, Marshall JF, Chin-Aleong J, Chelala C, Gribben JG, Ramsay AG, Kocher HM. Activated pancreatic stellate cells sequester CD8+ T cells to reduce their infiltration of the juxtatumoral compartment of pancreatic ductal adenocarcinoma. Gastroenterology. 2013; 145:1121–32. https://doi.org/10.1053/j.gastro.2013.07.025 [PubMed]
- 28. Liu C, Sun B, Hu X, Zhang Y, Wang Q, Yue J, Yu J. Stereotactic Ablative Radiation Therapy for Pulmonary Recurrence-Based Oligometastatic Non-Small Cell Lung Cancer: Survival and Prognostic Value of Regulatory T Cells. Int J Radiat Oncol Biol Phys. 2019; 105:1055–1064. https://doi.org/10.1016/j.ijrobp.2019.08.012 [PubMed]
- 29. Eckert F, Schaedle P, Zips D, Schmid-Horch B, Rammensee HG, Gani C, Gouttefangeas C. Impact of curative radiotherapy on the immune status of patients with localized prostate cancer. Oncoimmunology. 2018; 7:e1496881. https://doi.org/10.1080/2162402X.2018.1496881 [PubMed]
- 30. Muroyama Y, Nirschl TR, Kochel CM, Lopez-Bujanda Z, Theodros D, Mao W, Carrera-Haro MA, Ghasemzadeh A, Marciscano AE, Velarde E, Tam AJ, Thoburn CJ, Uddin M, et al. Stereotactic Radiotherapy Increases Functionally Suppressive Regulatory T Cells in the Tumor Microenvironment. Cancer Immunol Res. 2017; 5:992–1004. https://doi.org/10.1158/2326-6066.CIR-17-0040 [PubMed]
- 31. Price JG, Idoyaga J, Salmon H, Hogstad B, Bigarella CL, Ghaffari S, Leboeuf M, Merad M. CDKN1A regulates Langerhans cell survival and promotes Treg cell generation upon exposure to ionizing irradiation. Nat Immunol. 2015; 16:1060–68. https://doi.org/10.1038/ni.3270 [PubMed]
- 32. Schuler PJ, Harasymczuk M, Schilling B, Saze Z, Strauss L, Lang S, Johnson JT, Whiteside TL. Effects of adjuvant chemoradiotherapy on the frequency and function of regulatory T cells in patients with head and neck cancer. Clin Cancer Res. 2013; 19:6585–96. https://doi.org/10.1158/1078-0432.CCR-13-0900 [PubMed]
- 33. Liu S, Sun X, Luo J, Zhu H, Yang X, Guo Q, Song Y, Sun X. Effects of radiation on T regulatory cells in normal states and cancer: mechanisms and clinical implications. Am J Cancer Res. 2015; 5:3276–85. [PubMed]
- 34. Schumacher TN, Kesmir C, van Buuren MM. Biomarkers in cancer immunotherapy. Cancer Cell. 2015; 27:12–14. https://doi.org/10.1016/j.ccell.2014.12.004 [PubMed]
- 35. Snyder A, Makarov V, Merghoub T, Yuan J, Zaretsky JM, Desrichard A, Walsh LA, Postow MA, Wong P, Ho TS, Hollmann TJ, Bruggeman C, Kannan K, et al. Genetic basis for clinical response to CTLA-4 blockade in melanoma. N Engl J Med. 2014; 371:2189–99. https://doi.org/10.1056/NEJMoa1406498 [PubMed]
- 36. Champiat S, Ferté C, Lebel-Binay S, Eggermont A, Soria JC. Exomics and immunogenics: bridging mutational load and immune checkpoints efficacy. Oncoimmunology. 2014; 3:e27817. https://doi.org/10.4161/onci.27817 [PubMed]
- 37. Innocenti F, Ou FS, Qu X, Zemla TJ, Niedzwiecki D, Tam R, Mahajan S, Goldberg RM, Bertagnolli MM, Blanke CD, Sanoff H, Atkins J, Polite B, et al. Mutational Analysis of Patients With Colorectal Cancer in CALGB/SWOG 80405 Identifies New Roles of Microsatellite Instability and Tumor Mutational Burden for Patient Outcome. J Clin Oncol. 2019; 37:1217–27. https://doi.org/10.1200/JCO.18.01798 [PubMed]
- 38. Wang X, Li M. Correlate tumor mutation burden with immune signatures in human cancers. BMC Immunol. 2019; 20:4. https://doi.org/10.1186/s12865-018-0285-5 [PubMed]
- 39. Jiang Z, Liu Z, Li M, Chen C, Wang X. Immunogenomics Analysis Reveals that TP53 Mutations Inhibit Tumor Immunity in Gastric Cancer. Transl Oncol. 2018; 11:1171–87. https://doi.org/10.1016/j.tranon.2018.07.012 [PubMed]