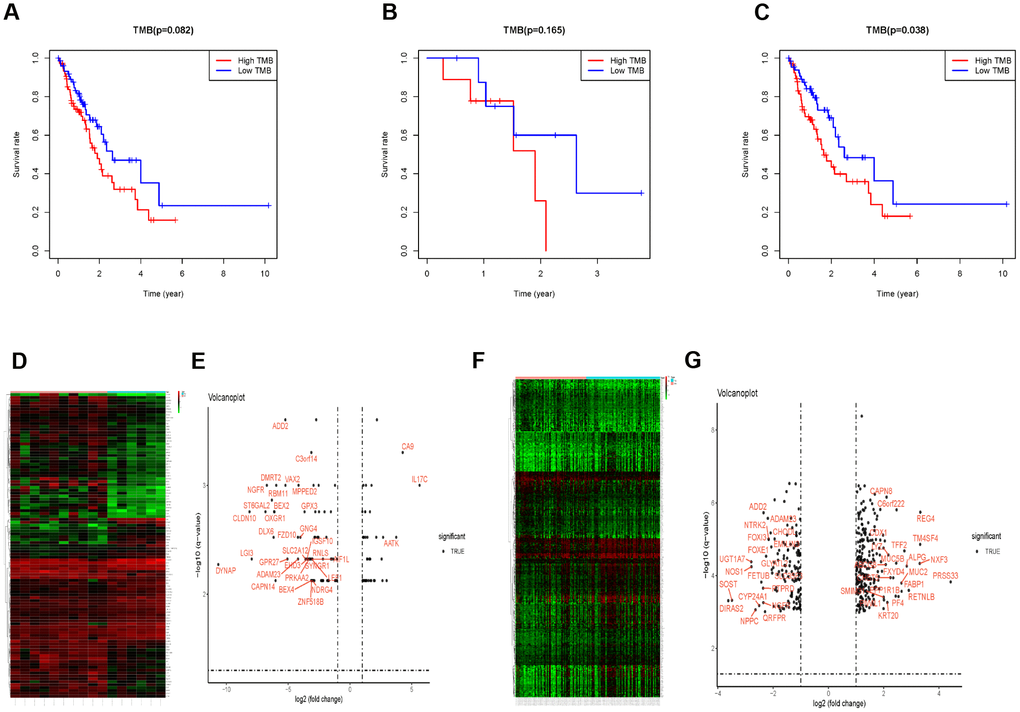
Figure 4.The subgroup analysis in patients receiving radiotherapy or not. (A) Survival analysis to explore the OS of EC patients between the TMB-H and TMB-L group. (B) OS between the TMB-H and TMB-L group of patients receiving radiotherapy. (C) OS of the TMB-H group decreased significantly in EC patients with radiotherapy. (D–G) The different gene expression between the TMB-H and TMB-L groups in EC patients receiving radiotherapy or not.