


Introduction
White matter lesions (WMLs), also called white matter hyperintensities (WMH), refer to hyperintense signals on T2-weighted or fluid-attenuated inverse recovery (FLAIR) images. These are largely thought to be due to cerebral small vessel disease and are widely prevalent among elderly individuals [1]. Histopathologically, WMLs may reflect demyelination, axon loss, or gliosis of brain white matter [2, 3], and they are associated with an increased risk of vascular cognitive impairment and dementia [4]. Neuroimaging studies have provided strong evidence that WMLs may be a useful surrogate biomarker predictive of cognitive decline and progression to dementia [5]. Consistent with that idea, it has been estimated WMLs contribute to nearly half of dementias worldwide, though the mechanism remains unknown [6–8].
WMLs are often accompanied by impairments in executive function, processing speed, attention, and memory [9, 10], and the volume of WMLs is associated with cognitive decline in older adults independent of brain atrophy [11, 12]. Not surprisingly, resent work indicates that the cognitive impairment reflects not only the volume of WMLs but also their location. For example, declines in complex processing speed correlates mainly with anterior WML progression, while declines in visual-construction functions tend to correlate of posterior WML progression [13]. In addition, increased WML volume in the parietal lobes associates with an increased risk of incident dementia [14]. Still, the relationship between the anatomical location of WMLs and cognitive decline is poorly understood. Consequently, there is a need to better understand the mechanisms underlying the cognitive impairment associated with vascular risk factors and WMLs, and to improve diagnoses and interventions into vascular cognitive impairment and dementia in older subjects [15].
Over the last decades, rapid improvements in medical imaging and machine learning technology and greater availability of neuroimaging datasets have provided opportunities for automatic detection and early prediction of cognitive decline [16, 17]. In the present study, we investigated the association between spatial maps of WMLs and multidomain cognitive performance in elderly adults, using MRI (structural MRI and diffusion tensor imaging/DTI) and various neuropsychological assessments of cognition (nonimpaired, mild cognitive impairment/MCI and dementia) with participants in the Open Access Series of Imaging Studies-3 (OASIS-3) [18]. We also explored whether it is possible to predict individual differences in cognitive function using the spatial probability maps of WMLs.
Results
Behavioral performance and WML burden
A total of 263 elderly subjects (aged 62-80 years), including 122 (46.39%) women, participated in this study. The demographic and neuropsychological features of the participants are summarized in Table 1. Among them, 207 subjects (78.71%) were cognitively normal; that is, their scores on the mini-mental state examination (MMSE) were within the normal range and their clinical dementia rating scores (CDRs) were equal to zero. The remaining 56 subjects (21.29%) were diagnosed with MCI or Alzheimer’s dementia. The volumes of white matter lesions extracted using the brain intensity abnormality classification algorithm (BIANCA) ranged from 1.21 ml to 41.63 ml (mean: 7.89 ml). Lesion maps of WMLs segmented by BIANCA overlapped well with the manually segmented lesion mask. Statistical results revealed that WML volume was significantly related to age (Pearson’s correlation coefficient r=0.318, p<0.001). Poor neuropsychological performance was associated with both age and lesion volume. With increasing age and WML volume, cognitive performance tended to decline. In addition, the correlation between cognition and WML volume was more significant than the correlation between cognition and age.
Table 1. Subject demographics and neuropsychological performance (from the OASIS3 dataset).
| Subjects (N=263) | Correlation with age | Correlation with WMLs | |||||||||||||||||||||||||||||||||||||||||||||||||||||||||||||||||||||||||||||||||||||||||||||||||
| Demographics | |||||||||||||||||||||||||||||||||||||||||||||||||||||||||||||||||||||||||||||||||||||||||||||||||||
| Age | 72.78±4.23 | - | 0.318** | ||||||||||||||||||||||||||||||||||||||||||||||||||||||||||||||||||||||||||||||||||||||||||||||||
| Gender (F/M) | 122/141 | - | - | ||||||||||||||||||||||||||||||||||||||||||||||||||||||||||||||||||||||||||||||||||||||||||||||||
| Education | 14.89±1.20 | - | - | ||||||||||||||||||||||||||||||||||||||||||||||||||||||||||||||||||||||||||||||||||||||||||||||||
| APOE ε4 status (n%) | 109 (41.44) | - | - | ||||||||||||||||||||||||||||||||||||||||||||||||||||||||||||||||||||||||||||||||||||||||||||||||
| WMLs volume (mL) | 7.89±6.16 | 0.318** | - | ||||||||||||||||||||||||||||||||||||||||||||||||||||||||||||||||||||||||||||||||||||||||||||||||
| Level of independence (n%) | Level 1 | 249 (94.68) | - | - | |||||||||||||||||||||||||||||||||||||||||||||||||||||||||||||||||||||||||||||||||||||||||||||||
| Level 2 | 9 (3.42) | - | - | ||||||||||||||||||||||||||||||||||||||||||||||||||||||||||||||||||||||||||||||||||||||||||||||||
| Level 3 | 5 (1.90) | - | - | ||||||||||||||||||||||||||||||||||||||||||||||||||||||||||||||||||||||||||||||||||||||||||||||||
| Neuropsychological tests | |||||||||||||||||||||||||||||||||||||||||||||||||||||||||||||||||||||||||||||||||||||||||||||||||||
| CDR | 0.10±0.37 | - | - | ||||||||||||||||||||||||||||||||||||||||||||||||||||||||||||||||||||||||||||||||||||||||||||||||
| MMSE | 28.36±2.58 | -0.062 | -0.102 | ||||||||||||||||||||||||||||||||||||||||||||||||||||||||||||||||||||||||||||||||||||||||||||||||
| LOGIMEM | 13.86±4.38 | 0.041 | -0.195** | ||||||||||||||||||||||||||||||||||||||||||||||||||||||||||||||||||||||||||||||||||||||||||||||||
| DIGIF | 8.48±2.00 | -0.035 | -0.104 | ||||||||||||||||||||||||||||||||||||||||||||||||||||||||||||||||||||||||||||||||||||||||||||||||
| DIGIFLEN | 6.70±1.11 | -0.023 | -0.074 | ||||||||||||||||||||||||||||||||||||||||||||||||||||||||||||||||||||||||||||||||||||||||||||||||
| DIGIB | 6.55±2.25 | -0.034 | -0.107 | ||||||||||||||||||||||||||||||||||||||||||||||||||||||||||||||||||||||||||||||||||||||||||||||||
| DIGIBLEN | 4.78±1.29 | 0.018 | -0.083 | ||||||||||||||||||||||||||||||||||||||||||||||||||||||||||||||||||||||||||||||||||||||||||||||||
| MEMUNITS | 12.69±4.88 | 0.022 | -0.195** | ||||||||||||||||||||||||||||||||||||||||||||||||||||||||||||||||||||||||||||||||||||||||||||||||
| MEMTIME | 14.69±4.88 | 0.056** | 0.033 | ||||||||||||||||||||||||||||||||||||||||||||||||||||||||||||||||||||||||||||||||||||||||||||||||
| ANIMALS | 20.59±6.16 | -0.175** | -0.192** | ||||||||||||||||||||||||||||||||||||||||||||||||||||||||||||||||||||||||||||||||||||||||||||||||
| VEG | 14.10±4.34 | -0.138* | -0.168** | ||||||||||||||||||||||||||||||||||||||||||||||||||||||||||||||||||||||||||||||||||||||||||||||||
| TRAILA | 32.44±11.77 | 0.043 | 0.166** | ||||||||||||||||||||||||||||||||||||||||||||||||||||||||||||||||||||||||||||||||||||||||||||||||
| TRAILB | 88.03±49.69 | 0.124* | 0.069 | ||||||||||||||||||||||||||||||||||||||||||||||||||||||||||||||||||||||||||||||||||||||||||||||||
| TRALIB-A | 55.59±43.85 | 0.128* | 0.034 | ||||||||||||||||||||||||||||||||||||||||||||||||||||||||||||||||||||||||||||||||||||||||||||||||
| WAIS | 53.49±11.62 | -0.129* | -0.285** | ||||||||||||||||||||||||||||||||||||||||||||||||||||||||||||||||||||||||||||||||||||||||||||||||
| BOSTON | 27.38±3.16 | -0.075 | -0.063 | ||||||||||||||||||||||||||||||||||||||||||||||||||||||||||||||||||||||||||||||||||||||||||||||||
| APOE= apolipoprotein E. Level of independence: 1 = Able to live independently, 2 = Requires some assistance with complex activities, 3 = Requires some assistance with basic activities. MMSE= mini-mental state examination; LOGIMEM=logical memory; DIGIF= digit span forward; DIGIFLEN= digit span forward length; DIGIFB= digit span backward; DIGIFBLEN= digit span backward length; VEG=vegetables; TRAILA=trail making A; TRAILB=trail making B; TRAIL B-A=TRAILB-TRAILA; WAIS= Wechsler Adult Intelligence Scale; BOSTON=Boston naming test. Pearson’s correlations, controlled for gender and education, were used to assess how cognitive performance related to age and volume of WMLs (White matter lesions). *p < 0.05, ** p < 0.01. | |||||||||||||||||||||||||||||||||||||||||||||||||||||||||||||||||||||||||||||||||||||||||||||||||||
Spatial maps of WMLs were predictive of cognitive performance
The results of predictions with voxel-level features derived from probability maps of WMLs are reported in Table 2. In 8 of the 15 neuropsychological testing scores, the predicted scores correlated highly with the actual scores (p<0.05). The predicted and actual scores from the MMSE showed the most significant correlations. The RVR model achieved a correlation coefficient (CORR) of 0.28 (p=0.003) and a normalized mean square error (norm MSE) of 0.38 (p=0.007). In addition, the predicted Category Fluency scores of ANIMALS and VEG also strongly correlated with the observed scores (ANIMALS: CORR=0.26, norm MSE=1.2, p<0.05; VEG: COOR=0.26, norm MSE= 0.61, p<0.05). The corresponding scatter plots illustrated in Figure 1 show the predicated clinical scores from the RVR model plotted against the observed scores.
Table 2. RVR model predictions of cognitive functions based on WMLs segmented using BIANCA.
| Neuropsychological tests | CORR | p | MSE | p | Norm MSE | p |
| MMSE | 0.28 | 0.003 | 8.05 | 0.007 | 0.38 | 0.007 |
| ANIMALS | 0.26 | 0.001 | 38.34 | 0.003 | 1.20 | 0.003 |
| VEG | 0.26 | 0.001 | 18.54 | 0.001 | 0.64 | 0.001 |
| LOGIMEM | 0.25 | 0.001 | 19.15 | 0.001 | 0.80 | 0.001 |
| WAIS | 0.25 | 0.001 | 135.42 | 0.006 | 1.81 | 0.006 |
| TRAILB | 0.20 | 0.002 | 2540.06 | 0.015 | 9.48 | 0.015 |
| TRALIB-A | 0.18 | 0.003 | 2016.58 | 0.030 | 7.52 | 0.030 |
| MEMUNITS | 0.17 | 0.003 | 24.94 | 0.040 | 1.08 | 0.040 |
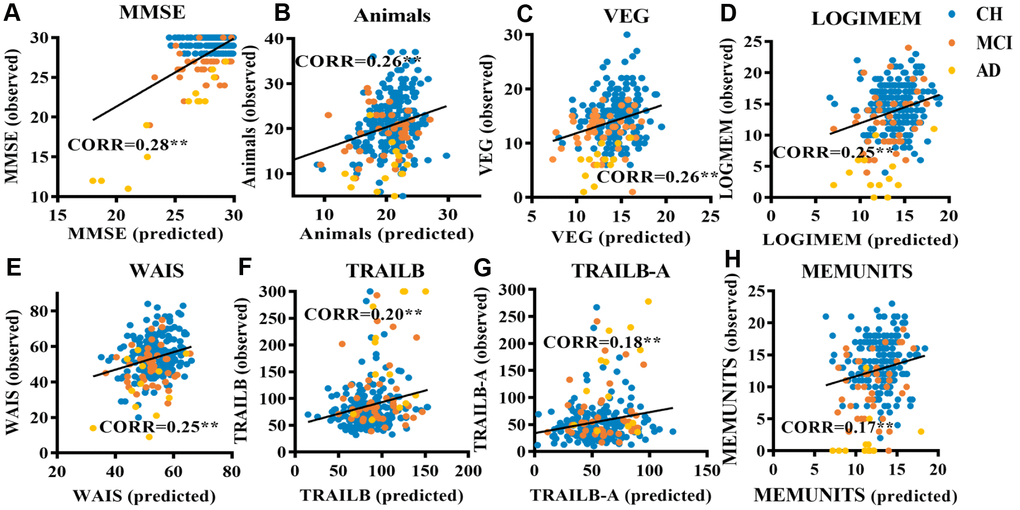
Figure 1. Scatter plots relating cognitive performance predicted using a RVR model based on lesion probability maps of WMLs to observed performance in elderly individuals. (A) RVR-MMSE; (B) RVR-ANIMALS; (C) RVR-VEG; (D) RVR-LOGIMEM; (E) RVR-WAIS; (F) RVR-TRAILB; (G) RVR-TRAIL B-A; (H) RVR-MEMUNITS. Scores of participants with cognitive impairment: participants with mild cognitive impairment (MCI) are colored orange, those clinically diagnosed with Alzheimer’s dementia (AD) are colored yellow. Cognitively healthy participants with WMLs are colored blue.
Weights in the RVR model and the association between diffusion metrics in the corresponding regions and cognition
The top five regions contributing most to the RVR model for prediction of different measures of cognitive function are listed in Table 3 along with their weights, which are arranged from largest to smallest. The distributions of model weights were similar. White matter regions with large contributions to the RVR model mainly included the bilateral tapetum, posterior corona radiation, posterior thalamic radiation, and anterior limb of the internal capsule. Voxel-level weight maps of the RVR model predicting scores in ANIMALS is presented in Figure 2, where only voxels overlapping the JHU white-matter atlas are displayed. Overall, when compared to the anterior WMLs located in the frontal lobe, posterior WMLs located in the parietal and occipital lobes tended to have higher weights in the RVR model predicting cognition in the elderly subjects. The top five white matter regions with the highest weights in the prediction of cognitive performance are shown in Figure 3.
Table 3. Top five most relevant regions for prediction of cognitive performance based on the JHU white-matter atlas.
| Neuropsychological test | Hemisphere | Region description | Contribution (%) | ER | |||||||||||||||||||||||||||||||||||||||||||||||||||||||||||||||||||||||||||||||||||||||||||||||
| MMSE | R | Tapetum | 14.949 | 0.857 | |||||||||||||||||||||||||||||||||||||||||||||||||||||||||||||||||||||||||||||||||||||||||||||||
| L | Tapetum | 10.453 | 1.714 | ||||||||||||||||||||||||||||||||||||||||||||||||||||||||||||||||||||||||||||||||||||||||||||||||
| R | Posterior corona radiata | 8.747 | 2.571 | ||||||||||||||||||||||||||||||||||||||||||||||||||||||||||||||||||||||||||||||||||||||||||||||||
| R | Posterior thalamic radiation (include optic radiation) | 7.837 | 4.143 | ||||||||||||||||||||||||||||||||||||||||||||||||||||||||||||||||||||||||||||||||||||||||||||||||
| L | Posterior corona radiata | 7.577 | 3.714 | ||||||||||||||||||||||||||||||||||||||||||||||||||||||||||||||||||||||||||||||||||||||||||||||||
| ANIMALS | R | Tapetum | 13.042 | 0.857 | |||||||||||||||||||||||||||||||||||||||||||||||||||||||||||||||||||||||||||||||||||||||||||||||
| L | Tapetum | 11.389 | 1.857 | ||||||||||||||||||||||||||||||||||||||||||||||||||||||||||||||||||||||||||||||||||||||||||||||||
| R | Posterior corona radiata | 9.290 | 2.429 | ||||||||||||||||||||||||||||||||||||||||||||||||||||||||||||||||||||||||||||||||||||||||||||||||
| L | Posterior thalamic radiation (include optic radiation) | 7.933 | 3.571 | ||||||||||||||||||||||||||||||||||||||||||||||||||||||||||||||||||||||||||||||||||||||||||||||||
| R | Posterior thalamic radiation | 6.366 | 4.429 | ||||||||||||||||||||||||||||||||||||||||||||||||||||||||||||||||||||||||||||||||||||||||||||||||
| VEG | R | Tapetum | 19.474 | 0.857 | |||||||||||||||||||||||||||||||||||||||||||||||||||||||||||||||||||||||||||||||||||||||||||||||
| L | Tapetum | 9.938 | 1.714 | ||||||||||||||||||||||||||||||||||||||||||||||||||||||||||||||||||||||||||||||||||||||||||||||||
| L | Posterior thalamic radiation | 7.496 | 3.714 | ||||||||||||||||||||||||||||||||||||||||||||||||||||||||||||||||||||||||||||||||||||||||||||||||
| R | Posterior corona radiata | 7.158 | 3.143 | ||||||||||||||||||||||||||||||||||||||||||||||||||||||||||||||||||||||||||||||||||||||||||||||||
| L | Superior fronto-occipital fasciculus (could be a part of anterior internal capsule) | 6.383 | 4.571 | ||||||||||||||||||||||||||||||||||||||||||||||||||||||||||||||||||||||||||||||||||||||||||||||||
| LOGIMEM | R | Tapetum | 13.760 | 0.857 | |||||||||||||||||||||||||||||||||||||||||||||||||||||||||||||||||||||||||||||||||||||||||||||||
| L | Tapetum | 10.637 | 1.714 | ||||||||||||||||||||||||||||||||||||||||||||||||||||||||||||||||||||||||||||||||||||||||||||||||
| R | Posterior corona radiata | 8.071 | 2.714 | ||||||||||||||||||||||||||||||||||||||||||||||||||||||||||||||||||||||||||||||||||||||||||||||||
| L | Posterior corona radiata | 7.703 | 3.286 | ||||||||||||||||||||||||||||||||||||||||||||||||||||||||||||||||||||||||||||||||||||||||||||||||
| L | Superior fronto-occipital fasciculus | 6.496 | 4.857 | ||||||||||||||||||||||||||||||||||||||||||||||||||||||||||||||||||||||||||||||||||||||||||||||||
| WAIS | R | Tapetum | 13.155 | 1.000 | |||||||||||||||||||||||||||||||||||||||||||||||||||||||||||||||||||||||||||||||||||||||||||||||
| L | Tapetum | 9.753 | 1.857 | ||||||||||||||||||||||||||||||||||||||||||||||||||||||||||||||||||||||||||||||||||||||||||||||||
| R | Posterior corona radiata | 7.332 | 3.143 | ||||||||||||||||||||||||||||||||||||||||||||||||||||||||||||||||||||||||||||||||||||||||||||||||
| R | Posterior thalamic radiation | 6.955 | 4.143 | ||||||||||||||||||||||||||||||||||||||||||||||||||||||||||||||||||||||||||||||||||||||||||||||||
| L | Posterior corona radiata | 6.493 | 4.000 | ||||||||||||||||||||||||||||||||||||||||||||||||||||||||||||||||||||||||||||||||||||||||||||||||
| TRAILB | R | Tapetum | 14.602 | 0.857 | |||||||||||||||||||||||||||||||||||||||||||||||||||||||||||||||||||||||||||||||||||||||||||||||
| L | Tapetum | 12.290 | 1.714 | ||||||||||||||||||||||||||||||||||||||||||||||||||||||||||||||||||||||||||||||||||||||||||||||||
| L | Posterior corona radiata | 7.631 | 2.857 | ||||||||||||||||||||||||||||||||||||||||||||||||||||||||||||||||||||||||||||||||||||||||||||||||
| R | Posterior thalamic radiation | 7.051 | 3.571 | ||||||||||||||||||||||||||||||||||||||||||||||||||||||||||||||||||||||||||||||||||||||||||||||||
| L | Superior fronto-occipital fasciculus | 6.096 | 4.571 | ||||||||||||||||||||||||||||||||||||||||||||||||||||||||||||||||||||||||||||||||||||||||||||||||
| TRAIL B-A | R | Tapetum | 15.360 | 0.857 | |||||||||||||||||||||||||||||||||||||||||||||||||||||||||||||||||||||||||||||||||||||||||||||||
| L | Tapetum | 12.307 | 1.714 | ||||||||||||||||||||||||||||||||||||||||||||||||||||||||||||||||||||||||||||||||||||||||||||||||
| L | Posterior thalamic radiation | 7.545 | 3.000 | ||||||||||||||||||||||||||||||||||||||||||||||||||||||||||||||||||||||||||||||||||||||||||||||||
| R | Posterior thalamic radiation | 7.252 | 3.286 | ||||||||||||||||||||||||||||||||||||||||||||||||||||||||||||||||||||||||||||||||||||||||||||||||
| R | Posterior corona radiata | 6.083 | 4.286 | ||||||||||||||||||||||||||||||||||||||||||||||||||||||||||||||||||||||||||||||||||||||||||||||||
| MEMUNITS | R | Tapetum | 13.135 | 0.857 | |||||||||||||||||||||||||||||||||||||||||||||||||||||||||||||||||||||||||||||||||||||||||||||||
| L | Tapetum | 10.157 | 1.714 | ||||||||||||||||||||||||||||||||||||||||||||||||||||||||||||||||||||||||||||||||||||||||||||||||
| R | Posterior corona radiata | 8.934 | 2.571 | ||||||||||||||||||||||||||||||||||||||||||||||||||||||||||||||||||||||||||||||||||||||||||||||||
| L | Posterior thalamic radiation | 7.518 | 3.714 | ||||||||||||||||||||||||||||||||||||||||||||||||||||||||||||||||||||||||||||||||||||||||||||||||
| R | Posterior thalamic radiation | 6.813 | 4.429 | ||||||||||||||||||||||||||||||||||||||||||||||||||||||||||||||||||||||||||||||||||||||||||||||||
| ER=Expected ranking. The region of the posterior thalamic radiation, including the optic radiation and the superior fronto-occipital fasciculus, could be part of the anterior internal capsule. | |||||||||||||||||||||||||||||||||||||||||||||||||||||||||||||||||||||||||||||||||||||||||||||||||||
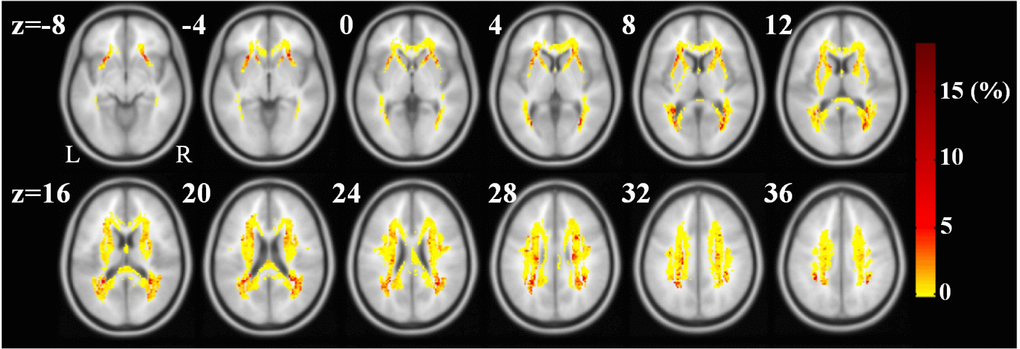
Figure 2. Weight maps in the RVR-ANIMALS model. Only voxels with positive weights and overlapping with JHU white-matter atlas are presented. The redder the color, the larger the weight of the voxel.
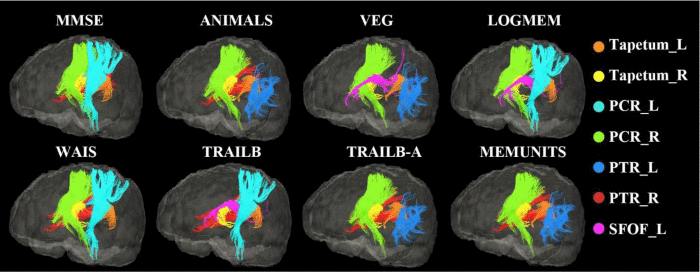
Figure 3. White matter fiber tracts in which WMLs made a higher contribution to the prediction of cognitive performances than lesions located in other brain areas. For each test, only the top 5 white matter tracts are displayed.
Table 4 summarizes the results of a multivariate linear regression analysis of the relation between eight cognitive test scores and the mean values of the diffusion metrics in the top five white matter regions with the maximum weights in the RVR model. For the cognitive test ANIMALS, four different types of diffusion indexes in the top five weight regions were all significantly related to the observed scores (fractional anisotropy /FA: F=4.760, p=0.001; mean diffusivity/MD: F=5.135, p=0.0003; axial diffusivity/AD: F=4.538, p=0.001; radial diffusivity/RD: F=5.049, p=0.0003). With the exception of the scores in the TRAIL B-A test, AD and RD correlated linearly with all the other seven items in the cognitive tests, which were predicted with the RVR model. The FA in the top five white matter regions was significantly related only to the scores of MMSE and ANIMALS tests.
Table 4. Results of multivariate linear regression relating cognitive performance and diffusion metrics.
| Cognitive tests | F | |||
| FA | MD | AD | RD | |
| MMSE | 2.594* | 4.106** | 3.578** | 4.275** |
| ANIMALS | 4.760** | 5.135** | 4.538** | 5.049** |
| VEG | 1.280 | 5.572** | 6.246** | 5.069** |
| LOGMEM | 0.444 | 2.925* | 3.232** | 2.770* |
| WAIS | 2.273 | 2.904* | 2.543* | 2.962* |
| TRAILB | 1.677 | 2.273 | 2.638* | 2.931* |
| TRAIL B-A | 1.929 | 1.833 | 1.630 | 1.938 |
| MEMUNITS | 0.587 | 1.929 | 3.824** | 2.710* |
Discussion
In the present study of 263 elderly individuals, we detected significant associations between increasing WML burden and declines across multiple cognitive functions. Using a multivariate modelling approach, we were able to predict multidomain cognitive performance in elders based on spatial probability maps of WMLs. We therefore suggest that variation in WMLs (extent and location) contributes to differences in cognitive dysfunctions in different domains.
Poor neuropsychological performance was significantly associated with larger WML volumes in elderly participants, which is generally in agreement with earlier studies [19]. Lesion volume correlated positively with increasing age and correlated negatively with cognitive function, especially language intelligence and memory. This association between WML burden and cognition was consistently found in both normally aging individuals and those with cognitive impairment, such as MCI and Alzheimer’s dementia [20–22]. Like medial temporal atrophy, apolipoprotein E (APOE) ε4 allele genotype, and β-amyloid burden, WML burden is a potentially useful surrogate biomarker with which to monitor cognitive performance and assess cognitive decline [23, 24]. Results from several studies support the hypothesis that this correlation between WMLs, especially periventricular lesions, and impaired cognition reflects a cholinergic deficiency [25–27].
A number of studies have focused on early prediction of cognitive impairment – i.e., the conversion from healthy cognition to MCI or from MCI to dementia. By combining large sample MRI data and machine learning models, several studies have achieved fairly high predictive accuracy [28–30]. Here, using a nonlinear multivariate regression model, RVR, we demonstrated that spatial probability maps of WMLs are predictive of multidomain cognitive performance by elderly individuals in tests of memory, language, intelligence, and executive functions (Table 2). Although recent evidence suggests the WML distribution may be a predictor of cognitive impairment, those results were controversial [31]. Some investigators were unable to detect an association between overall WML volume and a higher risk of dementia, but did find an association between lesions in specific brain regions (e.g., the parietal lobe) and the risk of dementia [14, 32, 33]. Indeed, in elderly individuals, WMLs were predictive of adverse cognitive outcomes reflecting changes in executive functions, memory, language and processing speed, as measured with the MMSE, trail making, Boston naming, and various other neuropsychological tests [34–36]. Our results with the RVR model are consistent with those earlier studies and further confirm that spatial maps of WMLs are predictive of many aspects of cognition in both healthy and cognitively impaired older people at the level of individuals.
Several specific regions, including the bilateral tapetum, posterior corona radiata, and posterior thalamic radiation (include optic radiation), showed strong associations with the prediction of cognitive performance, and these correlations were verified in DTI images. The tapetum is located on either side of the corpus callosum with fibers connecting the posterior corpus callosum and medial temporal lobe and covering the central part of the lateral ventricle. It has been reported that subjects with a family history of Alzheimer’s disease have a lower FA in the left tapetum [37], and that patients with Alzheimer’s disease have a lower FA and higher MD in these white matter regions [38, 39]. These regions were also associated with cognitive flexibility in young and middle-aged adults with dyskinetic cerebral palsy, a disease resulted from damage to the basal ganglia [40]. In addition, the bilateral posterior thalamic radiations, posterior corona radiata, and thalamocortical and corticocortical connections, which widely connect among the thalamus, parietal and occipital lobes, also appear to contribute greatly in the prediction of cognitive performance. This result is consistent with the significant association between thalamic pathology and memory loss in early Alzheimer’s disease, especially episodic memory, which is one of the earliest cognitive deficits in dementia [41, 42]. When predicting performance in neuropsychological tests, including the Wechsler Memory Scale-Revised, Category Fluency, and Trail Making Test (score: VEG, LOGIMEM and TRAILB), the superior fronto-occipital fasciculus, an association fiber tract connecting the frontal, occipital, parietal and temporal lobes, also exhibited high weight [43]. The superior fronto-occipital fasciculus is the only association fiber tract that projects medially to the thalamus and along the ventricle, and it is widely recognized to be an important connection between the insula and the parieto-frontal circuit, which are involved in crucial cerebral functions such as memory, language, emotion, and behavior [44].
In our results, WMLs located in posterior brain regions showed a slightly closer relation to cognitive impairment than other regions, which is consistent with several studies indicating that parietal and occipital lobes were the regions where WMLs preferentially occurred [45–49].
There are several limitations to the present study. A larger sample of participants will be needed verify the generalizability of our findings, especially the longitudinal data, which will be key to determining the predictive ability of WMLs for cognitive outcomes in elders. In addition, other modalities of neuroimaging, such as functional MRI (resting state and task driven) and positron emission tomography (PET), should also be examined. In future studies, combining WMLs with the other risk factors for cognitive decline in the elderly could further improve the predictive performance of our model and shed new light on the mechanism underlying WMLs in aging.
Conclusions
In sum, both the volume and spatial distribution of WMLs are significantly associated with neuropsychological performance in elderly participants from a general population cohort. Multidomain cognitive performance could be predicted with the information on the intensity and spatial probability maps of WMLs. This may provide a basis from which to investigate the mechanisms underlying cognitive decline in aging, and help clinicians to identify elderly individuals at higher potential risk of early cognitive impairment.
Materials and Methods
Participants
The participants in the current study are a cohort of elderly individuals from an ongoing project, known as the OASIS-3 study, which is an ongoing longitudinal neuroimaging, clinical, cognitive, and biomarker dataset for normal aging and Alzheimer’s Disease [18]. This dataset consists of >1000 participants aged 18-96, including cognitively normal adults and individuals at various stages of cognitive decline. A total of 263 subjects ranging in age from 55 to 80 years were included in the present study. These participants are from both genders and are all right-handed. Individuals with major psychiatric disorders or disease that could affect cognitive abilities were excluded. All participants completed a battery of neuropsychological test at the Alzheimer Disease Research Center (ADRC). These included the MMSE, Wechsler Memory Scale-Revised, Category Fluency, Boston Naming, Trail Making, Digit Span and Wechsler Adult Intelligence Scale-Revised [50]. A total of fifteen neuropsychological scores were included in this study. The participants’ clinical information, including education, APOE ε4 allele genotype, and level of independence were also included. Combined with the CDR scale and clinical dementia diagnoses collected in accordance with National Alzheimer’s Coordinating Center Uniform Data Set (UDS), 43 of the 263 available subjects had been diagnosed with MCI (CDR=0.5) and 13 were diagnosed with Alzheimer’s dementia (CDR>0.5) [51]. For each participant, T1 weighted (voxel size: 1.2×1.0547×1.0547 mm3) and T2 weighted FLAIR (voxel size: 0.8594×0.8594×5/6 mm3) were obtained. In addition, DTI images (voxel size: 2.5×2.5×2.5mm3, 65 directions, b0=1, b value=1000) were obtained from 124 of the subjects. MRI images were obtained using 3-T Siemens scanners.
MRI imaging process
Identical imaging processing procedures were used for all subjects. The data was preprocessed using Statistical Parametric Mapping 12 (SPM12) (https://www.fil.ion. ucl.ac.uk/spm/software/spm12) running on MATLAB version 2016b, the PANDA toolbox (https://www.nitrc. org/projects/panda/), and the FMRIB software library v6.0 (https://fsl.fmrib.ox.ac.uk/fsl/fslwiki/FSL). Structural brain images as well as T1 and FLAIR images were stripped followed by bias field correction using FSL BET and FAST [52, 53]. FLAIR images were registered to the base modality T1 using linear-registration. The transformation between an individual’s native space and the standard Montreal Neurological Institute space coordinates was calculated as spatial features. After eddy current corrections, brain extraction, DTI index images, including FA, RD, AD, and MD, were calculated and normalized to the MNI standard space for further analysis.
White matter lesions segmentation
We applied the segmentation algorithm BIANCA, a free FSL package, to automatically quantify the WMLs of our participants (https://fsl.fmrib.ox.ac.uk/fsl/fslwiki/BIANCA). BIANCA is a fully automated machine learning-based pipeline for detecting WMLs based on the k-nearest neighbor (KNN) classification algorithm, which offers highly flexible options for setting parameters such as modalities and location of training points [54]. In this study, we used T1 and FLAIR as features. T1 was set as the base space, and the training set consisted of 10 of the 263 subjects’ WML masks marked manually by an experienced neuroradiologist. Other options we used in BIANCA: spatial weighting=1; no patch; location of training points, any location for non-WMLs training points; number of training points, Fixed + unbalanced 2000 lesion points and 10000 non-lesion points. After segmentation, the probability maps of WMLs in T1 native space were extracted and volume of lesions was calculated. The intensity of each voxel was the probability that the voxel belongs to a WML and ranged from 0 to 1. Only voxels whose intensity exceeding 0.9 were retained; the others were set to zero. This threshold for the probability maps was set to obtain the best balance between false positive and false negative for the segmentation of WMLs, and was also suggested to be the optimal threshold for BIANCA [55]. Then lesion maps were spatially normalized to the standard space of 2×2×2 mm3. All registration steps were visually inspected.
Prediction of cognitive performance using relevance vector regression
To investigate whether the spatial probability maps of WMLs were predictive of cognitive performance in elderly individuals, the relevance vector regression (RVR) model was applied. RVR is a sparse kernel method based on a probabilistic Bayesian framework with zero-mean Gaussian priors for the model weights, which are governed by hyperparameters [56, 57]. Specifically, the RVR model took the computed lesion maps of WMLs, excluding voxels locating in the cerebellum, as input vectors and the performances on a given neuropsychological test as targets. The posterior distributions of many of the model weights were sharply peaked at zero estimated with the training data, and the non-zero weights were “relevance vectors,” which were then used as the weighted relevance vectors to predict the target. The reliability of the WML-based predictive RVR model was measured using a 7-cross validation approach.
The RVR model provided a prediction of the clinical scores in a given test based on WML probability maps. The significance of the prediction performance was assessed using CORR, the MSE, and the norm MSE.
CORR provides a measure of the linear dependence between the targets and predictions; the higher the correlation, the more accurate the prediction. CORR was determined using the following formula:
MSE is a standard measure to assess goodness-of-fit for regression models, and different clinical scores have different scales. The higher the MSE, the less accurate are the predictions. MSE was calculated as:
To minimize the effect of the scale of y on the MSE, we calculated the norm MSE:
yn and f (xn) denote the observed and estimated scores corresponding to the input predictors. xn, μy and μf are the sample means of yn and f (xn), respectively. N is the total number of subjects in the test sample. ymax and ymin are the maximum and minimum y, respectively.
Association between diffusion indexes and the distribution of RVR weights
The model weights represent the contributions of each feature for the RVR predictive model. In this study, the region-level weight maps were respectively calculated based on the JHU white-matter label atlas containing 48 white matter regions in the brain and the weights of voxels in the same brain region averaged to display the decision functions of the predictive models [58]. These regions were ranked in ascending order based on their weights. The expected ranking (ER) of each region is the ranking averaged across folds. Additionally, to examine the association between cognitive functions and the weight distribution of the corresponding RVR prediction model, we first calculated the mean diffusion indexes in top five white matter regions with largest weights in the RVR model, including FA, AD, RD and MD. We then applied multivariate linear regression to assess how each type of diffusion measure in the five white matter regions was related to the corresponding scores in the cognitive performance tests.
Statistics
Partial Pearson’s correlations, controlled for gender and education, were used to assess how cognitive tests related to age and to the volume of WMLs detected by BIANCA. For the machine learning models used, permutation testing was performed to assess the models’ statistical significance. Specifically, each model was retrained 1000 times and P-values for CORR, MSE and norm MSE were calculated. Values of P < 0.05 were considered statistically significant. The overall procedure is shown in Figure 4.
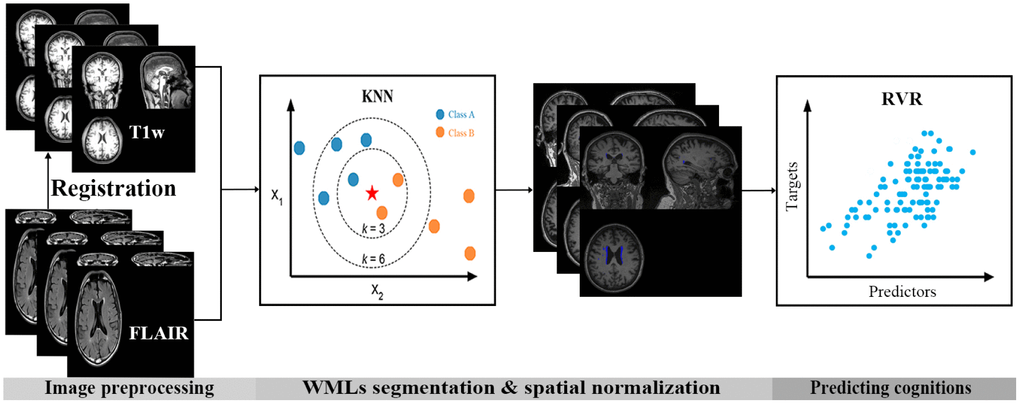
Figure 4. Flow chart for analysis in the present study. First, FLAIR images were registered to the corresponding individual’s T1 space. Then, the k-nearest neighbor (KNN) classification algorithm was used to segment the white matter lesions (WMLs) automatically. Finally, a machine learning model, relevance vector regression (RVR), was used to predict cognitive performance based on the spatial probability maps of the WMLs.
Author Contributions
CZ and YL performed MRI imaging data analysis, implemented the machine learning algorithms and wrote the manuscript. TC, YZ and XL provided help on the preprocess of MRI data. JW and CL performed the visual quality control inspection of MRI imaging data and provided some advice on the analysis with machine learning algorithm. XZ provided the research ideas and revised the manuscript.
Conflicts of Interest
The authors declare that there is no conflicts of interest regarding the publication of this paper.
Funding
This work was supported by grants from the National Natural Science Foundation of China (NSFC: 31600933, 61701323, 81771909), Excellent Talents Programme of Beijing (Grant No. 2016000020124G098) and Ministry of Education, Science and Technology Department Center of China (Grant No. 2018A03004).
References
- 1. Wardlaw JM, Smith C, Dichgans M. Mechanisms of sporadic cerebral small vessel disease: insights from neuroimaging. Lancet Neurol. 2013; 12:483–97. https://doi.org/10.1016/S1474-4422(13)70060-7 [PubMed]
- 2. Schmidt R, Seiler S, Loitfelder M. Longitudinal change of small-vessel disease-related brain abnormalities. J Cereb Blood Flow Metab. 2016; 36:26–39. https://doi.org/10.1038/jcbfm.2015.72 [PubMed]
- 3. Wardlaw JM, Smith C, Dichgans M. Small vessel disease: mechanisms and clinical implications. Lancet Neurol. 2019; 18:684–96. https://doi.org/10.1016/S1474-4422(19)30079-1 [PubMed]
- 4. Rensma SP, van Sloten TT, Launer LJ, Stehouwer CD. Cerebral small vessel disease and risk of incident stroke, dementia and depression, and all-cause mortality: A systematic review and meta-analysis. Neurosci Biobehav Rev. 2018; 90:164–73. https://doi.org/10.1016/j.neubiorev.2018.04.003 [PubMed]
- 5. Dichgans M, Leys D. Vascular Cognitive Impairment. Circ Res. 2017; 120:573–91. https://doi.org/10.1161/CIRCRESAHA.116.308426 [PubMed]
- 6. Kalaria RN. Cerebrovascular disease and mechanisms of cognitive impairment: evidence from clinicopathological studies in humans. Stroke. 2012; 43:2526–34. https://doi.org/10.1161/STROKEAHA.112.655803 [PubMed]
- 7. Bos D, Wolters FJ, Darweesh SK, Vernooij MW, de Wolf F, Ikram MA, Hofman A. Cerebral small vessel disease and the risk of dementia: A systematic review and meta-analysis of population-based evidence. Alzheimers Dement. 2018; 14:1482–92. https://doi.org/10.1016/j.jalz.2018.04.007 [PubMed]
- 8. Hainsworth AH, Minett T, Andoh J, Forster G, Bhide I, Barrick TR, Elderfield K, Jeevahan J, Markus HS, Bridges LR. Neuropathology of White Matter Lesions, Blood-Brain Barrier Dysfunction, and Dementia. Stroke. 2017; 48:2799–804. https://doi.org/10.1161/STROKEAHA.117.018101 [PubMed]
- 9. Sun X, Liang Y, Wang J, Chen K, Chen Y, Zhou X, Jia J, Zhang Z. Early frontal structural and functional changes in mild white matter lesions relevant to cognitive decline. J Alzheimers Dis. 2014; 40:123–34. https://doi.org/10.3233/JAD-131709 [PubMed]
- 10. Passiak BS, Liu D, Kresge HA, Cambronero FE, Pechman KR, Osborn KE, Gifford KA, Hohman TJ, Schrag MS, Davis LT, Jefferson AL. Perivascular spaces contribute to cognition beyond other small vessel disease markers. Neurology. 2019; 92:e1309–21. https://doi.org/10.1212/WNL.0000000000007124 [PubMed]
- 11. Jokinen H, Lipsanen J, Schmidt R, Fazekas F, Gouw AA, van der Flier WM, Barkhof F, Madureira S, Verdelho A, Ferro JM, Wallin A, Pantoni L, Inzitari D, Erkinjuntti T, and LADIS Study Group. Brain atrophy accelerates cognitive decline in cerebral small vessel disease: the LADIS study. Neurology. 2012; 78:1785–92. https://doi.org/10.1212/WNL.0b013e3182583070 [PubMed]
- 12. Legdeur N, Visser PJ, Woodworth DC, Muller M, Fletcher E, Maillard P, Scheltens P, DeCarli C, Kawas CH, Corrada MM. White Matter Hyperintensities and Hippocampal Atrophy in Relation to Cognition: The 90+ Study. J Am Geriatr Soc. 2019; 67:1827–34. https://doi.org/10.1111/jgs.15990 [PubMed]
- 13. Marquine MJ, Attix DK, Goldstein LB, Samsa GP, Payne ME, Chelune GJ, Steffens DC. Differential patterns of cognitive decline in anterior and posterior white matter hyperintensity progression. Stroke. 2010; 41:1946–50. https://doi.org/10.1161/STROKEAHA.110.587717 [PubMed]
- 14. Brickman AM, Provenzano FA, Muraskin J, Manly JJ, Blum S, Apa Z, Stern Y, Brown TR, Luchsinger JA, Mayeux R. Regional white matter hyperintensity volume, not hippocampal atrophy, predicts incident Alzheimer disease in the community. Arch Neurol. 2012; 69:1621–27. https://doi.org/10.1001/archneurol.2012.1527 [PubMed]
- 15. METACOHORTS Consortium. METACOHORTS for the study of vascular disease and its contribution to cognitive decline and neurodegeneration: An initiative of the Joint Programme for Neurodegenerative Disease Research. Alzheimers Dement. 2016; 12:1235–49. https://doi.org/10.1016/j.jalz.2016.06.004 [PubMed]
- 16. Rathore S, Habes M, Iftikhar MA, Shacklett A, Davatzikos C. A review on neuroimaging-based classification studies and associated feature extraction methods for Alzheimer’s disease and its prodromal stages. Neuroimage. 2017; 155:530–48. https://doi.org/10.1016/j.neuroimage.2017.03.057 [PubMed]
- 17. Pellegrini E, Ballerini L, Hernandez MD, Chappell FM, González-Castro V, Anblagan D, Danso S, Muñoz-Maniega S, Job D, Pernet C, Mair G, MacGillivray TJ, Trucco E, Wardlaw JM. Machine learning of neuroimaging for assisted diagnosis of cognitive impairment and dementia: A systematic review. Alzheimers Dement (Amst). 2018; 10:519–35. https://doi.org/10.1016/j.dadm.2018.07.004 [PubMed]
- 18. Marcus DS, Fotenos AF, Csernansky JG, Morris JC, Buckner RL. Open access series of imaging studies: longitudinal MRI data in nondemented and demented older adults. J Cogn Neurosci. 2010; 22:2677–84. https://doi.org/10.1162/jocn.2009.21407 [PubMed]
- 19. Miller KL, Alfaro-Almagro F, Bangerter NK, Thomas DL, Yacoub E, Xu J, Bartsch AJ, Jbabdi S, Sotiropoulos SN, Andersson JL, Griffanti L, Douaud G, Okell TW, et al. Multimodal population brain imaging in the UK Biobank prospective epidemiological study. Nat Neurosci. 2016; 19:1523–36. https://doi.org/10.1038/nn.4393 [PubMed]
- 20. Boyle PA, Yu L, Fleischman DA, Leurgans S, Yang J, Wilson RS, Schneider JA, Arvanitakis Z, Arfanakis K, Bennett DA. White matter hyperintensities, incident mild cognitive impairment, and cognitive decline in old age. Ann Clin Transl Neurol. 2016; 3:791–800. https://doi.org/10.1002/acn3.343 [PubMed]
- 21. Hedden T, Schultz AP, Rieckmann A, Mormino EC, Johnson KA, Sperling RA, Buckner RL. Multiple Brain Markers are Linked to Age-Related Variation in Cognition. Cereb Cortex. 2016; 26:1388–400. https://doi.org/10.1093/cercor/bhu238 [PubMed]
- 22. Kynast J, Lampe L, Luck T, Frisch S, Arelin K, Hoffmann KT, Loeffler M, Riedel-Heller SG, Villringer A, Schroeter ML. White matter hyperintensities associated with small vessel disease impair social cognition beside attention and memory. J Cereb Blood Flow Metab. 2018; 38:996–1009. https://doi.org/10.1177/0271678X17719380 [PubMed]
- 23. Yamanaka T, Uchida Y, Sakurai K, Kato D, Mizuno M, Sato T, Madokoro Y, Kondo Y, Suzuki A, Ueki Y, Ishii F, Borlongan CV, Matsukawa N. Anatomical Links between White Matter Hyperintensity and Medial Temporal Atrophy Reveal Impairment of Executive Functions. Aging Dis. 2019; 10:711–18. https://doi.org/10.14336/AD.2018.0929 [PubMed]
- 24. Tsapanou A, Habeck C, Gazes Y, Razlighi Q, Sakhardande J, Stern Y, Salthouse TA. Brain biomarkers and cognition across adulthood. Hum Brain Mapp. 2019; 40:3832–42. https://doi.org/10.1002/hbm.24634 [PubMed]
- 25. Erkinjuntti T, Kurz A, Gauthier S, Bullock R, Lilienfeld S, Damaraju CV. Efficacy of galantamine in probable vascular dementia and Alzheimer’s disease combined with cerebrovascular disease: a randomised trial. Lancet. 2002; 359:1283–90. https://doi.org/10.1016/S0140-6736(02)08267-3 [PubMed]
- 26. Wang J, Zhang HY, Tang XC. Cholinergic deficiency involved in vascular dementia: possible mechanism and strategy of treatment. Acta Pharmacol Sin. 2009; 30:879–88. https://doi.org/10.1038/aps.2009.82 [PubMed]
- 27. Richter N, Michel A, Onur OA, Kracht L, Dietlein M, Tittgemeyer M, Neumaier B, Fink GR, Kukolja J. White matter lesions and the cholinergic deficit in aging and mild cognitive impairment. Neurobiol Aging. 2017; 53:27–35. https://doi.org/10.1016/j.neurobiolaging.2017.01.012 [PubMed]
- 28. Amoroso N, La Rocca M, Bruno S, Maggipinto T, Monaco A, Bellotti R, Tangaro S. Multiplex Networks for Early Diagnosis of Alzheimer’s Disease. Front Aging Neurosci. 2018; 10:365. https://doi.org/10.3389/fnagi.2018.00365 [PubMed]
- 29. Beaty RE, Kenett YN, Christensen AP, Rosenberg MD, Benedek M, Chen Q, Fink A, Qiu J, Kwapil TR, Kane MJ, Silvia PJ. Robust prediction of individual creative ability from brain functional connectivity. Proc Natl Acad Sci USA. 2018; 115:1087–92. https://doi.org/10.1073/pnas.1713532115 [PubMed]
- 30. Giraldo DL, García-Arteaga JD, Cárdenas-Robledo S, Romero E. Characterization of brain anatomical patterns by comparing region intensity distributions: applications to the description of Alzheimer’s disease. Brain Behav. 2018; 8:e00942. https://doi.org/10.1002/brb3.942 [PubMed]
- 31. Bolandzadeh N, Davis JC, Tam R, Handy TC, Liu-Ambrose T. The association between cognitive function and white matter lesion location in older adults: a systematic review. BMC Neurol. 2012; 12:126. https://doi.org/10.1186/1471-2377-12-126 [PubMed]
- 32. Brickman AM, Zahodne LB, Guzman VA, Narkhede A, Meier IB, Griffith EY, Provenzano FA, Schupf N, Manly JJ, Stern Y, Luchsinger JA, Mayeux R. Reconsidering harbingers of dementia: progression of parietal lobe white matter hyperintensities predicts Alzheimer’s disease incidence. Neurobiol Aging. 2015; 36:27–32. https://doi.org/10.1016/j.neurobiolaging.2014.07.019 [PubMed]
- 33. Damulina A, Pirpamer L, Seiler S, Benke T, Dal-Bianco P, Ransmayr G, Struhal W, Hofer E, Langkammer C, Duering M, Fazekas F, Schmidt R. White Matter Hyperintensities in Alzheimer’s Disease: A Lesion Probability Mapping Study. J Alzheimers Dis. 2019; 68:789–96. https://doi.org/10.3233/JAD-180982 [PubMed]
- 34. Shenkin SD, Bastin ME, Macgillivray TJ, Deary IJ, Starr JM, Rivers CS, Wardlaw JM. Cognitive correlates of cerebral white matter lesions and water diffusion tensor parameters in community-dwelling older people. Cerebrovasc Dis. 2005; 20:310–18. https://doi.org/10.1159/000087930 [PubMed]
- 35. Silbert LC, Nelson C, Howieson DB, Moore MM, Kaye JA. Impact of white matter hyperintensity volume progression on rate of cognitive and motor decline. Neurology. 2008; 71:108–13. https://doi.org/10.1212/01.wnl.0000316799.86917.37 [PubMed]
- 36. Guo T, Duerden EG, Adams E, Chau V, Branson HM, Chakravarty MM, Poskitt KJ, Synnes A, Grunau RE, Miller SP. Quantitative assessment of white matter injury in preterm neonates: association with outcomes. Neurology. 2017; 88:614–22. https://doi.org/10.1212/WNL.0000000000003606 [PubMed]
- 37. Bendlin BB, Ries ML, Canu E, Sodhi A, Lazar M, Alexander AL, Carlsson CM, Sager MA, Asthana S, Johnson SC. White matter is altered with parental family history of Alzheimer’s disease. Alzheimers Dement. 2010; 6:394–403. https://doi.org/10.1016/j.jalz.2009.11.003 [PubMed]
- 38. Lindemer ER, Greve DN, Fischl BR, Augustinack JC, Salat DH. Regional staging of white matter signal abnormalities in aging and Alzheimer’s disease. Neuroimage Clin. 2017; 14:156–65. https://doi.org/10.1016/j.nicl.2017.01.022 [PubMed]
- 39. Mayo CD, Mazerolle EL, Ritchie L, Fisk JD, Gawryluk JR, and Alzheimer’s Disease Neuroimaging Initiative. Longitudinal changes in microstructural white matter metrics in Alzheimer’s disease. Neuroimage Clin. 2016; 13:330–38. https://doi.org/10.1016/j.nicl.2016.12.012 [PubMed]
- 40. Laporta-Hoyos O, Pannek K, Ballester-Plané J, Reid LB, Vázquez É, Delgado I, Zubiaurre-Elorza L, Macaya A, Póo P, Meléndez-Plumed M, Junqué C, Boyd R, Pueyo R. White matter integrity in dyskinetic cerebral palsy: relationship with intelligence quotient and executive function. Neuroimage Clin. 2017; 15:789–800. https://doi.org/10.1016/j.nicl.2017.05.005 [PubMed]
- 41. Ryan NS, Keihaninejad S, Shakespeare TJ, Lehmann M, Crutch SJ, Malone IB, Thornton JS, Mancini L, Hyare H, Yousry T, Ridgway GR, Zhang H, Modat M, et al. Magnetic resonance imaging evidence for presymptomatic change in thalamus and caudate in familial Alzheimer’s disease. Brain. 2013; 136:1399–414. https://doi.org/10.1093/brain/awt065 [PubMed]
- 42. Aggleton JP, Pralus A, Nelson AJ, Hornberger M. Thalamic pathology and memory loss in early Alzheimer’s disease: moving the focus from the medial temporal lobe to Papez circuit. Brain. 2016; 139:1877–90. https://doi.org/10.1093/brain/aww083 [PubMed]
- 43. Wakana S, Jiang H, Nagae-Poetscher LM, van Zijl PC, Mori S. Fiber tract-based atlas of human white matter anatomy. Radiology. 2004; 230:77–87. https://doi.org/10.1148/radiol.2301021640 [PubMed]
- 44. Di Cesare G, Pinardi C, Carapelli C, Caruana F, Marchi M, Gerbella M, Rizzolatti G. Insula Connections With the Parieto-Frontal Circuit for Generating Arm Actions in Humans and Macaque Monkeys. Cereb Cortex. 2019; 29:2140–47. https://doi.org/10.1093/cercor/bhy095 [PubMed]
- 45. Zhu YC, Chabriat H, Godin O, Dufouil C, Rosand J, Greenberg SM, Smith EE, Tzourio C, Viswanathan A. Distribution of white matter hyperintensity in cerebral hemorrhage and healthy aging. J Neurol. 2012; 259:530–36. https://doi.org/10.1007/s00415-011-6218-3 [PubMed]
- 46. Yeatman JD, Wandell BA, Mezer AA. Lifespan maturation and degeneration of human brain white matter. Nat Commun. 2014; 5:4932. https://doi.org/10.1038/ncomms5932 [PubMed]
- 47. Habes M, Sotiras A, Erus G, Toledo JB, Janowitz D, Wolk DA, Shou H, Bryan NR, Doshi J, Völzke H, Schminke U, Hoffmann W, Resnick SM, et al. White matter lesions: spatial heterogeneity, links to risk factors, cognition, genetics, and atrophy. Neurology. 2018; 91:e964–75. https://doi.org/10.1212/WNL.0000000000006116 [PubMed]
- 48. Lampe L, Kharabian-Masouleh S, Kynast J, Arelin K, Steele CJ, Löffler M, Witte AV, Schroeter ML, Villringer A, Bazin PL. Lesion location matters: the relationships between white matter hyperintensities on cognition in the healthy elderly. J Cereb Blood Flow Metab. 2019; 39:36–43. https://doi.org/10.1177/0271678X17740501 [PubMed]
- 49. Mishra VR, Sreenivasan KR, Zhuang X, Yang Z, Cordes D, Banks SJ, Bernick C. Understanding white matter structural connectivity differences between cognitively impaired and nonimpaired active professional fighters. Hum Brain Mapp. 2019; 40:5108–22. https://doi.org/10.1002/hbm.24761 [PubMed]
- 50. Weintraub S, Salmon D, Mercaldo N, Ferris S, Graff-Radford NR, Chui H, Cummings J, DeCarli C, Foster NL, Galasko D, Peskind E, Dietrich W, Beekly DL, et al. The Alzheimer’s Disease Centers’ Uniform Data Set (UDS): the neuropsychologic test battery. Alzheimer Dis Assoc Disord. 2009; 23:91–101. https://doi.org/10.1097/WAD.0b013e318191c7dd [PubMed]
- 51. Morris JC, Weintraub S, Chui HC, Cummings J, Decarli C, Ferris S, Foster NL, Galasko D, Graff-Radford N, Peskind ER, Beekly D, Ramos EM, Kukull WA. The Uniform Data Set (UDS): clinical and cognitive variables and descriptive data from Alzheimer Disease Centers. Alzheimer Dis Assoc Disord. 2006; 20:210–16. https://doi.org/10.1097/01.wad.0000213865.09806.92 [PubMed]
- 52. Zhang Y, Brady M, Smith S. Segmentation of brain MR images through a hidden Markov random field model and the expectation-maximization algorithm. IEEE Trans Med Imaging. 2001; 20:45–57. https://doi.org/10.1109/42.906424 [PubMed]
- 53. Smith SM. Fast robust automated brain extraction. Hum Brain Mapp. 2002; 17:143–55. https://doi.org/10.1002/hbm.10062 [PubMed]
- 54. Griffanti L, Zamboni G, Khan A, Li L, Bonifacio G, Sundaresan V, Schulz UG, Kuker W, Battaglini M, Rothwell PM, Jenkinson M. BIANCA (Brain Intensity AbNormality Classification Algorithm): A new tool for automated segmentation of white matter hyperintensities. Neuroimage. 2016; 141:191–205. https://doi.org/10.1016/j.neuroimage.2016.07.018 [PubMed]
- 55. Sundaresan V, Zamboni G, Le Heron C, Rothwell PM, Husain M, Battaglini M, De Stefano N, Jenkinson M, Griffanti L. Automated lesion segmentation with BIANCA: impact of population-level features, classification algorithm and locally adaptive thresholding. Neuroimage. 2019; 202:116056. https://doi.org/10.1016/j.neuroimage.2019.116056 [PubMed]
- 56. Tipping ME. Sparse Bayesian learning and the relevance vector machine. J Mach Learn Res. 2001; 1:211–44. http://www.jmlr.org/papers/volume1/tipping01a/tipping01a.pdf.
- 57. Schrouff J, Rosa MJ, Rondina JM, Marquand AF, Chu C, Ashburner J, Phillips C, Richiardi J, Mourão-Miranda J. PRoNTo: pattern recognition for neuroimaging toolbox. Neuroinformatics. 2013; 11:319–37. https://doi.org/10.1007/s12021-013-9178-1 [PubMed]
- 58. Hua K, Zhang J, Wakana S, Jiang H, Li X, Reich DS, Calabresi PA, Pekar JJ, van Zijl PC, Mori S. Tract probability maps in stereotaxic spaces: analyses of white matter anatomy and tract-specific quantification. Neuroimage. 2008; 39:336–47. https://doi.org/10.1016/j.neuroimage.2007.07.053 [PubMed]