


Introduction
Forest musk deer (Moschus berezovskii, FMD) is an endangered artiodactylous species [1], which has been listed on the IUCN Red List of Threatened Species and the Appendices of the CITES. In addition, the FMD is also included as the first grade protected species under the Wild Animal Protection Law in China since 2002 [2]. Males and female FMDs have no antlers, and their hind legs are about 1/4 longer than the forelegs, indicating a tendency to move by leaping. Male FMD has long, upper canine teeth that project downward up to 5 cm below the lips that are used for threat and self-display. The most unique characteristic is the musk sac or pod which the males possess [2, 3]. For a long time, musk deer has been valued for their musk in the musk sac, secreted by the musk gland possessed by the males. The musk liquid, a jelly-like milky white substance, is preliminarily secreted and becomes a powdery and ripe musk with strong odor and brown color when it develops and dries gradually. Wild musk deers are killed to cut off the musk sac from the mature males between the genital organs and the umbilicus, as they made a profit in the trade.
Microsatellites (or simple sequence repeats, SSRs) are tandem repetitions of 1–6 bp oligonucleotide repeat units of DNA sequences [4], which are widely distributed in both coding and noncoding regions of eukaryotic and prokaryotic genomes [5, 6]. SSRs have owned significant features of high reproducibility, high polymorphism, selective neutrality, codominant inheritance, abundance and genome-wide coverage [7], which have been widely employed in population genetics, phylogenetics, genetic mapping, linkage and kinship relationships [8]. SSRs are involved in chromatin fractions, gene expression and regulation, and transcription and protein function. The traditional methods of developing SSR markers are screening genomic DNA libraries or constructing SSR-enriched libraries, both of which are often costly, time-consuming, and labor-concentrating [9, 10]. The cost of sequencing is reduced with the fast development of high-throughput sequencing technology. Analysis technology of bioinformatics is also developing rapidly, the analysis results of which are more reliable. Thus, we have sequenced the whole genome of FMD, completed the genome assembly and annotation process. However, basing on the obtainability of genome sequences, it makes possible to mine SSRs in a large scale as genome level, and SSRs analysis is helpful to explore their distributions, functions, and evolution [11, 12].
The number of captive FMD populations is small, and the gene communication of different captive populations is difficult. These facts lead to inbreeding in different captive FMD populations. Therefore, it is very necessary and urgent to develop high quality genetic markers and carry out genetic diversity and genetic management of FMD. All of the existing SSR markers of FMD were dinucleotide repeats [13]. Compared with dinucleotide repeats, tetranucleotide SSR makers can gain more accurate and reliable genotyping. In the FMD genome, we detected and characterized SSRs and examined their distributions and variations in different genomic regions, including their occurrences in 5'-untranslated regions (5′UTRs), protein-coding regions (CDSs), introns, 3′UTRs and intergenic regions. SSR motifs were mined and characterized in the different genomic regions of FMD genome. Furthermore, GC-content of SSRs was analyzed in the FMD genome. The study may help to explore the variation analysis of repeat copy numbers of SSRs in the different genomic regions of FMD genome. Finally, we have used these SSRs sequences for developing polymorphic SSR markers for population genetics studies.
Results
The number, relative abundance and proportion of mono- to hexanucleotide P-SSRs in FMD genome
A total of 680,635 perfect (P) SSRs were identified in the FMD genome, the relative abundance of which was 247.75#/Mb (Table 1). Mononucleotide P-SSRs were the most abundant category, accounting for 40.19% of all SSRs, next was the pattern: di- > tri- > penta- > tetra- > hexanucleotide P-SSRs. In comparison, tetra- and hexa-nucleotide P-SSRs were less abundant. The most GC-content was in the tri- and hexanucleotide P-SSRs, and the least was in the mononucleotide P-SSRs. In comparison, the GC-content in mono- and tetranucleotide P-SSRs was less than that in genome-wide level, and the GC-content in the rest P-SSRs was more than that in genome-wide level.
Table 1. Overview of mono- to hexanucleotide P-SSRs in the FMD genome.
| Type | Mono- | Di- | Tri- | Tetra- | Penta- | Hexa- | Total | ||||||||||||||||||||||||||||||||||||||||||||||||||||||||||||||||||||||||||||||||||||||||||||
| # of P-SSRs | 273,518 | 148,175 | 122,105 | 399,77 | 962,62 | 598 | 680,635 | ||||||||||||||||||||||||||||||||||||||||||||||||||||||||||||||||||||||||||||||||||||||||||||
| GC-content (in %) | 1.72 | 37.14 | 62.56 | 29.13 | 40.27 | 59.97 | 32.41 | ||||||||||||||||||||||||||||||||||||||||||||||||||||||||||||||||||||||||||||||||||||||||||||
| Total length of P-SSRs (bp) | 3,192,531 | 2,719,558 | 2,077,536 | 678,452 | 106,801 | 15,420 | 8,790,299 | ||||||||||||||||||||||||||||||||||||||||||||||||||||||||||||||||||||||||||||||||||||||||||||
| Relative abundance (#/Mb) | 100.38 | 53.40 | 44.00 | 14.41 | 35.33 | 0.22 | 247.75 | ||||||||||||||||||||||||||||||||||||||||||||||||||||||||||||||||||||||||||||||||||||||||||||
| P-SSR percentage (%a) | 40.19 | 21.77 | 17.94 | 5.87 | 14.14 | 0.09 | 100.00 | ||||||||||||||||||||||||||||||||||||||||||||||||||||||||||||||||||||||||||||||||||||||||||||
| %a= mono- to hexanucleotide P-SSRs account for the proportion of all P-SSRs in the whole FMD genome. | |||||||||||||||||||||||||||||||||||||||||||||||||||||||||||||||||||||||||||||||||||||||||||||||||||
The most frequent P-SSR motifs for different length were counted in the FMD whole genome level (Table 2). In the mononucleotide repeat type, the unit (A)n were predominant (> 80 #/Mb), while (C)n repeats were rare (< 2 #/Mb). (AC)n, (AT)n, and (AG)n were the three most common dinucleotide SSRs units, the three of which accounted for over 99% of all dinucleotide SSRs. In comparison, the (AC)n was particularly dominant, and (CG)n was the least common unit. Among the trinucleotide repeat type, (ACG)n and (AGC)n were the most common repeat units, next were the (AAC)n, (AAT)n, (ACC)n and (CCG)n, and the (ACT)n motif was the least common in the FMD genome. In the tetranucleotide P-SSRs, the (AAAT)n unit was the most common motifs, the next were the (AAAC)n and (AAAG)n, and the (CCGG)n motif was the least common in the FMD genome. Penta- and hexanucleotide P-SSRs have a great deal of motifs in the FMD genome. The (AACTG)n and (AGTTC)n were the two most common pentanucleotide motifs, the (AACCCT)n, (ACCCCC)n, and (AGGGTT)n motif were most frequent hexanucleotide motifs.
Table 2. The most frequent P-SSR motifs in the FMD genome.
| Repeat motifsa | |||||||||||||||||||||||||||||||||||||||||||||||||||||||||||||||||||||||||||||||||||||||||||||||||||
| Mono- | Di- | Tri- | Tetra- | Penta- | Hexa- | ||||||||||||||||||||||||||||||||||||||||||||||||||||||||||||||||||||||||||||||||||||||||||||||
| A(80.48) | AC (34.47) | ACG (17.94) | AAAT (4.12) | AACTG (0.87) | AACCCT (0.02) | ||||||||||||||||||||||||||||||||||||||||||||||||||||||||||||||||||||||||||||||||||||||||||||||
| C(1.08) | AG (4.17) | AGC (17.74) | AAAC (1.78) | AGTTC (0.87) | ACCCCC (0.02) | ||||||||||||||||||||||||||||||||||||||||||||||||||||||||||||||||||||||||||||||||||||||||||||||
| — | AT (14.62) | AAC (2.00) | AAAG (0.88) | AAGTG (0.02) | AGGGTT (0.02) | ||||||||||||||||||||||||||||||||||||||||||||||||||||||||||||||||||||||||||||||||||||||||||||||
| — | CG (0.14) | AAT (1.97) | AGGT (0.64) | AAACA (0.01) | AAACAA (0.01) | ||||||||||||||||||||||||||||||||||||||||||||||||||||||||||||||||||||||||||||||||||||||||||||||
| — | — | ACC (1.39) | ACGT (0.61) | AAGGC (0.01) | ACACAG (0.01) | ||||||||||||||||||||||||||||||||||||||||||||||||||||||||||||||||||||||||||||||||||||||||||||||
| — | — | CCG (1.09) | ACCT (0.59) | GCCTT (0.01) | ACTGCT (0.01) | ||||||||||||||||||||||||||||||||||||||||||||||||||||||||||||||||||||||||||||||||||||||||||||||
| a The numbers in parentheses refer to relative abundance. | |||||||||||||||||||||||||||||||||||||||||||||||||||||||||||||||||||||||||||||||||||||||||||||||||||
Difference of P-SSRs in different genomic regions of FMD genome
Difference of mono- to hexanucleotide P-SSRs was analyzed in different genomic regions of FMD genome, and these results were indicated in Figure 1 and Table 3. In the 5′UTR regions, trinucleotide P-SSRs was the most abundant type, next was the pattern: mono- > di- > tetra- > penta- > hexa-nucleotide P-SSRs. In the CDSs, trinucleotide P-SSRs was the most abundant type, next was the pattern: hexa- > mono- > tetra- > penta- > dinucleotide P-SSRs. In the introns, mononucleotide P-SSRs was the most abundant type, next was the pattern: di- > tri- > penta- > tetra- > hexanucleotide P-SSRs. In the 3′UTRs, mononucleotide P-SSRs was the most abundant type, next was the pattern: di- > tri- > tetra- > penta- > hexanucleotide P-SSRs. In the TEs, mononucleotide P-SSRs was the most abundant type, next was the pattern: di- > tetra- > tri- > penta- > hexanucleotide P-SSRs. In the intergenic regions, mononucleotide P-SSRs was the most abundant type, next was the pattern: di- > tri- > penta- > tetra- > hexanucleotide P-SSRs. In comparison, the intronic and intergenic regions had the most total P-SSR abundance comparing with other genomic regions in the FMD genome (Table 3). Therefore, it was inferred that P-SSRs were less abundant in protein-coding regions than non-coding regions in the FMD genome.
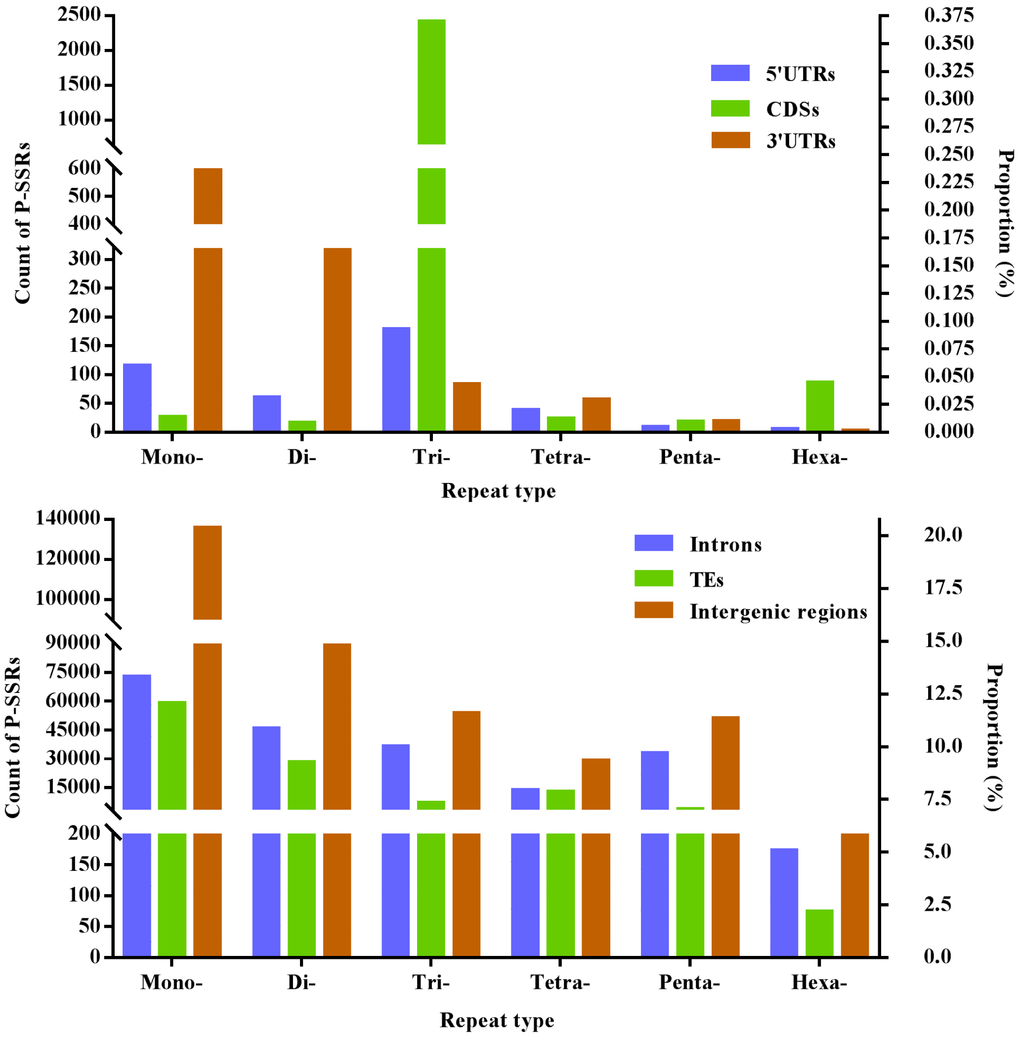
Figure 1. The proportion of mono- to hexanucleotide P-SSRs in different genomic regions of FMD genome.
Table 3. Number, percentage, and relative abundance of P-SSRs in the different genomic regions of the FMD genome.
| Repeat type | Genomic regions | ||||||
| 5′UTRs | CDSs | Introns | 3′UTRs | TEs | Intergenic regions | ||
| Mono- | # of P-SSRs | 115 | 26 | 72,591 | 598 | 58,987 | 135,726 |
| #/Mb | 59.10 | 0.76 | 104.31 | 78.20 | 49.01 | 91.61 | |
| Di- | # of P-SSRs | 60 | 16 | 457,58 | 316 | 27,997 | 89,153 |
| #/Mb | 30.83 | 0.47 | 54.79 | 41.32 | 22.93 | 62.54 | |
| Tri- | # of P-SSRs | 178 | 2,419 | 362,75 | 83 | 6,789 | 53,607 |
| #/Mb | 91.47 | 70.38 | 43.43 | 10.85 | 5.35 | 36.18 | |
| Tetra | # of P-SSRs | 38 | 23 | 134,58 | 56 | 12,619 | 28,975 |
| #/Mb | 19.53 | 0.67 | 16.11 | 7.32 | 8.58 | 19.56 | |
| Penta- | # of P-SSRs | 9 | 18 | 328,70 | 19 | 3,683 | 50,814 |
| #/Mb | 4.62 | 0.52 | 39.36 | 2.48 | 2.94 | 34.30 | |
| Hexa- | # of P-SSRs | 5 | 86 | 173 | 2 | 74 | 791 |
| #/Mb | 2.57 | 2.50 | 0.21 | 0.13 | 0.05 | 0.56 | |
| Total | # of P-SSRs | 405 | 2,588 | 201,125 | 1074 | 110,149 | 359,066 |
| #/Mb | 208.12 | 75.30 | 258.21 | 140.45 | 88.86 | 244.75 | |
In these genomic regions, the most GC-content occurred in the 5′UTRs (56.73%), next was the pattern: CDSs (53.80%) > 3′UTRs (43.79%) > introns (42.92%) > TEs (41.98%) > intergenic regions (39.42%). The AT- and GC-content of mono- to hexanucleotide P-SSRs were computed in the six genomic regions of the FMD genome, which the results were shown in Figure 2 and Supplementary Table 1. In these different regions of FMD genome, mononucleotide P-SSRs had the least GC-contents. In the 5′UTRs, we can know that the GC-content of di to hexanucleotide repeat types are more than their AT-content; trinucleotide P-SSRs had the most GC-content, next was the pattern: hexa- > tetra- > di- > penta- > mononucleotide P-SSRs. In the CDSs, the GC-contents of tri- to hexanucleotide P-SSRs were relatively high, which were more than their AT-content. In the 3′UTR regions, the GC-content of the mono- to tetranucleotide repeat types were less than their AT-content. In the introns, TEs, and intergenic regions, we can know that tri- and hexanucleotide P-SSRs had the most GC-contents, next was the pattern: penta- > di > tetra- > mononucleotide P-SSRs. There were of similar total GC-contents in the introns and intergenic regions. Therefore, it was inferred that the GC-content of P-SSRs is probably higher in protein-coding regions than that in the rest genomic regions.
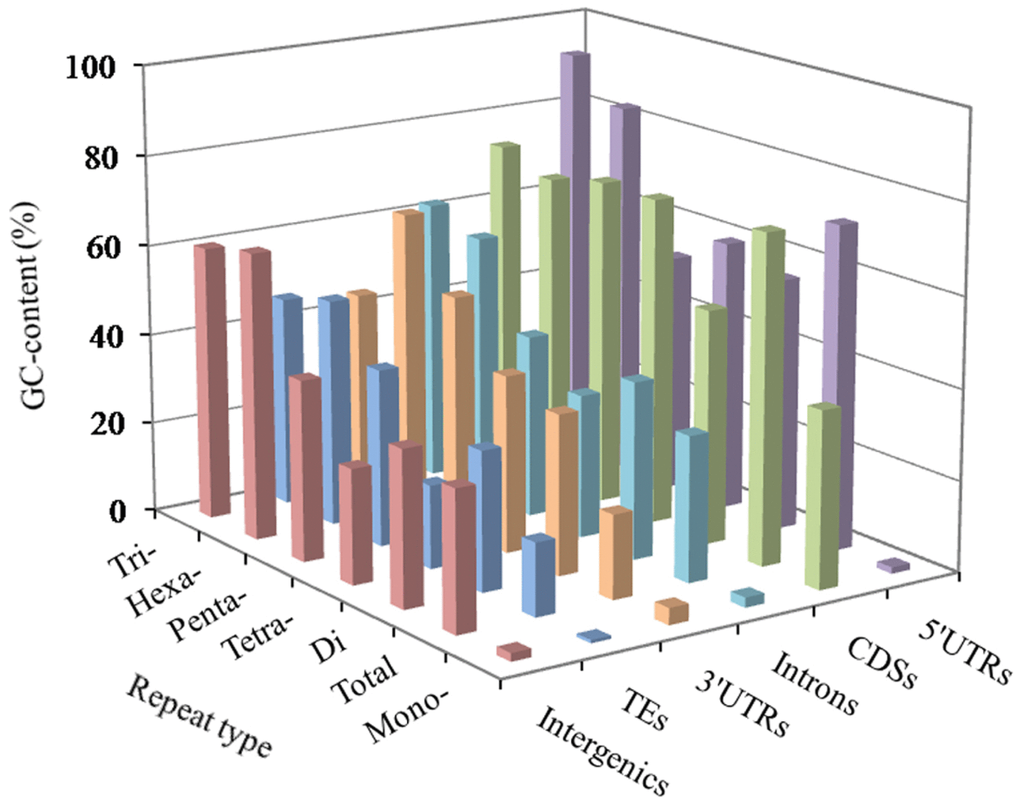
Figure 2. GC-content of mono- to hexanucleotide P-SSRs in different genomic regions of FMD genome.
Diversity of most frequent P-SSRs in the six regions of FMD
In the 5′UTR regions, the (A)n was the most abundant repeat unit, the next was the (CCG)n, and then were the (AGG)n, (AC)n, (AG)n, (AGC)n, (ACG)n, and (CCCG)n in order (Figure 3). In the CDS regions, the (CCG)n was the most abundant motifs, next were the (AGG)n, (ACC)n, (ACG)n, and (AGC)n, the third were the (AAG)n and (ACT)n (Figure 3). In the intronic regions, the (A)n was the most abundant motif, the next was the (AC)n, and then were the (ACG)n, (AGC)n, (AT)n, (AG)n and (AAAT)n in order (Figure 3). In the 3′UTR regions, the (A)n was the most abundant unit, next was the (AC)n, and then were the (AT)n, (AG)n and (C)n in order (Figure 3). In the TEs, the (A)n was the most common repeat unit, the next were the motif (AC)n and (AT)n, and then were the (AG)n, (AAAT)n, (AAT)n, (AAC)n, (AGC)n, and (AAAC)n in order (Figure 3). In the intergenic regions, the (A)n was the most abundant repeat unit, next was the motif (AC)n, and then were the (AT)n, (AGC)n, (ACG)n, (AG)n, (AAAT)n, (AAC)n, (AAT)n, and (AAAC)n in order (Figure 3). Therefore, it is inferred that there are the nonrandom distribution of P-SSR motifs in these different genomic regions.
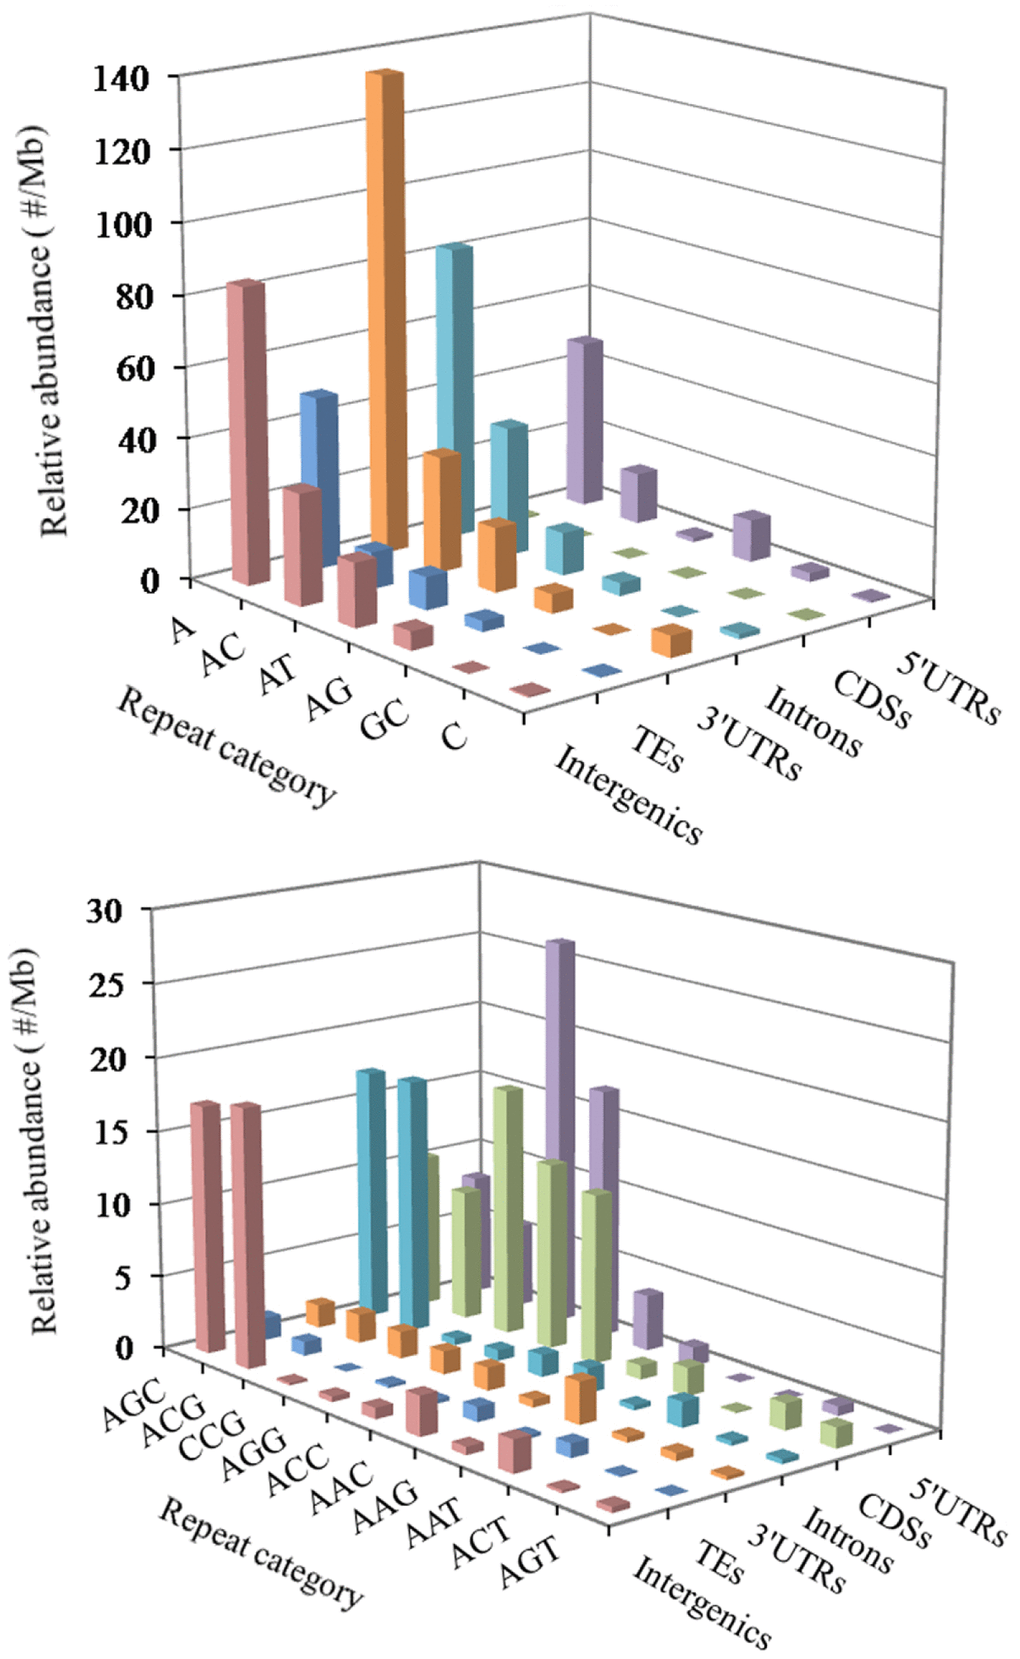
Figure 3. Distribution of different motifs of mono- to trinucleotide P-SSRs in different genomic regions of FMD genome.
The analysis of coefficient of variability (CV) of SSRs in different genomic regions of FMD
The repeat copy numbers (RCN) of the same P-SSRs had significantly difference in these genomic regions of FMD genome. In the RCN of mono- and dinucleotide P-SSRs, the intron regions and TEs had the most counts of SSRs loci, followed by the pattern: intergenic regions > 3′UTRs > 5′UTRs > CDSs (Figure 4). The RCN of trinucleotide P-SSRs had increased obviously in the CDS regions comparing with the 3′UTR and 5′UTR regions, which had more counts of SSRs loci (Figure 4).
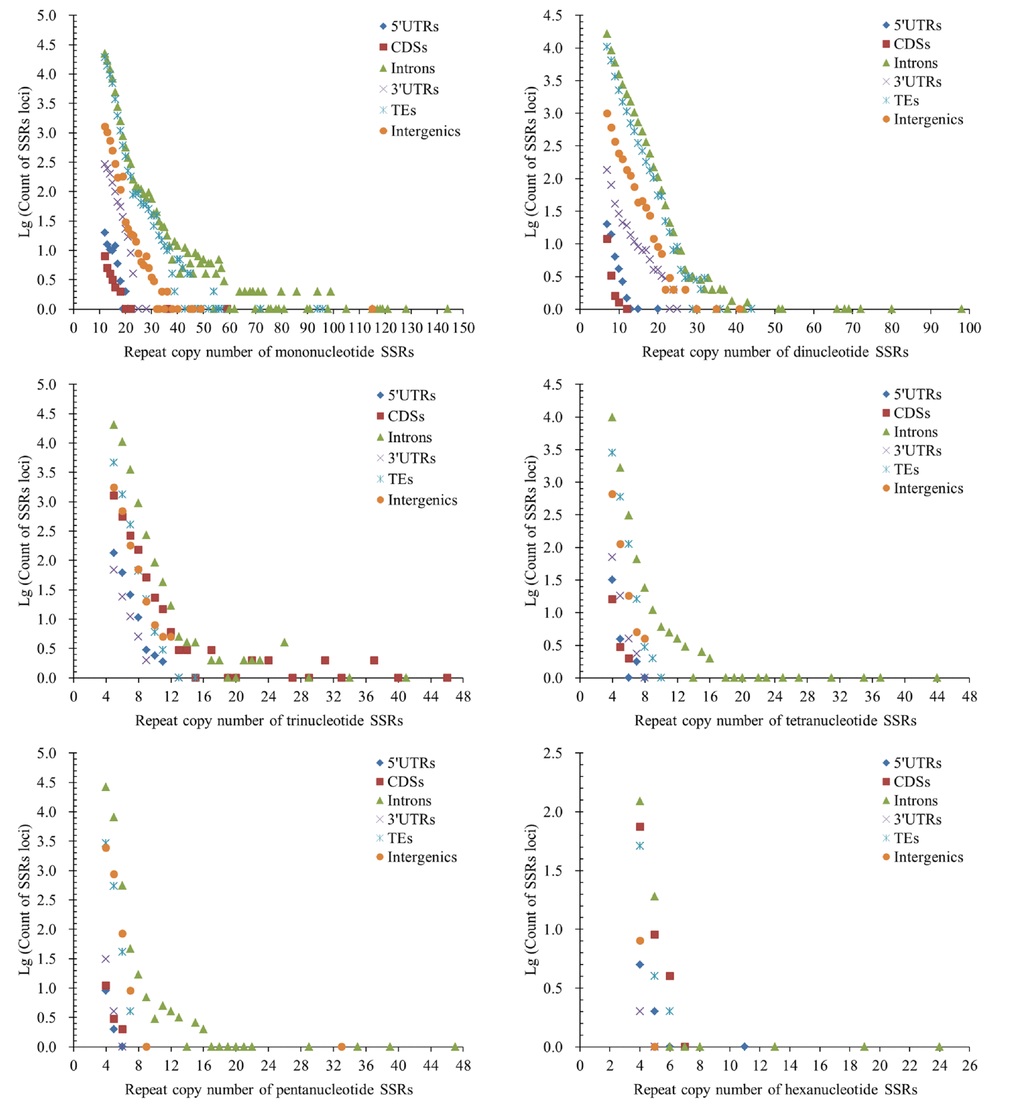
Figure 4. Comparative analysis of repeat copy number (RCN) of mono- to hexanucleotide P-SSRs in different genomic regions of FMD genome.
The RCN of trinucleotide SSRs had the fewest numbers of SSRs loci in the 5′UTR and 3′UTR regions (Figure 4). In the RCN of tetra- and pentanucleotide P-SSRs, the intron regions had the most numbers of SSRs loci, followed by the TEs and intergenic regions, the 5′UTR and CDS regions had fewer counts of SSRs loci (Figure 4). In the RCN of hexanucleotide P-SSRs, the numbers of P-SSRs loci had increased obviously in the CDSs regions in comparison to other genomic regions (Figure 4). The results showed that the RCN of different P-SSRs was significantly decreased with increasing of nucleotide repeat units.
The analysis of coefficient of variability (CV) of SSRs showed that the RCN variation of different P-SSRs had significantly decreased from mono- to hexanucleotide P-SSRs (Figure 5). In the CDS region, there were of similar CV variation in the di- and trinucleotide P-SSRs (Figure 5). The CV variation of the same P-SSRs had obviously difference in the six regions of FMD genome. The intronic and intergenic regions had relative higher CV variations of the RCN for the same P-SSRs, followed by the TEs, and the rest genomic regions had relative lower CV variations of the RCN (Figure 5).
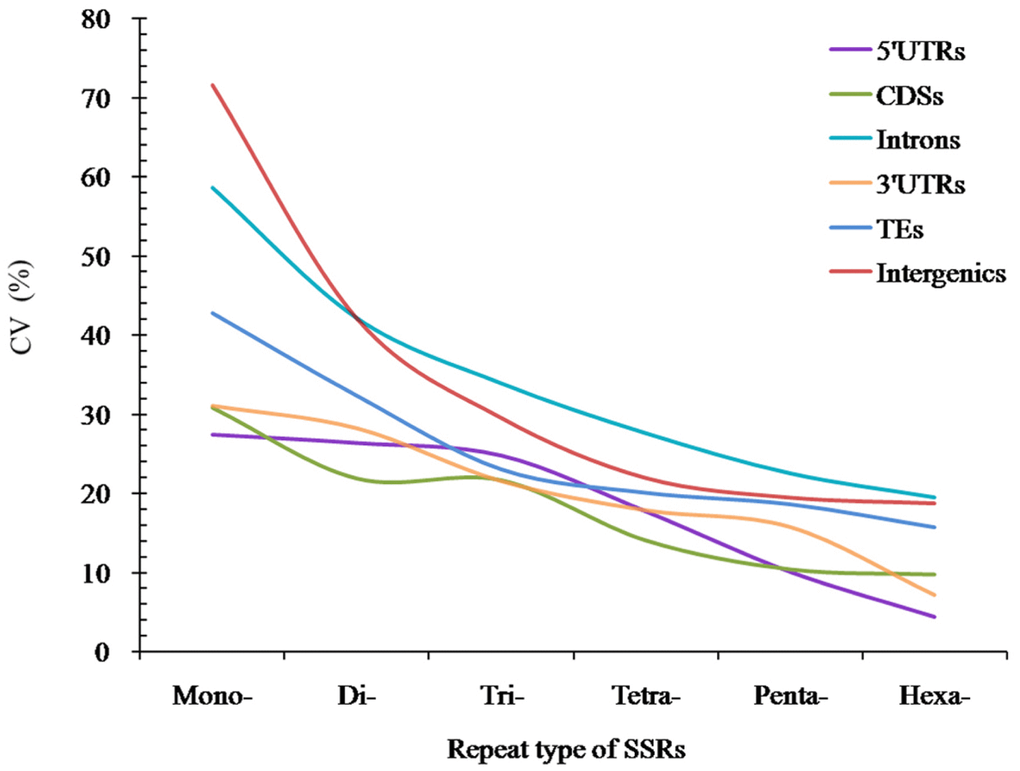
Figure 5. The CV analysis of RCN of P-SSRs in different genomic regions of FMD genome.
Development of SSR markers in the FMD
There were 39,977 tetranucleotide SSRs sequences recognized in the FMD genome. By using the above criteria, we isolated 2,160 SSR loci with a RCN of 10 to 22, and then 150 candidate sequences were suited to exploit tetranucleotide SSR markers for the FMD. We synthesized 58 pairs of primer for PCR amplification, the 58 loci of which displayed a single band of anticipated size after amplification. The forward primers of these 58 loci were labelled with different fluorescent dyes and then used to genotype 36 captive FMD (Sichuan, blood DNA). The primers which were not shown a clear single band of expected size or lacked polymorphism, were not used. Finally, 22 novel tetranucleotide SSRs loci were detected for the FMD.
The DNA sequences of these 22 loci were uploaded to NCBI (GenBank accession numbers KT390284–KT390300; KT844392–KT844396). Based on these 22 tetranucleotide SSRs found in this study, we recognized a total of 83 alleles, the number of which is ranged from 2 to 7 for each locus. The observed and expected heterozygosity at each locus ranged from 0.115 to 0.962 and from 0.111 to 0.776, respectively. The PIC ranged from 0.103 to 0.726 with an average of 0.412. The population genetic analysis will be affected if the loci is not sufficient to meet HWE. 1 out of the novel 22 loci deviated obviously from HWE (P < 0.01, Locus name: LS-55-1, Accession number: KT844935, motif=(CATA)14, Tm=59 °C, k=7, Ar=7.00), which should be deserted.
Genetic diversity of captive FMD population in china
The genetic diversity of Sichuan captive FMD population was analysed by using the above 21 SSRs markers. The results presented in the Table 4, 76 alleles in total were recognized in the midst of 36 FMDs. The number of alleles ranged from 2 to 6 for each locus. The mean AR was 3.609, ranged from 1.965 to 6.000 alleles. The mean HO and HE were 0.423 and 0.445, espectively, which ranged from 0.115 to 0.692 and from 0.111 to 0.735, respectively. The average PIC was 0.397 with the range of 0.103 - 0.683 in the population. HWE tests indicated that there was not a deviation of HWE for the 21 markers in the population (P > 0.01).
Table 4. Characteristics of the novel microsatellite marker system and the genetic diversity of captive FMD population, including locus names, primer sequences, accession number, repeat unit, fluorescent dyes, annealing temperatures (Tm), length (bp), numbers of individuals genotyped (N), numbers of alleles (k), observed heterozygosity (HO), expected heterozygosity (HE), allelic richness (Ar), Polymorphism Information Contents (PIC), HWE P values (P-value).
| Locus name | Primer sequences (5′—3′) | Accession no. | Repeat unit | Fluorescent dyes | Tm (°C) | Range (bp) | N | k | HO | HE | Ar | PIC | P-value |
| LS-2-1 | F: GATCGAGTTGCAGGAGTC R: CACCATTCAATTCAGAGAAGC | KT390284 | (GCAG)10 | FAM | 57 | 416-440 | 36 | 6 | 0.385 | 0.65 | 6.000 | 0.593 | 0.03 |
| LS-6-1 | F: CAGGATCTGCTTCTGACATT R: ACCAAATCCAACAAGATCCG | KT390285 | (GATG)8 | HEX | 59 | 420-432 | 36 | 3 | 0.538 | 0.555 | 3.000 | 0.484 | 0.376 |
| LS-7-1 | F: TAATTAGAGGGGTGTAAGCG R: GGACCGAGCAAGTAGTAAC | KT390286 | (AGGA)8 | HEX | 57 | 412-428 | 36 | 2 | 0.154 | 0.145 | 2.000 | 0.132 | 0.884 |
| LS-8-1 | F: TGTTCCTGGGATTCTTGAAG R: CATAATTGCCAAAGTGCTGT | KT390287 | (AGAC)8 | FAM | 55 | 408-432 | 36 | 5 | 0.654 | 0.675 | 5.000 | 0.598 | 0.311 |
| LS-9-1 | F: ATGAATCAACTCAGTCCCTG R: GTGGTTAGGACTCAGCATTT | KT390288 | (ATAG)8 | HEX | 59 | 410-430 | 36 | 3 | 0.192 | 0.278 | 2.895 | 0.255 | 0.054 |
| LS-12-3 | F: GCGGGATCATGAGAATAGGT R: CCACATTCTCAAGTTATCCG | KT390289 | (CAGA)8 | FAM | 61 | 408-432 | 36 | 3 | 0.538 | 0.679 | 3.00 | 0.592 | 0.097 |
| LS-13-1 | F: TTGATCCAGTTCAGCAAAGT R: TTTGCAACTTCAATCCACTG | KT390290 | (AGAA)8 | FAM | 61 | 400-432 | 36 | 6 | 0.615 | 0.655 | 6.000 | 0.582 | 0.253 |
| LS-14-2 | F: GGTCTTTCCTG TCACTCCTC R: GTCGCAGCTAC TAATGCTTT | KT390291 | (TGCG)8 | FAM | 57 | 396-432 | 36 | 6 | 0.692 | 0.735 | 5.997 | 0.683 | 0.562 |
| LS-16-1 | F: AGCCATATTCTCAAACCATTC R: CAGAGAGAGACCAGGAACAAC | KT390292 | (AGAC)8 | HEX | 57 | 406-430 | 36 | 4 | 0.577 | 0.508 | 3.990 | 0.454 | 0.181 |
| LS-17-1 | F: TTAACATGACATATGGGAGAG R: TCCAGCATTTTATCATTATTG | KT390293 | (TATG)8 | FAM | 57 | 295-315 | 36 | 4 | 0.615 | 0.63 | 4.000 | 0.548 | 0.503 |
| LS-18-1 | F: CATCCATTCATCTGTCCCTT R: TCCATCCTCCTATCCAAAC | KT390294 | (CCAT)8 | HEX | 57 | 412-430 | 36 | 3 | 0.577 | 0.562 | 2.993 | 0.472 | 0.391 |
| LS-24-1 | F: TTAAACATATGCCTAAGAGTCC R: GCCCAGCAATTCTACTTCT | KT390295 | (TTGG)7 | HEX | 57 | 404-428 | 36 | 4 | 0.615 | 0.613 | 4.000 | 0.555 | 0.607 |
| LS-27-1 | F: CAGGGTAGCTCTAGATTTGT R: GAACTGGCTACTGACATTCT | KT390296 | (ATGG)7 | HEX | 55 | 368-388 | 36 | 4 | 0.308 | 0.278 | 3.995 | 0.257 | 0.54 |
| LS-28-1 | F: CCTAATTTTCCAGCTTGCAG R: AACTGGTGCATGAGTGTATT | KT390297 | (ATCC)7 | FAM | 57 | 396-428 | 36 | 3 | 0.154 | 0.147 | 3.000 | 0.138 | 0.883 |
| LS-29-1 | F: GGAAACACACATCAGAACTC R: GATTCATGTCACTGTATGGC | KT390298 | (TTTA)7 | HEX | 57 | 308-328 | 36 | 3 | 0.346 | 0.386 | 3.000 | 0.343 | 0.351 |
| LS-30-1 | F: CATCACTGAAGCGACTTAGA R: CTGACTTTCCATTGCTACCT | KT390299 | (ATCC)7 | FAM | 57 | 391-403 | 36 | 2 | 0.231 | 0.208 | 1.968 | 0.183 | 0.722 |
| LS-31-1 | F: GTGCTGTATTAGGCTTCAGA R: ATACACACTCATTCCCATCC | KT390300 | (ATGG)7 | HEX | 57 | 408-428 | 36 | 2 | 0.154 | 0.208 | 2.000 | 0.183 | 0.274 |
| LS-35-1 | F: CCCTCAATTCCCTTCGATAG R: TTTGGAGATGATGGACCTTG | KT844932 | (TGGA)7 | FAM | 57 | 178-190 | 36 | 2 | 0.115 | 0.111 | 1.965 | 0.103 | 0.94 |
| LS-47-1 | F: GCCCAGCAATTCTACTTCTA R: AACATATGCCTAAGAGTCCA | KT844933 | (CCAA)15 | FAM | 59 | 220-244 | 36 | 4 | 0.615 | 0.571 | 4.000 | 0.512 | 0.319 |
| LS-50-1 | F: GGGTTGGTATGGAAAGTTCT R: GAATGGGCTTTTATGATGGC | KT844934 | (TCCA)12 | HEX | 61 | 215-235 | 36 | 4 | 0.5 | 0.455 | 3.995 | 0.397 | 0.235 |
| LS-56-1 | F: GTACAGTACCATGCAGTCTT R: AAGTTATCCATCTCCCAACC | KT844936 | (CATA)12 | HEX | 59 | 270-286 | 36 | 3 | 0.308 | 0.305 | 3.000 | 0.277 | 0.656 |
Discussion
In order to ensure the results surveyed by MSDB were more credible, the SSR software Krait [14] was used to verify the consistency of the results, results of which both softwares were consistent. In this study, we discovered 680,635 P-SSRs from the FMD genome, and extrapolated their abundance and genomic distribution in the 5′UTRs, CDSs, 3′UTRs, TEs, intronic and intergenic regions. The development and verification of SSR markers at a whole-genome scale have been shown high intra-specific polymorphic potential [15]. Subsequently, 22 polymorphic SSRs from the FMD genome were recognized and characterized. Our results indicated that the distributional pattern of SSRs in FMD exhibited widespread similarity with the bovid species and deers. P-SSRs occupied 0.43% of FMD genome sequences, the percentage of which was well consistent with Bos taurus (0.48%), Bubalus bubalis (0.48%), B. mutus (0.46%), Ovis aries (0.48%), Capra hircus (0.46%), Pantholops hodgsonii (0.44%) [10], Odocoileus virginianus (0.42%), Giraffa camelopardalis (0.45%), whereas, these proportions were inconsistent with Ailuropoda melanoleuca (0.64%), Ursus maritimus (0.79%) [16], and primates (Otolemur garnetti: 0.59%, Callithrix jacchus: 0.66%, macaques: 0.83%-0.88%, Chlorocebus sabaeus: 0.91%, Papio anubis: 0.88%, Nomascus leucogenys: 0.73%, Gorilla gorilla: 0.94%, Pongo abelii: 0.73%, Pan troglodytes: 0.77%, Homo sapiens: 0.74%) [17, 18]. The above proportions of SSRs were analyzed by using the same parameter setting within the above species. These differences may be due to the specificity of species. Mononucleotide SSRs were more than other nucleotide SSR types in the eukaryotic genome [19]. our results also showed that mononucleotide SSRs were the most abundance, which was consistent with previous reports [18, 20–22]. Previous studies have shown that SSRs were frequently associated with TEs [23]. We have demonstrated that there was a similar association between SSRs and TEs. It has been thought that SSRs are derived from another sequence imported by TE or duplications [24, 25]. Short interspersed repeats (SINEs), long interspersed repeats (LINEs) and other retrotransposons are TE classes able to produce SSRs [26]. (AT)n repeats are frequently associated with this TE family in rice [27]. In the human genome a significant positive association also exists between A-rich SSRs and SINEs [28]. This association has been reported in many organisms, however, a great abundance of TEs can′t always combine with a great abundance of SSRs [29].
It has been demonstrated that the RCN of SSRs extension or shrinking directly affected the relevant gene expression and even caused dozens of diseases. The RCN expansions or contraction of (A)n in the CDS regions inactivated mismatch repair (MMR) genes [30, 31], signal transduction genes [32, 33], transcriptional regulation genes [34], apoptosis genes [35] and caused human cancers [36]. It has been reported that trinucleotide SSRs were linked to multiple genetic disorders [37]. SSRs are unstable, the RCN of which can grow from one generation to the next [38]. The expansion of RCN in the CDSs or in the regulatory regions, which may change the gene expression, and even are linked with illness phenotype [39]. In genes of human, the RCN expansion of trinucleotide SSRs are linked with several neurological diseases, such as fragile X syndrome [40], Huntington′s disease and several forms of ataxia [41], and myotonic dystrophy [42]. The RCN expansion of trinucleotide SSRs is usually deemed to be own to DNA replication slippage and unequal recombination in incremental cell [43]. The RCN expansions of (CGG)n in 5′UTRs of the fragile X mental retardation-1 (FMR1) gene were n ≥ 200, which resulted in human mental retardation [44], whereas the (CGG)40–200 were also related to cognitive/psychosocial impairment [45], fragile-X-like phenotypes, and woman ovarian dysfunction [46, 47]. The RCN expansions of (CAG)n in 5′UTRs were ranged from 55 to 78 that caused human spinocerebellar ataxia (SCA)12 disease [48]. The RCN expansions of (CTG)n in 3′UTRs led to dystrophia myotonic 1 [49] and SCA8 disease [50]. The RCN expansions of (CA)n in the intron regions could enhance the gene transcription of epidermal growth factor receptor and involve in breast carcinogenesis [51]. The RCN expansions of (GAA)n in the introns inhibited Friedreich′s ataxia (FRDA) gene expression or interfered mRNA formation and led to FRDA disease [52, 53]. The RCN expansions of (ATTCT)n situated in intron 9 of the SCA10 gene which caused SCA10 disease [54]. The RCN of (CAG)n in the human CDSs was expanded for 6 to 35 that performed their normal function, whereas, the (CAG)36-120 are translated into lengthened (Gln)12-40 tracts within the relevant proteins that resulted in Huntington′s disease (HD) [55]. Extended (Gln)n tracts were poisonous to neurons and peripheral cells alike [56]. It will become the predominant toxic moiety if (Gln)n length is more than regular repeat number [55]. Generally, the numbers of SSRs decreased as the increase of repeat unit and the RCN. This is nearly consistent with that in eukaryotes [5, 57] and prokaryotes [58]. This may be explained by the fact that SSRs with a greater repeat copy number may be more instable due to the increased probability of slippage [26].
SSR distributions are nonrandom and strongly biased in different genomic regions. The counts of mono- and dinucleotide SSR units exceeded other nucleotide SSR motifs in all fungal genomes. In the FMD genome, the most SSR abundance was found in intronic and intergenic regions, followed by the pattern: 3′UTRs > 5′UTRs > TEs > CDSs. The two genomic regions, intronic and intergenic regions, reveal a more similar relative abundance of SSRs in the FMD genome. In the primates, trinucleotide SSRs show approximately double greater abundance in the 5′UTRs than in the CDSs, whereas the latter had much more common trinucleotide P-SSRs than in the intron, 3′UTRs, and TEs [17]. This pattern may be associate with frequencies of amino acids encoded by rich SSRs in the corresponding proteins. It has been verified that SSRs in CDS regions were less abundant than those in intergenic regions [59]. The SSR frequency showed slight difference from the first to the last exon in mammalian species [60]. Tri- and hexanucleotide SSRs predominated in CDS regions of FMD, whereas, tetra- and pentanucleotide SSRs were less abundant in this regions. These trifold SSRs are chosen to avoid possible frameshift mutation. Non-random distributions of trifold SSRs and amino acid repeats have been found in different functional proteins [5, 61, 62], suggesting that these repeats are subject to natural selection [63]. SSRs situated in exonic regions may play a role in gene transcription, regulation, mRNA splicing, and gene silencing [64]. Polymorphic SSRs in CDSs, 5′UTRs or 3′UTRs could change the gene expression and/or protein structure, which may have a role to play in the mechanisms of adaptation, survival and evolution of species. The RCN expansions or contraction of (A)n in the CDS regions of MMR genes could give rise to frameshift mutation in MMR-deficient cells [30]. Furthermore, the difference of SSR abundance between 5′UTRs and 3′UTRs could play the regulatory role of protein translation and/or mRNA steadiness [65]. We well known that SSRs in 3′UTRs can be involved in transcription slides by extension and result in phenotypic disorders [49, 64]. SSR evolution in CDS regions is similar to those of SSRs in 5′UTR and 3′UTR regions, but is not similar to those of SSRs in intron and intergenic regions. The SSRs in CDS regions reveal a higher mutation rate than that in non-repeating sequence regions. SSR variations in the CDS and UTR regions could resulted in frameshift mutation, gene expression silencing, loss of protein function, and even multiple diseases.
It has been reported that the abundance of SSRs in protein-coding regions shows an incline to some specific motifs. The (A)n was more common than the (C)n in the CDS regions of FMD, this is consistent with primates [17, 66]. In the CDSs of FMD, the (CCG)n were the most predominant triplet repeat units, the next were the (AGG)n, (ACC)n, (ACG)n, and (AGC)n. In 10 primates, the (AGC)n and (AGG)n were the most abundant repeat units, the next were the motif (CCG)n and (ACG)n in the coding regions [17, 20]. The (CCG)n and (ACG)n translating for (Ala)n, (Gly)n, (Arg)n, and (Pro)n were relatively abundant in primate genes [67]. The (AAT)n and (AAC)n are rarely present in the coding regions of FMD. The (AAT)n motifs can also act as a stop codon, which may explain their lower occurrences in CDSs. The (CG)n and (CCG)n repeats were poorly represented in the 3′UTRs, TEs, intronic and intergenic regions of FMD, this corresponded with the previous report in the primates [17]. The (CCG)n motifs were the most abundant repeats in 5′UTRs and CDSs of FMD. In ten primates, the (CCG)n units were the most common motifs in 5′UTRs and were the second most frequent motif in the CDSs [17]. The RCN expansion or contraction of (CCG)n units may influence gene function. 5′UTRs and CDSs of genes contain the regulatory factors and CpG islands, it is likely that these motifs might regulate gene expression [68]. The (AAC)n and (AAT)n repeats relatively predominated in introns, TEs, and intergenic regions of these primates, which both outnumbered that of other trinucleotide repeats [17, 20]. These results suggested that amino acid repeats could happen in the coding sequences. It has reported that (Asn)n motif existed in mammalian proteins [69]. It is widely assumed that repeat copy number of amino acids are relatively within the normal range and may not affect the stability, structure, and function of the protein.
Materials and Methods
Genome sequences and genomic regions
We have sequenced the whole genome of FMD, completed the genomic assembly and annotation, and performed preliminary bioinformatic analyses. With the K-mer method supplied in GCE-1.0.0 [70], the genome size of FMD was estimated to be 2.72 Gb, which was similar to that of sheep (Ovis aries, 2.61 Gb) [71], of goat (Capra hircus, 2.66 Gb) [72], and Tibetan antelope (Pantholops hodgsonii, 2.75Gb) [73]. According to the calculated genome size, the clean data provided 130× average coverage. Collectively, the de novo genome assembly contained 2,143,175,501 contigs with a N50 contig size of 22.6 kb. Those contigs were then assembled to yield 1,114,025 scaffolds whose N50 size was 2.85Mb. The sequences of the gene models, 5′UTRs, CDSs, introns, 3′UTRs, TEs, and intergenic regions were generated according to the positions in the genome annotations. The intergenic regions referred to the interval sequences between gene and gene that were not included the introns, CDSs, UTRs, and other related sequences.
SSRs identification and investigation
As FMD had very large genomes, relatively systemic search criteria [74] were adopted in the study. In this study, repeats with unit patterns being circular permutations and/or reverse complements of each other were grouped together as one type for statistical analysis [75, 76]. For tetra- and hexanucleotide repeats, relatively systemic combination criteria were applied [10] in the process of filtration. To facilitate the comparison among different repeat categories or motifs, the term of relative abundance was used in the study (see the literatures: [74, 77]). SSRs were identified and scanned for 1-6 bp using the software MSDB (Microsatellite Search and Building Database) [74]. These total numbers have been normalized as relative abundance to allow comparison in the different genomic regions. In the four DNA bases, percentage of guanine (G) plus cytosine (C) was called GC-content in the analyzed sequence [17].
Development of polymorphism SSR markers
The flanking regions of microsatellites (200 bp either side) were extracted from the FMD genome in order to design the primer sets for the SSR loci identified. These extracted sequences were further manually scanned and filtered according to the criteria of SSRs identification as follows: (1) SSRs should be tetranucleotide repeats; (2) the number of repeats should be in the range of 7–15; (3) other criteria were used (see the previous report [78]). We used Primer 3 to design the primers to amplify the selected sequences [79]. The lengths of the primers designed in the present study were between 18 and 23 bp, with an expected product size between 190 and 450 bp. Amplification of these primers were tested in the FMD under the standard PCR conditions according to the change of annealing temperature of primer sequence. During optimization, we tested whether amplification was improved by the addition or decrease of MgCl2, or by a higher or lower annealing temperature. After optimization, the primers with single band of expected size in the amplification were selected to label with one of two fluorescent dyes (FAM, HEX) in the forward primers for fragment analysis on Applied Biosystems 3100 Genetic Analyzers. The blood DNA from 36 captive FMD was used to evaluate the ability of the primer pairs to amplify polymorphic bands. PCR amplifications were carried out in 25 μL reaction mixtures, and amplifications were performed using the standard PCR procedure [78]. For genotyping of SSR loci, the PCR amplification products were separated by capillary electrophoresis using a denaturing acrylamide gel matrix on an ABI PRISM 377 Genetic Analyser (Applied Biosystems) using GeneScan Tarmara 350 internal size standard (ABI). Alleles were detected using the GeneScan⁄Genotyper software package of Applied Biosystems. If the SSR markers had stutter peaks, they would be eliminated in this step. The ‘multi-tube procedure’ [80] was used to test the tendency for genotyping errors in these SSR loci.
Statistical analysis
Micro-Checker software [81] was used to estimate the presence of genotyping errors, such as null alleles, large allele dropout, or stuttering in the data set. The number of alleles (A), observed heterozygosity (HO), expected heterozygosity (HE), polymorphic information content (PIC), and the paternity test were calculated by using the software of CERVUS 3.0 [82]. Tests for deviations from the Hardy–Weinberg equilibrium (HWE) and linkage disequilibrium (LD) were performed using GENEPOP 3.4 [83]. Allelic richness (Ar) was calculated by using the FSTAT 2.9.3 program package [84]. Individual identification was analysed by CERVUS 3.0 [82]. In order to analyze the variation of repeat copy numbers (RCN) of different repeat type SSRs in the different genomic regions, we introduced the coefficient of variability (CV), which the calculation formula was as follow:
Availability of supporting data
The DNA sequences have been uploaded into the NCBI (GenBank accession numbers KT390284–KT390300; KT844392–KT844396).
Supplementary Materials
Acknowledgments
We thank Lianming Du and Chen Wang at Sichuan University for assisting the study, and Yuanyuan Zhang and Ping Li at Chongqing Three Gorges University for assisting the study. Natural Science Foundation of Chongqing (No. cstc2019jcyj-msxmX0410, cstc2019j cyj-msxmX0024), Postdoctoral Science Foundation (No.2017M612959), the Scientific and Technological Research Program of Chongqing Municipal Education Commission (No. KJ1710239), the Second Tibetan Plateau Scientific Expedition and Research Program (STEP, No.2019 QZKK0501), and National Natural Science Foundation (NSFC31702032, 81973428) of P. R. China.
Conflicts of Interest
The authors declare that they have no conflicts of interest.
References
- 1. He L, Wang WX, Li LH, Liu BQ, Liu G, Liu SQ, Qi L, Hu DF. Effects of crowding and sex on fecal cortisol levels of captive forest musk deer. Biol Res. 2014; 47:48. https://doi.org/10.1186/0717-6287-47-48 [PubMed]
- 2. Qi WH, Li J, Zhang XY, Wang ZK, Li XX, Yang CZ, Fu WL, Yue BS. The reproductive performance of female Forest musk deer (Moschus berezovskii) in captivity. Theriogenology. 2011; 76:874–81. https://doi.org/10.1016/j.theriogenology.2011.04.018 [PubMed]
- 3. Green MJ. The distribution, status and conservation of the Himalayan musk deer Moschus chrysogaster. Biol Conserv. 1986; 35:347–75. https://doi.org/10.1016/0006-3207(86)90094-7
- 4. Tautz D, Renz M. Simple sequences are ubiquitous repetitive components of eukaryotic genomes. Nucleic Acids Res. 1984; 12:4127–38. https://doi.org/10.1093/nar/12.10.4127 [PubMed]
- 5. Tóth G, Gáspári Z, Jurka J. Microsatellites in different eukaryotic genomes: survey and analysis. Genome Res. 2000; 10:967–81. https://doi.org/10.1101/gr.10.7.967 [PubMed]
- 6. Li B, Xia Q, Lu C, Zhou Z, Xiang Z. Analysis on frequency and density of microsatellites in coding sequences of several eukaryotic genomes. Genomics Proteomics Bioinformatics. 2004; 2:24–31. https://doi.org/10.1016/S1672-0229(04)02004-2 [PubMed]
- 7. Schlötterer C. The evolution of molecular markers—just a matter of fashion? Nat Rev Genet. 2004; 5:63–69. https://doi.org/10.1038/nrg1249 [PubMed]
- 8. Selkoe KA, Toonen RJ. Microsatellites for ecologists: a practical guide to using and evaluating microsatellite markers. Ecol Lett. 2006; 9:615–29. https://doi.org/10.1111/j.1461-0248.2006.00889.x [PubMed]
- 9. Zane L, Bargelloni L, Patarnello T. Strategies for microsatellite isolation: a review. Mol Ecol. 2002; 11:1–16. https://doi.org/10.1046/j.0962-1083.2001.01418.x [PubMed]
- 10. Qi WH, Jiang XM, Du LM, Xiao GS, Hu TZ, Yue BS, Quan QM. Genome-wide survey and analysis of microsatellite sequences in bovid species. PLoS One. 2015; 10:e0133667. https://doi.org/10.1371/journal.pone.0133667 [PubMed]
- 11. Li YC, Korol AB, Fahima T, Beiles A, Nevo E. Microsatellites: genomic distribution, putative functions and mutational mechanisms: a review. Mol Ecol. 2002; 11:2453–65. https://doi.org/10.1046/j.1365-294X.2002.01643.x [PubMed]
- 12. Zhang S, Tang C, Zhao Q, Li J, Yang L, Qie L, Fan X, Li L, Zhang N, Zhao M, Liu X, Chai Y, Zhang X, et al. Development of highly polymorphic simple sequence repeat markers using genome-wide microsatellite variant analysis in Foxtail millet [Setaria italica (L.) P. Beauv]. BMC Genomics. 2014; 15:78. https://doi.org/10.1186/1471-2164-15-78 [PubMed]
- 13. Guan TL, Zeng B, Peng QK, Yue BS, Zou FD. Microsatellite analysis of the genetic structure of captive forest musk deer populations and its implication for conservation. Biochem Syst Ecol. 2009; 37:166–73. https://doi.org/10.1016/j.bse.2009.04.001
- 14. Du L, Zhang C, Liu Q, Zhang X, Yue B, Hancock J. Krait: an ultrafast tool for genome-wide survey of microsatellites and primer design. Bioinformatics. 2018; 34:681–83. https://doi.org/10.1093/bioinformatics/btx665 [PubMed]
- 15. Parida SK, Verma M, Yadav SK, Ambawat S, Das S, Garg R, Jain M. Development of genome-wide informative simple sequence repeat markers for large-scale genotyping applications in chickpea and development of web resource. Front Plant Sci. 2015; 6:645. https://doi.org/10.3389/fpls.2015.00645 [PubMed]
- 16. Li WJ, Li YZ, Du LM, Huang J, Shen YM, Zhang XY, Yue BS. Comparative analysis of microsatellite sequences distribution in the genome of giant panda and polar bear. Sichuan Dong Wu. 2014; 33:874–78.
- 17. Qi WH, Yan CC, Li WJ, Jiang XM, Li GZ, Zhang XY, Hu TZ, Li J, Yue BS. Distinct patterns of simple sequence repeats and GC distribution in intragenic and intergenic regions of primate genomes. Aging (Albany NY). 2016; 8:2635–54. https://doi.org/10.18632/aging.101025 [PubMed]
- 18. Liu S, Hou W, Sun T, Xu Y, Li P, Yue B, Fan Z, Li J. Genome-wide mining and comparative analysis of microsatellites in three macaque species. Mol Genet Genomics. 2017; 292:537–50. https://doi.org/10.1007/s00438-017-1289-1 [PubMed]
- 19. Sharma PC, Grover A, Kahl G. Mining microsatellites in eukaryotic genomes. Trends Biotechnol. 2007; 25:490–98. https://doi.org/10.1016/j.tibtech.2007.07.013 [PubMed]
- 20. Subramanian S, Mishra RK, Singh L. Genome-wide analysis of microsatellite repeats in humans: their abundance and density in specific genomic regions. Genome Biol. 2003; 4:R13. https://doi.org/10.1186/gb-2003-4-2-r13 [PubMed]
- 21. Lawson MJ, Zhang L. Distinct patterns of SSR distribution in the Arabidopsis thaliana and rice genomes. Genome Biol. 2006; 7:R14. https://doi.org/10.1186/gb-2006-7-2-r14 [PubMed]
- 22. Wang Y, Chen M, Wang H, Wang JF, Bao D. Microsatellites in the genome of the edible mushroom, Volvariella volvacea. Biomed Res Int. 2014; 2014:281912. https://doi.org/10.1155/2014/281912 [PubMed]
- 23. Ramsay L, Macaulay M, Cardle L, Morgante M, degli Ivanissevich S, Maestri E, Powell W, Waugh R. Intimate association of microsatellite repeats with retrotransposons and other dispersed repetitive elements in barley. Plant J. 1999; 17:415–25. https://doi.org/10.1046/j.1365-313X.1999.00392.x [PubMed]
- 24. Arcot SS, Wang Z, Weber JL, Deininger PL, Batzer MA. Alu repeats: a source for the genesis of primate microsatellites. Genomics. 1995; 29:136–44. https://doi.org/10.1006/geno.1995.1224 [PubMed]
- 25. Zhu Y, Strassmann JE, Queller DC. Insertions, substitutions, and the origin of microsatellites. Genet Res. 2000; 76:227–36. https://doi.org/10.1017/S001667230000478X [PubMed]
- 26. Ellegren H. Microsatellites: simple sequences with complex evolution. Nat Rev Genet. 2004; 5:435–45. https://doi.org/10.1038/nrg1348 [PubMed]
- 27. Temnykh S, DeClerck G, Lukashova A, Lipovich L, Cartinhour S, McCouch S. Computational and experimental analysis of microsatellites in rice (Oryza sativa L.): frequency, length variation, transposon associations, and genetic marker potential. Genome Res. 2001; 11:1441–52. https://doi.org/10.1101/gr.184001 [PubMed]
- 28. Nadir E, Margalit H, Gallily T, Ben-Sasson SA. Microsatellite spreading in the human genome: evolutionary mechanisms and structural implications. Proc Natl Acad Sci USA. 1996; 93:6470–75. https://doi.org/10.1073/pnas.93.13.6470 [PubMed]
- 29. Schlötterer C. Evolutionary dynamics of microsatellite DNA. Chromosoma. 2000; 109:365–71. https://doi.org/10.1007/s004120000089 [PubMed]
- 30. Duval A, Hamelin R. Mutations at coding repeat sequences in mismatch repair-deficient human cancers: toward a new concept of target genes for instability. Cancer Res. 2002; 62:2447–54. [PubMed]
- 31. Vassileva V, Millar A, Briollais L, Chapman W, Bapat B. Genes involved in DNA repair are mutational targets in endometrial cancers with microsatellite instability. Cancer Res. 2002; 62:4095–99. [PubMed]
- 32. Markowitz S, Wang J, Myeroff L, Parsons R, Sun L, Lutterbaugh J, Fan RS, Zborowska E, Kinzler KW, Vogelstein B, et al. Inactivation of the type II TGF-beta receptor in colon cancer cells with microsatellite instability. Science. 1995; 268:1336–38. https://doi.org/10.1126/science.7761852 [PubMed]
- 33. Souza RF, Appel R, Yin J, Wang S, Smolinski KN, Abraham JM, Zou TT, Shi YQ, Lei J, Cottrell J, Cymes K, Biden K, Simms L, et al. Microsatellite instability in the insulin-like growth factor II receptor gene in gastrointestinal tumours. Nat Genet. 1996; 14:255–57. https://doi.org/10.1038/ng1196-255 [PubMed]
- 34. Duval A, Gayet J, Zhou XP, Iacopetta B, Thomas G, Hamelin R. Frequent frameshift mutations of the TCF-4 gene in colorectal cancers with microsatellite instability. Cancer Res. 1999; 59:4213–15. [PubMed]
- 35. Schwartz S
Jr , Yamamoto H, Navarro M, Maestro M, Reventós J, Perucho M. Frameshift mutations at mononucleotide repeats in caspase-5 and other target genes in endometrial and gastrointestinal cancer of the microsatellite mutator phenotype. Cancer Res. 1999; 59:2995–3002. [PubMed] - 36. Yamada T, Koyama T, Ohwada S, Tago K, Sakamoto I, Yoshimura S, Hamada K, Takeyoshi I, Morishita Y. Frameshift mutations in the MBD4/MED1 gene in primary gastric cancer with high-frequency microsatellite instability. Cancer Lett. 2002; 181:115–20. https://doi.org/10.1016/S0304-3835(02)00043-5 [PubMed]
- 37. Pearson CE, Sinden RR. Trinucleotide repeat DNA structures: dynamic mutations from dynamic DNA. Curr Opin Struct Biol. 1998; 8:321–30. https://doi.org/10.1016/S0959-440X(98)80065-1 [PubMed]
- 38. Richard GF, Pâques F. Mini- and microsatellite expansions: the recombination connection. EMBO Rep. 2000; 1:122–26. https://doi.org/10.1093/embo-reports/kvd031 [PubMed]
- 39. Cummings CJ, Zoghbi HY. Fourteen and counting: unraveling trinucleotide repeat diseases. Hum Mol Genet. 2000; 9:909–16. https://doi.org/10.1093/hmg/9.6.909 [PubMed]
- 40. Jin P, Warren ST. Understanding the molecular basis of fragile X syndrome. Hum Mol Genet. 2000; 9:901–08. https://doi.org/10.1093/hmg/9.6.901 [PubMed]
- 41. Sermon K, Seneca S, De Rycke M, Goossens V, Van de Velde H, De Vos A, Platteau P, Lissens W, Van Steirteghem A, Liebaers I. PGD in the lab for triplet repeat diseases - myotonic dystrophy, Huntington’s disease and Fragile-X syndrome. Mol Cell Endocrinol. 2001 (Suppl 1); 183:S77–85. https://doi.org/10.1016/S0303-7207(01)00572-X [PubMed]
- 42. Timchenko NA, Iakova P, Cai ZJ, Smith JR, Timchenko LT. Molecular basis for impaired muscle differentiation in myotonic dystrophy. Mol Cell Biol. 2001; 21:6927–38. https://doi.org/10.1128/MCB.21.20.6927-6938.2001 [PubMed]
- 43. Khajavi M, Tari AM, Patel NB, Tsuji K, Siwak DR, Meistrich ML, Terry NH, Ashizawa T. “Mitotic drive” of expanded CTG repeats in myotonic dystrophy type 1 (DM1). Hum Mol Genet. 2001; 10:855–63. https://doi.org/10.1093/hmg/10.8.855 [PubMed]
- 44. Kenneson A, Zhang F, Hagedorn CH, Warren ST. Reduced FMRP and increased FMR1 transcription is proportionally associated with CGG repeat number in intermediate-length and premutation carriers. Hum Mol Genet. 2001; 10:1449–54. https://doi.org/10.1093/hmg/10.14.1449 [PubMed]
- 45. Franke P, Leboyer M, Gänsicke M, Weiffenbach O, Biancalana V, Cornillet-Lefebre P, Croquette MF, Froster U, Schwab SG, Poustka F, Hautzinger M, Maier W. Genotype-phenotype relationship in female carriers of the premutation and full mutation of FMR-1. Psychiatry Res. 1998; 80:113–27. https://doi.org/10.1016/S0165-1781(98)00055-9 [PubMed]
- 46. Youings SA, Murray A, Dennis N, Ennis S, Lewis C, McKechnie N, Pound M, Sharrock A, Jacobs P. FRAXA and FRAXE: the results of a five year survey. J Med Genet. 2000; 37:415–21. https://doi.org/10.1136/jmg.37.6.415 [PubMed]
- 47. Allingham-Hawkins DJ, Babul-Hirji R, Chitayat D, Holden JJ, Yang KT, Lee C, Hudson R, Gorwill H, Nolin SL, Glicksman A, Jenkins EC, Brown WT, Howard-Peebles PN, et al. Fragile X premutation is a significant risk factor for premature ovarian failure: the International Collaborative POF in Fragile X study—preliminary data. Am J Med Genet. 1999; 83:322–25. https://doi.org/10.1002/(SICI)1096-8628(19990402)83:4<322::AID-AJMG17>3.0.CO;2-B [PubMed]
- 48. O’Hearn E, Holmes SE, Calvert PC, Ross CA, Margolis RL. SCA-12: tremor with cerebellar and cortical atrophy is associated with a CAG repeat expansion. Neurology. 2001; 56:299–303. https://doi.org/10.1212/WNL.56.3.299 [PubMed]
- 49. Ranum LP, Day JW. Dominantly inherited, non-coding microsatellite expansion disorders. Curr Opin Genet Dev. 2002; 12:266–71. https://doi.org/10.1016/S0959-437X(02)00297-6 [PubMed]
- 50. Koob MD, Moseley ML, Schut LJ, Benzow KA, Bird TD, Day JW, Ranum LP. An untranslated CTG expansion causes a novel form of spinocerebellar ataxia (SCA8). Nat Genet. 1999; 21:379–84. https://doi.org/10.1038/7710 [PubMed]
- 51. Tidow N, Boecker A, Schmidt H, Agelopoulos K, Boecker W, Buerger H, Brandt B. Distinct amplification of an untranslated regulatory sequence in the egfr gene contributes to early steps in breast cancer development. Cancer Res. 2003; 63:1172–78. [PubMed]
- 52. Ohshima K, Montermini L, Wells RD, Pandolfo M. Inhibitory effects of expanded GAA.TTC triplet repeats from intron I of the Friedreich ataxia gene on transcription and replication in vivo. J Biol Chem. 1998; 273:14588–95. https://doi.org/10.1074/jbc.273.23.14588 [PubMed]
- 53. Sakamoto N, Ohshima K, Montermini L, Pandolfo M, Wells RD. Sticky DNA, a self-associated complex formed at long GAA*TTC repeats in intron 1 of the frataxin gene, inhibits transcription. J Biol Chem. 2001; 276:27171–77. https://doi.org/10.1074/jbc.M101879200 [PubMed]
- 54. Matsuura T, Yamagata T, Burgess DL, Rasmussen A, Grewal RP, Watase K, Khajavi M, McCall AE, Davis CF, Zu L, Achari M, Pulst SM, Alonso E, et al. Large expansion of the ATTCT pentanucleotide repeat in spinocerebellar ataxia type 10. Nat Genet. 2000; 26:191–94. https://doi.org/10.1038/79911 [PubMed]
- 55. Zoghbi HY, Orr HT. Glutamine repeats and neurodegeneration. Annu Rev Neurosci. 2000; 23:217–47. https://doi.org/10.1146/annurev.neuro.23.1.217 [PubMed]
- 56. Galvão R, Mendes-Soares L, Câmara J, Jaco I, Carmo-Fonseca M. Triplet repeats, RNA secondary structure and toxic gain-of-function models for pathogenesis. Brain Res Bull. 2001; 56:191–201. https://doi.org/10.1016/S0361-9230(01)00651-7 [PubMed]
- 57. Katti MV, Ranjekar PK, Gupta VS. Differential distribution of simple sequence repeats in eukaryotic genome sequences. Mol Biol Evol. 2001; 18:1161–67. https://doi.org/10.1093/oxfordjournals.molbev.a003903 [PubMed]
- 58. Gur-Arie R, Cohen CJ, Eitan Y, Shelef L, Hallerman EM, Kashi Y. Simple sequence repeats in Escherichia coli: abundance, distribution, composition, and polymorphism. Genome Res. 2000; 10:62–71. [PubMed]
- 59. Li S, Zhang X, Yin T. Characteristics of microsatellites in the transcript sequences of the Laccaria bicolor genome. J Microbiol Biotechnol. 2010; 20:474–79. [PubMed]
- 60. Fujimori S, Washio T, Higo K, Ohtomo Y, Murakami K, Matsubara K, Kawai J, Carninci P, Hayashizaki Y, Kikuchi S, Tomita M. A novel feature of microsatellites in plants: a distribution gradient along the direction of transcription. FEBS Lett. 2003; 554:17–22. https://doi.org/10.1016/S0014-5793(03)01041-X [PubMed]
- 61. Wren JD, Forgacs E, Fondon JW
3rd , Pertsemlidis A, Cheng SY, Gallardo T, Williams RS, Shohet RV, Minna JD, Garner HR. Repeat polymorphisms within gene regions: phenotypic and evolutionary implications. Am J Hum Genet. 2000; 67:345–56. https://doi.org/10.1086/303013 [PubMed] - 62. Cordeiro GM, Casu R, McIntyre CL, Manners JM, Henry RJ. Microsatellite markers from sugarcane (Saccharum spp.) ESTs cross transferable to erianthus and sorghum. Plant Sci. 2001; 160:1115–23. https://doi.org/10.1016/S0168-9452(01)00365-X [PubMed]
- 63. Mar Albà M, Santibáñez-Koref MF, Hancock JM. Amino acid reiterations in yeast are overrepresented in particular classes of proteins and show evidence of a slippage-like mutational process. J Mol Evol. 1999; 49:789–97. https://doi.org/10.1007/PL00006601 [PubMed]
- 64. Li YC, Korol AB, Fahima T, Nevo E. Microsatellites within genes: structure, function, and evolution. Mol Biol Evol. 2004; 21:991–1007. https://doi.org/10.1093/molbev/msh073 [PubMed]
- 65. Liu F, Lu J, Hu W, Wang SY, Cui SJ, Chi M, Yan Q, Wang XR, Song HD, Xu XN, Wang JJ, Zhang XL, Zhang X, et al. New perspectives on host-parasite interplay by comparative transcriptomic and proteomic analyses of Schistosoma japonicum. PLoS Pathog. 2006; 2:e29. https://doi.org/10.1371/journal.ppat.0020029 [PubMed]
- 66. Olivero M, Ruggiero T, Coltella N, Maffe’ A, Calogero R, Medico E, Di Renzo MF. Amplification of repeat-containing transcribed sequences (ARTS): a transcriptome fingerprinting strategy to detect functionally relevant microsatellite mutations in cancer. Nucleic Acids Res. 2003; 31:e33. https://doi.org/10.1093/nar/gng033 [PubMed]
- 67. Borštnik B, Pumpernik D. Tandem repeats in protein coding regions of primate genes. Genome Res. 2002; 12:909–15. https://doi.org/10.1101/gr.138802 [PubMed]
- 68. Subramanian S, Madgula VM, George R, Mishra RK, Pandit MW, Kumar CS, Singh L. Triplet repeats in human genome: distribution and their association with genes and other genomic regions. Bioinformatics. 2003; 19:549–52. https://doi.org/10.1093/bioinformatics/btg029 [PubMed]
- 69. Kreil DP, Kreil G. Asparagine repeats are rare in mammalian proteins. Trends Biochem Sci. 2000; 25:270–71. https://doi.org/10.1016/S0968-0004(00)01594-2 [PubMed]
- 70. Liu B, Shi Y, Yuan J, Hu X, Zhang H, Li N, Li Z, Chen Y, Mu D, Fan W. 2013. Estimation of genomic characteristics by analyzing k-mer frequency in de novo genome projects. https://arxiv.org/abs/1308.2012.
- 71. Jiang Y, Xie M, Chen W, Talbot R, Maddox JF, Faraut T, Wu C, Muzny DM, Li Y, Zhang W, Stanton JA, Brauning R, Barris WC, et al. The sheep genome illuminates biology of the rumen and lipid metabolism. Science. 2014; 344:1168–73. https://doi.org/10.1126/science.1252806 [PubMed]
- 72. Dong Y, Xie M, Jiang Y, Xiao N, Du X, Zhang W, Tosser-Klopp G, Wang J, Yang S, Liang J, Chen W, Chen J, Zeng P, et al. Sequencing and automated whole-genome optical mapping of the genome of a domestic goat (Capra hircus). Nat Biotechnol. 2013; 31:135–41. https://doi.org/10.1038/nbt.2478 [PubMed]
- 73. Ge RL, Cai Q, Shen YY, San A, Ma L, Zhang Y, Yi X, Chen Y, Yang L, Huang Y, He R, Hui Y, Hao M, et al. Draft genome sequence of the Tibetan antelope. Nat Commun. 2013; 4:1858. https://doi.org/10.1038/ncomms2860 [PubMed]
- 74. Du L, Li Y, Zhang X, Yue B. MSDB: a user-friendly program for reporting distribution and building databases of microsatellites from genome sequences. J Hered. 2013; 104:154–57. https://doi.org/10.1093/jhered/ess082 [PubMed]
- 75. Jurka J, Pethiyagoda C. Simple repetitive DNA sequences from primates: compilation and analysis. J Mol Evol. 1995; 40:120–26. https://doi.org/10.1007/BF00167107 [PubMed]
- 76. Li CY, Liu L, Yang J, Li JB, Su Y, Zhang Y, Wang YY, Zhu YY. Genome-wide analysis of microsatellite sequence in seven filamentous fungi. Interdiscip Sci. 2009; 1:141–50. https://doi.org/10.1007/s12539-009-0014-5 [PubMed]
- 77. Karaoglu H, Lee CM, Meyer W. Survey of simple sequence repeats in completed fungal genomes. Mol Biol Evol. 2005; 22:639–49. https://doi.org/10.1093/molbev/msi057 [PubMed]
- 78. Huang J, Li YZ, Du LM, Yang B, Shen FJ, Zhang HM, Zhang ZH, Zhang XY, Yue BS. Genome-wide survey and analysis of microsatellites in giant panda (Ailuropoda melanoleuca), with a focus on the applications of a novel microsatellite marker system. BMC Genomics. 2015; 16:61. https://doi.org/10.1186/s12864-015-1268-z [PubMed]
- 79. Koressaar T, Remm M. Enhancements and modifications of primer design program Primer3. Bioinformatics. 2007; 23:1289–91. https://doi.org/10.1093/bioinformatics/btm091 [PubMed]
- 80. Taberlet P, Griffin S, Goossens B, Questiau S, Manceau V, Escaravage N, Waits LP, Bouvet J. Reliable genotyping of samples with very low DNA quantities using PCR. Nucleic Acids Res. 1996; 24:3189–94. https://doi.org/10.1093/nar/24.16.3189 [PubMed]
- 81. Van Oosterhout C, Hutchinson WF, Wills DP, Shipley P. MICRO-CHECKER: software for identifying and correcting genotyping errors in microsatellite data. Mol Ecol Resour. 2004; 4:535–38. https://doi.org/10.1111/j.1471-8286.2004.00684.x
- 82. Marshall TC, Slate J, Kruuk LE, Pemberton JM. Statistical confidence for likelihood-based paternity inference in natural populations. Mol Ecol. 1998; 7:639–55. https://doi.org/10.1046/j.1365-294x.1998.00374.x [PubMed]
- 83. Raymond M, Rousset F. GENEPOP (version 1.2): population genetics software for exact tests and ecumenicism. J Hered. 1995; 86:248–49. https://doi.org/10.1093/oxfordjournals.jhered.a111573
- 84. Goudet J. 2001. FSTAT: a program to estimate and test gene diversities and fixation indices (version 2.9.3). Lausanne University, Lausanne, Switzerland. https://www2.unil.ch/popgen/softwares/fstat.htm.