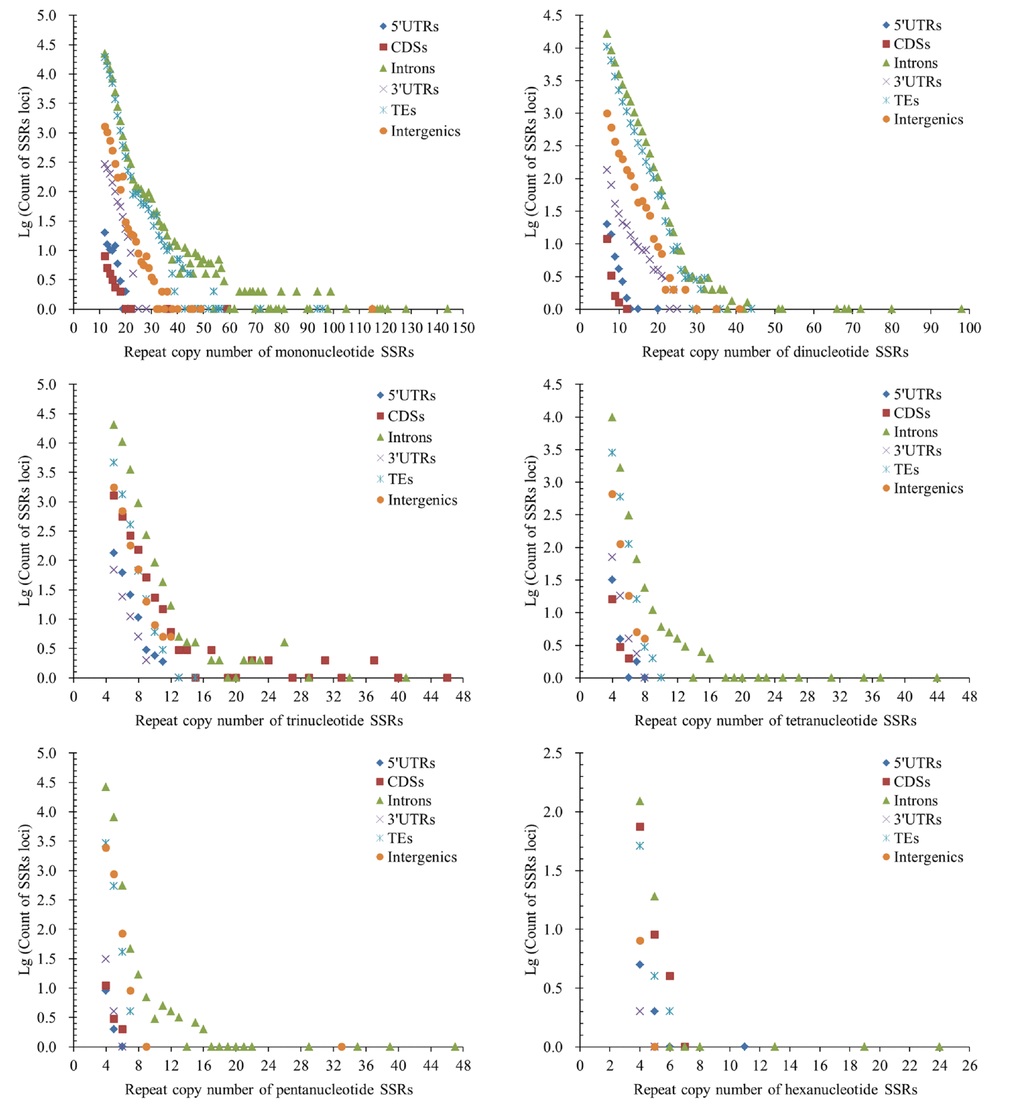
Figure 4.Comparative analysis of repeat copy number (RCN) of mono- to hexanucleotide P-SSRs in different genomic regions of FMD genome.
Figure 4 — Distribution patterns of microsatellites and development of its marker in different genomic regions of forest musk deer genome based on high throughput sequencing | Aging