


Introduction
Aging is an irreversible process affecting all higher organisms, characterized by progressive deterioration leading to a loss of function of cells, tissues, organs and finally death. Cellular aging can be accelerated by using non-lethal stresses; this phenomenon is referred to as stress induced premature senescence (SIPS). The concept of SIPS was first introduced in 2000 by Dr. Olivier Toussaint and co-workers [1, 2]. Premature aging of cultured cells is usually associated with the exposure of cells to environmental stress factors. Stress induced premature senescence can be defined as the long-term effect of sub-cytotoxic stress on proliferative cell types including appearance of many features of replicative senescence. Various genotoxic agents, such as hydrogen peroxide (H2O2), tert-butyl hydroperoxide, copper sulfate, diperoxovanadate, ethanol, mitomycin C, other cytostatic drugs, heat shock or UV radiation are well-established inducers of SIPS. It has been suggested that SIPS can be used in toxicology to identify xenobiotics that may induce premature senescence. In each case, oxidative stress is believed to be the major cause of SIPS program activation in normal cells [2–6].
Up to now, among other stressors, H2O2 is perhaps the best candidate for inducing senescence, because an H2O2-induced process might mimic the oxidative environment that may occur in vivo [2, 7, 8]. Addition of a single bolus of H2O2 to cultured cells means a rather short exposure to an external reactive oxygen species (ROS), which is rapidly decomposed [9, 10]. Hydrogen peroxide, which is plasma membrane permeable, may produce hydroxyl radical (·OH) in the presence of Fe2+ or Cu2+ through the Fenton reaction. Hydroxyl radical and the superoxide anion radical (O2·-) oxidize the unsaturated bonds of lipids to yield lipid peroxides as well as aldehydes such as 4-hydroxynonenal. Hydroxyl radical and lipid-derived aldehydes react with amino acid residues in proteins to produce carbonyl proteins [11] and modify nucleic acid bases [12]. Moreover, sublethal oxidative stress was shown to arrest proliferation and promote accumulation of senescence-associated molecular hallmarks [increased activity of cyclin-dependent kinase inhibitor p21Waf1/Cip1 (p21) and of acidic β-galactosidase (SA-β-gal), as well as diminution of phosphorylated retinoblastoma gene product (ppRb)] in human fibroblasts [13].
The causative role of oxidative stress in SIPS is well established [2–6, 14]. Nevertheless, it is of interest whether ROS play a role in secondary signaling leading to SIPS-induced cell death or if the execution of SIPS depends on the molecular machinery once triggered by oxidative stress and secondary production of ROS after initial oxidative stress is not important. One way to get an insight into this question is to examine the effect of antioxidants on human fibroblasts {on two human fibroblast lines (lung MRC-5 and H8F2p25LM fibroblasts, obtained from ear skin of an adult donor)} after H2O2 exposure and decomposition on the SIPS, which was the aim of this study. Our results speak for the second possibility.
Results
Hydrogen peroxide sensitivity of fibroblasts
Hydrogen peroxide showed a dose-dependent cytotoxicity against normal human fibroblast line [MRC-5 (CCL-171)] obtained from lung and primary human fibroblast line [H8F2p25LM] obtained from ear skin of an adult donor (Figure 1A, 1B). The cell lines differed considerably in the sensitivity to H2O2, with IC50 values of 528 and 33.5 μM for MRC-5 and H8F2p25LM fibroblasts, respectively, when estimated after 24 h. The more resistant MRC-5 cells more rapidly decomposed H2O2 than H8F2p25LM fibroblasts, the half-life times of 50 μM H2O2 in the presence of 5 x 10³ cells being 8.8 minutes for MRC-5 cells and 61.5 minutes for H8F2p25LM cells (Figure 2A, 2B). This difference was mainly due to different catalase activity, which was about 11 times higher in MRC-5 cells than in H8F2p25LM cells (28.03 and 2.56 μmol H2O2/(s*106 cells), respectively).
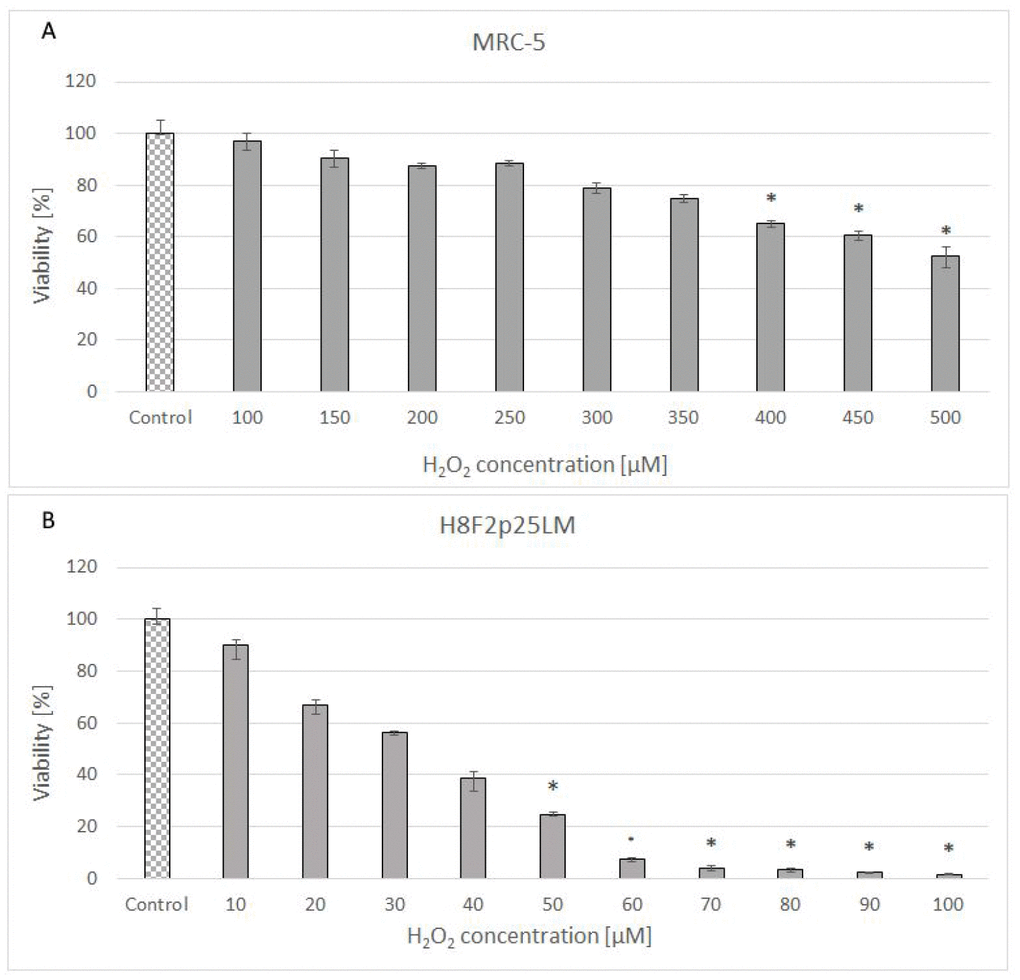
Figure 1. Viability of MRC-5 (A) and H8F2p25LM (B) cells after 24 h treatment with hydrogen peroxide at different concentrations estimated by Neutral Red assay. *P<0.05, Kruskal-Wallis test (against non-treated control).
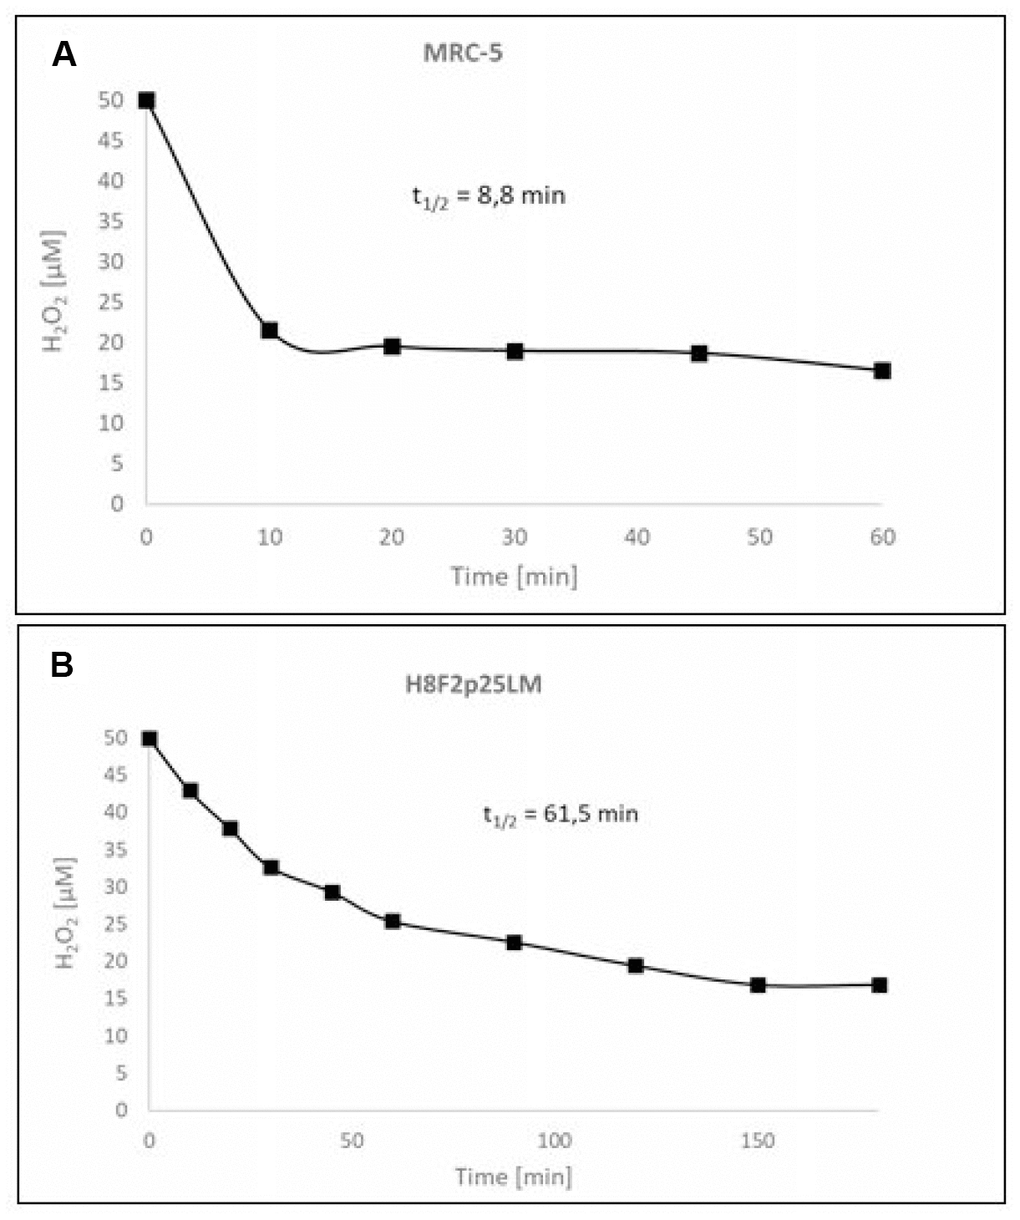
Figure 2. Kinetics of the decomposition of hydrogen peroxide by MRC-5 (A) and H8F2p25LM (B) cells.
Protection of fibroblasts against the H2O2-induced cytotoxicity
24 hours after H2O2 treatment, antioxidants were added to the cells to study their effects on the processes dependent on secondary oxidant-dependent signaling leading to decrease in cell survival. The antioxidants were first checked for their cytotoxicity (data for 4 chosen antioxidants are shown in Figure 3A and 3B) and used at non-toxic concentrations. Among the antioxidants tested, 2 μM 4-amino-TEMPO, 10 μM TEMPOL, 2-10 μM gallic acid, 10 μM caffeic acid, 50-100 μM aminoguanidine hydrochloride, 1 μM curcumin,5-100 μM oleuropein, 100 μM melatonin as well as 20-50 μM p-coumaric acid augmented the survival of MRC-5 cells, while 50-100 μM TEMPO, 10 μM 4-amino-TEMPO, 2 μM caffeic acid, 1 μM curcumin, 5 μM ethoxyquin, 20-100 μM p-coumaric acid and 50 μM ferulic acid increased the survival of H8F2p25LM cells after treatment with hydrogen peroxide (Figures 4A–4D and 5A–5D). On this basis, 4 compounds showing some protection of both cell lines were chosen for further experiments (data for only these compounds are shown in Figures 4A–4D and 5A–5D).
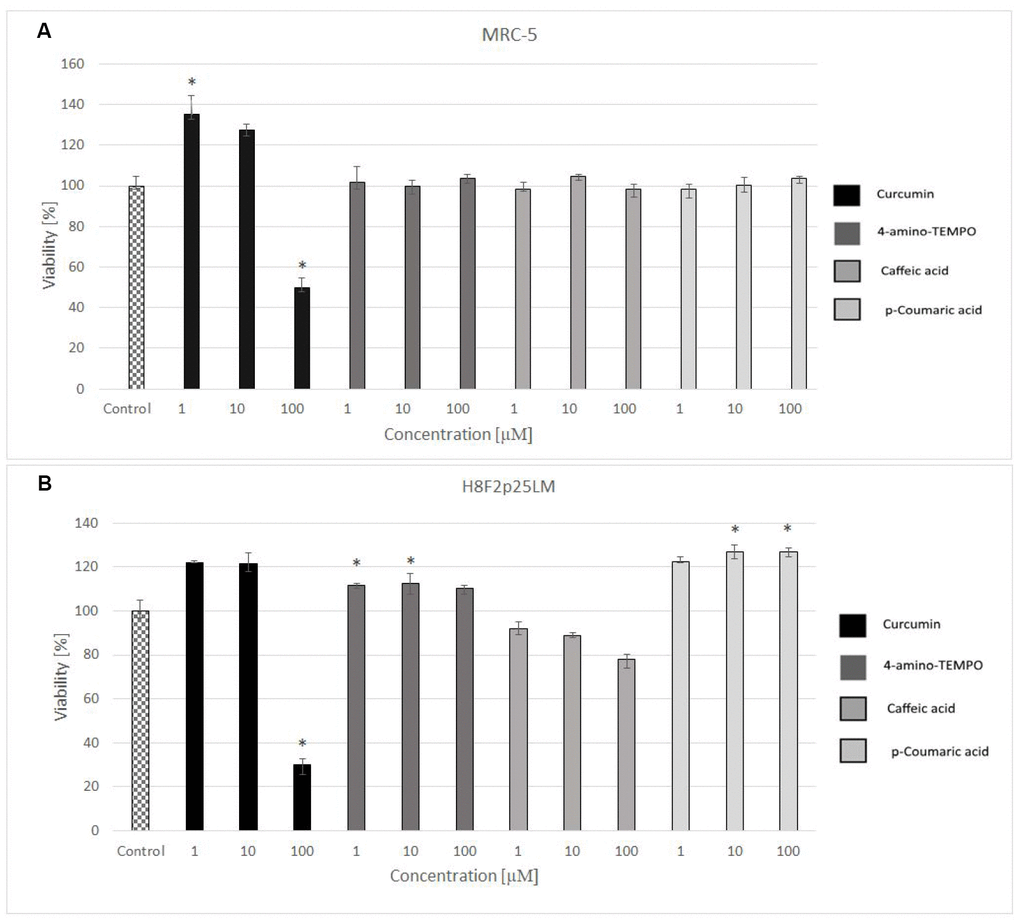
Figure 3. Viability of MRC-5 (A) and H8F2p25LM (B) cells after 24 h treatment with selected antioxidants (1, 10 and 100 μM), estimated by Neutral Red assay. *P<0.05, Kruskal-Wallis test (against non-treated control).
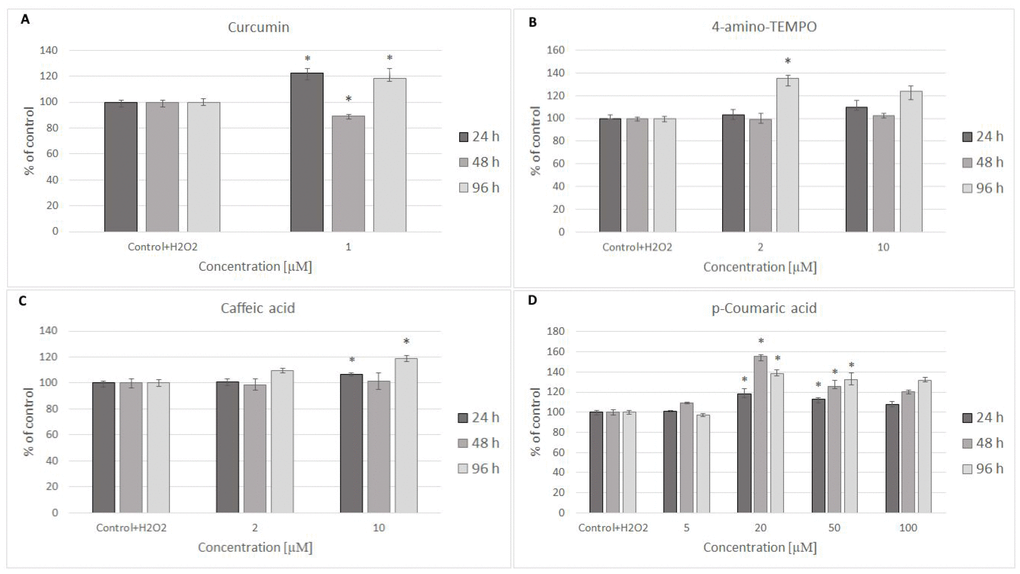
Figure 4. MRC-5 cell survival after 24 h treatment with 600 μM hydrogen peroxide and then 24 h, 48 h and 96 h posttreatment with different concentrations of curcumin (A), 4-amino-TEMPO (B), caffeic acid (C) and p-coumaric acid (D). *P<0.05, Kruskal-Wallis test (against control containing H2O2).
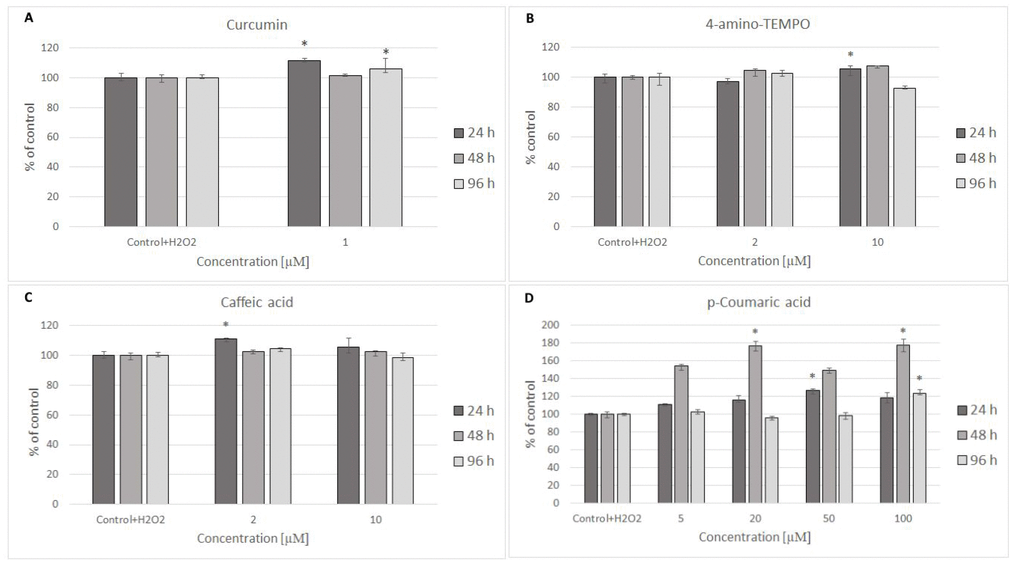
Figure 5. H8F2p25LM cell survival after 24 h treatment with 35 μM hydrogen peroxide and then 24 h, 48 h, 96 h posttreatment with different concentrations of curcumin (A), 4-amino-TEMPO (B), caffeic acid (C) and p-coumaric acid (D). *P<0.05, Kruskal-Wallis test (against control containing H2O2).
Hydrogen peroxide generation by the antioxidants studied
We compared generation of hydrogen peroxide by the antioxidant compounds used in this study during incubation in the culture medium. Some of these compounds generated significant amounts of hydrogen peroxide (gallic acid > caffeic acid > oleuropein), which represents a pro-oxidant effect of these antioxidants. No detectable H2O2 generation was found for 4-hydroxy-TEMPO, 4-amino-TEMPO, TEMPO, curcumin, resveratrol, ethoxyquin, melatonin, ferulic acid, p-coumaric acid and aminoguanidine hydrochloride (Table 1). Both H2O2-generating compounds (caffeic acid, oleuropein) and compounds which did not produce H2O2 in the culture media offered small post-exposure protection against the effects of H2O2.
Table 1. Generation of hydrogen peroxide in DMEM/ DMEM + glutaMAX medium [(mean ± SD; n≥3 (independent samples)].
| Compound | HzO2 [μM] | ||||||||||||||||||||||||||||||||||||||||||||||||||||||||||||||||||||||||||||||||||||||||||||||||||
| DMEM | DMEM + glutaMAX | ||||||||||||||||||||||||||||||||||||||||||||||||||||||||||||||||||||||||||||||||||||||||||||||||||
| Gallic acid | 77.95±1.47 | 124.66 ± 5.41*** | |||||||||||||||||||||||||||||||||||||||||||||||||||||||||||||||||||||||||||||||||||||||||||||||||
| Caffeic acid | 68.04±3.25 | 96.10 ± 3.71*** | |||||||||||||||||||||||||||||||||||||||||||||||||||||||||||||||||||||||||||||||||||||||||||||||||
| Oleuropein | 64.87±1.63 | 81.42 ± 7.22* | |||||||||||||||||||||||||||||||||||||||||||||||||||||||||||||||||||||||||||||||||||||||||||||||||
| Aminoguanidine chloride | 0 | 4.52 ± 1.75* | |||||||||||||||||||||||||||||||||||||||||||||||||||||||||||||||||||||||||||||||||||||||||||||||||
| The following substances did not produce detectable amounts of H2O2: curcumin, resveratrol, ethoxyquin, melatonin, ferulic acid, p-coumaric acid, TEMPO,4-hydroxy-TEMPO and 4-amino-TEMPO. Statistical significance of differences between generation of hydrogen peroxide in DMEM and DMEM + glutaMAX medium: *P < 0.05, **P < 0.01, ***P < 0.001. | |||||||||||||||||||||||||||||||||||||||||||||||||||||||||||||||||||||||||||||||||||||||||||||||||||
Glutathione content
Treatment with hydrogen peroxide decreased the content of reduced glutathione (GSH) in MRC-5 fibroblasts and did not cause a statistically significant decrease of GSH level in H8F2p25LM cells (although a tendency for decrease was visible; Figure 6A, 6B). Posttreatment exposure to the chosen antioxidants did not augment the GSH level with respect to cells treated with H2O2 only, while 4-amino-TEMPO and 50 μM p-coumaric acid evoked a further GSH depletion in H8F2p25 LM cells (Figure 6B).
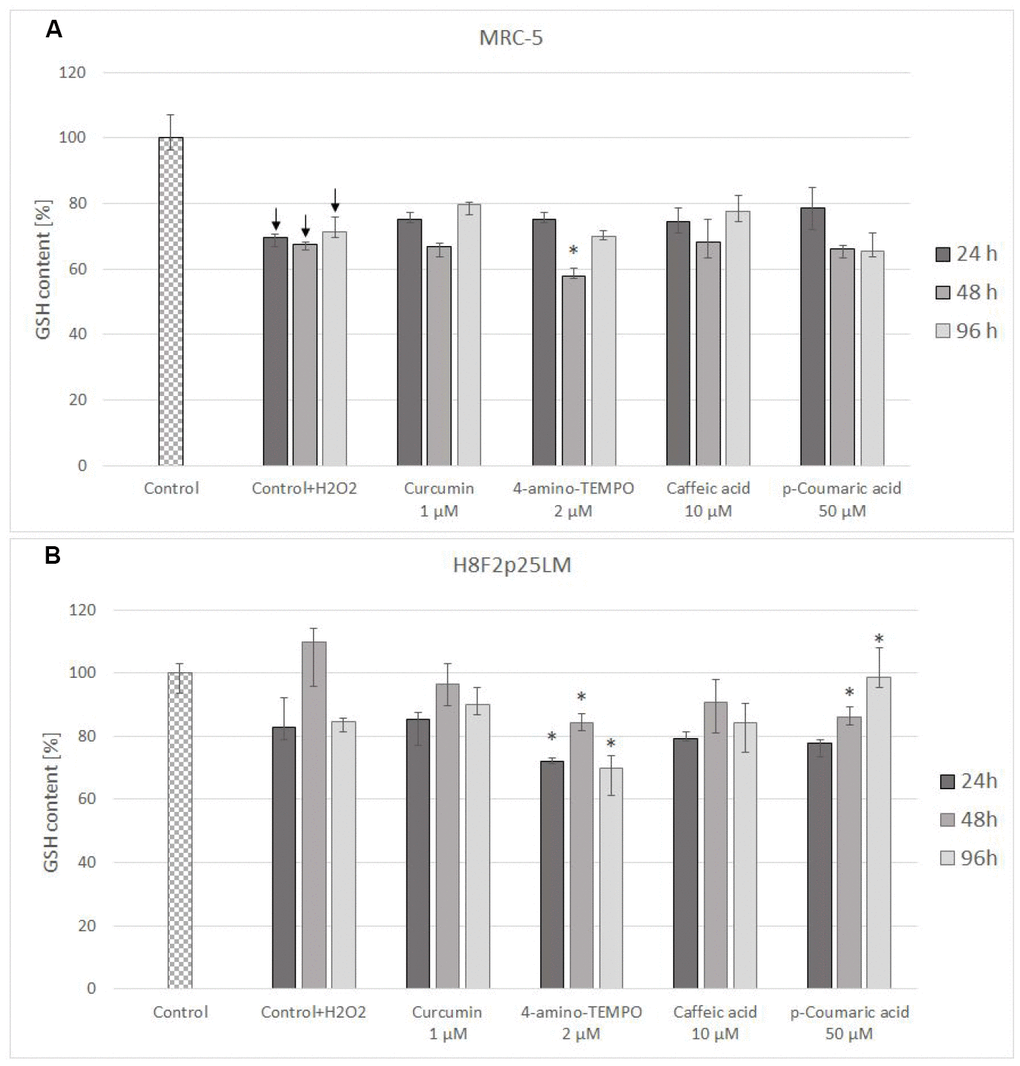
Figure 6. GSH content in MRC-5 (A) and H8F2p25LM (B) cells after 24 h treatment with hydrogen peroxide and 24 h, 48 h, 96 h posttreatment with selected concentrations of antioxidants. *P<0.05, Kruskal-Wallis test (against control treated only with H2O2) ↓ differences between treated and non-treated control.
Reactive oxygen species
The level of reactive oxygen species (ROS) estimated with H2DCF-DA decreased in H2O2-treated cells after next 24 h following the day of exposure and then increased gradually, exceeding the control level in H8F2p25LM cells. Posttreatment with antioxidants induced a small decrease in the ROS level in the majority of cases (Figure 7A, 7B).
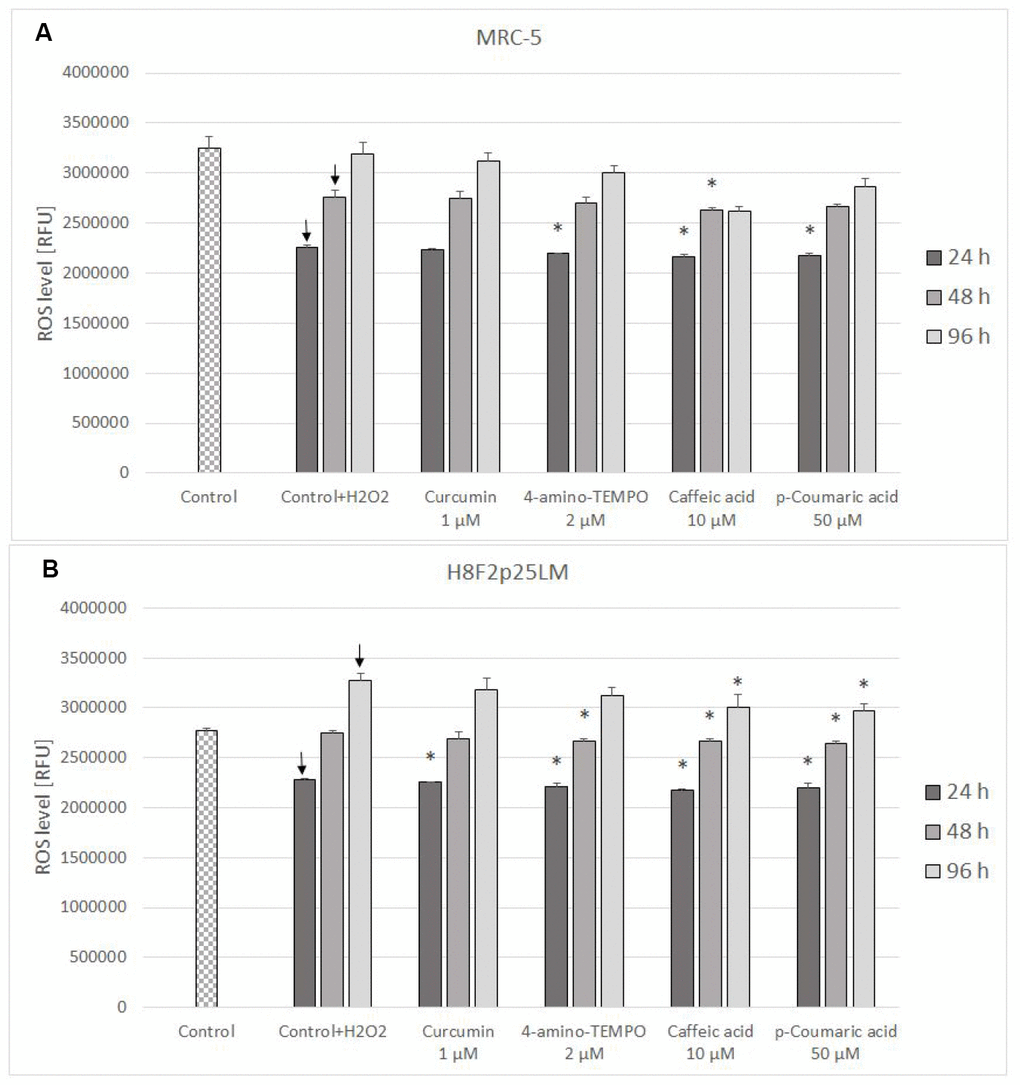
Figure 7. ROS level (estimated with H2DCFDA) in MRC-5 (A) and H8F2p25LM (B) cells after 24 h treatment with hydrogen peroxide and 24 h, 48 h, 96 h posttreatment with selected concentrations of antioxidants. * P≤0.05, t-Student test against H2O2 treated control; ↓ differences between treated and non-treated control.
The level of mitochondrial superoxide decreased in H2O2-treated cells and was not significantly affected by antioxidant posttreatment (Figure 8A, 8B).
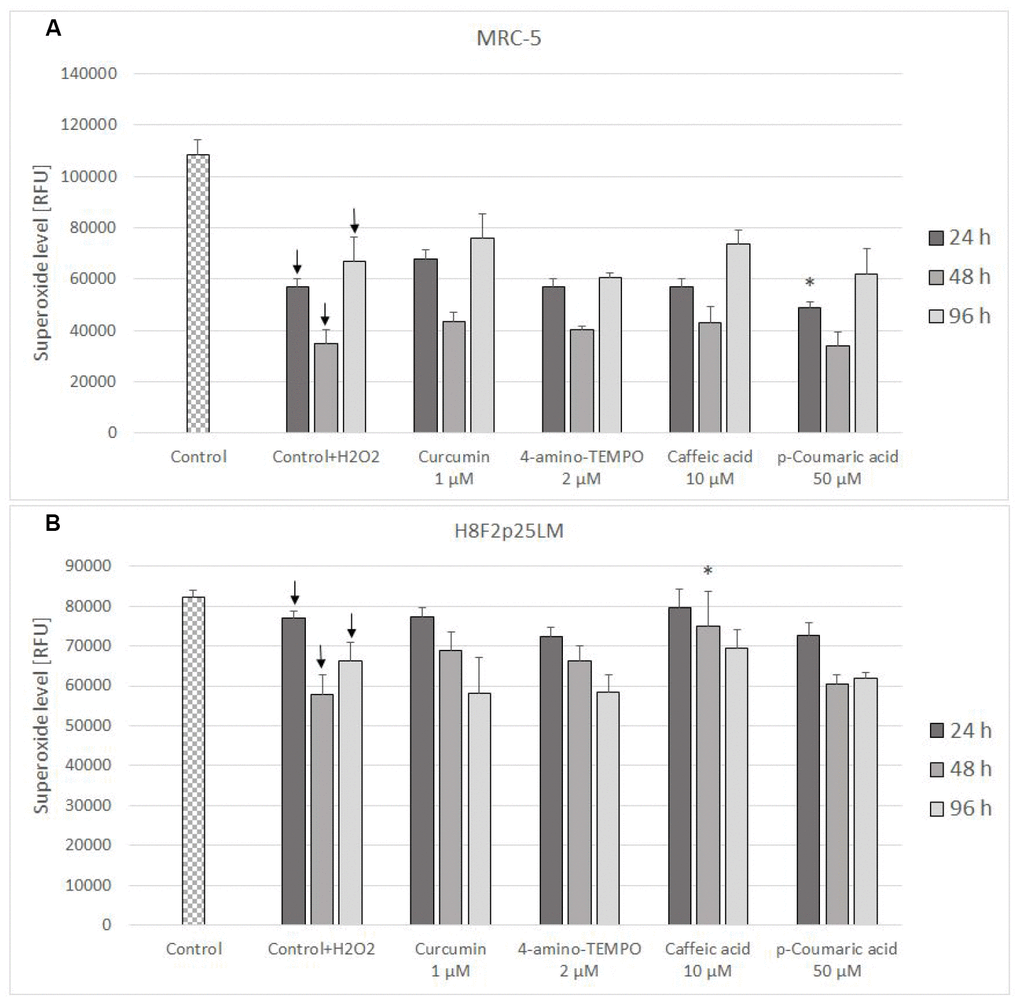
Figure 8. Mitochondrial superoxide level in MRC-5 (A) and H8F2p25LM (B) cells after 24 h treatment with hydrogen peroxide and 24 h, 48 h, 96 h posttreatment with selected concentrations of antioxidants. * P≤0.05 t-Student test against H2O2 treated control; ↓ differences between treated and non-treated control.
Mitochondrial membrane potential and mitochondrial mass
Estimation of changes in mitochondrial membrane potential (Δψm) by JC-1 staining of cells demonstrated that the mitochondrial membrane potential was significantly reduced in H2O2 treated cells [in subsequent times after pretreatment: 24 h, 48 h and 96 h in H8F2p25LM cells and after 48 h as well as 96 h in MRC-5 cells; Figure 9A, 9B]. Only 4-amino-TEMPO after 24 h as well as 48 h, caffeic acid and p-coumaric acid after 24 h, respectively, showed some preventive effect in H8F2p25LM cell line. No effects of antioxidants on Δψm were seen in MRC-5 cells.
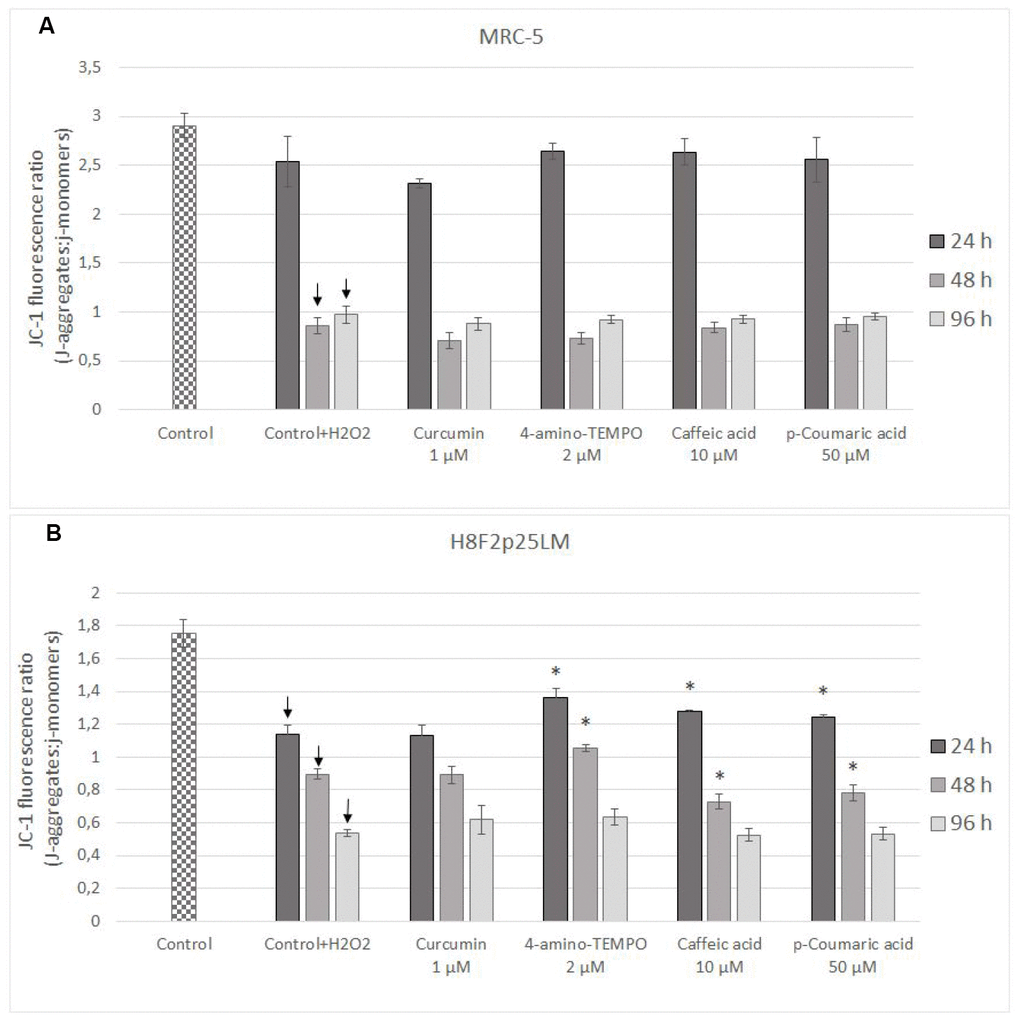
Figure 9. Changes in MRC-5 (A) and H8F2p25LM (B) cell mitochondrial potential after 24 h treatment with hydrogen peroxide and 24, h 48 h, 96 h posttreatment with selected concentrations of antioxidants. * P≤0.05 t-Student test against H2O2 treated control. ↓ differences between treated and non-treated control.
Mitochondrial mass decreased in H2O2-treated MRC-5 cells (Figure 10A), but increased (except for the time of 48 h) in H8F2p25LM cells following H2O2 treatment (Figure 10B). Antioxidants were generally protective against these changes, except for curcumin after 24 h and 96 h and p-coumaric acid after 24 h in MRC-5 cells (Figure 10A), and 4-amino-TEMPO as well as caffeic acid after 24 h in H8F2p25LM cells(Figure 10B).
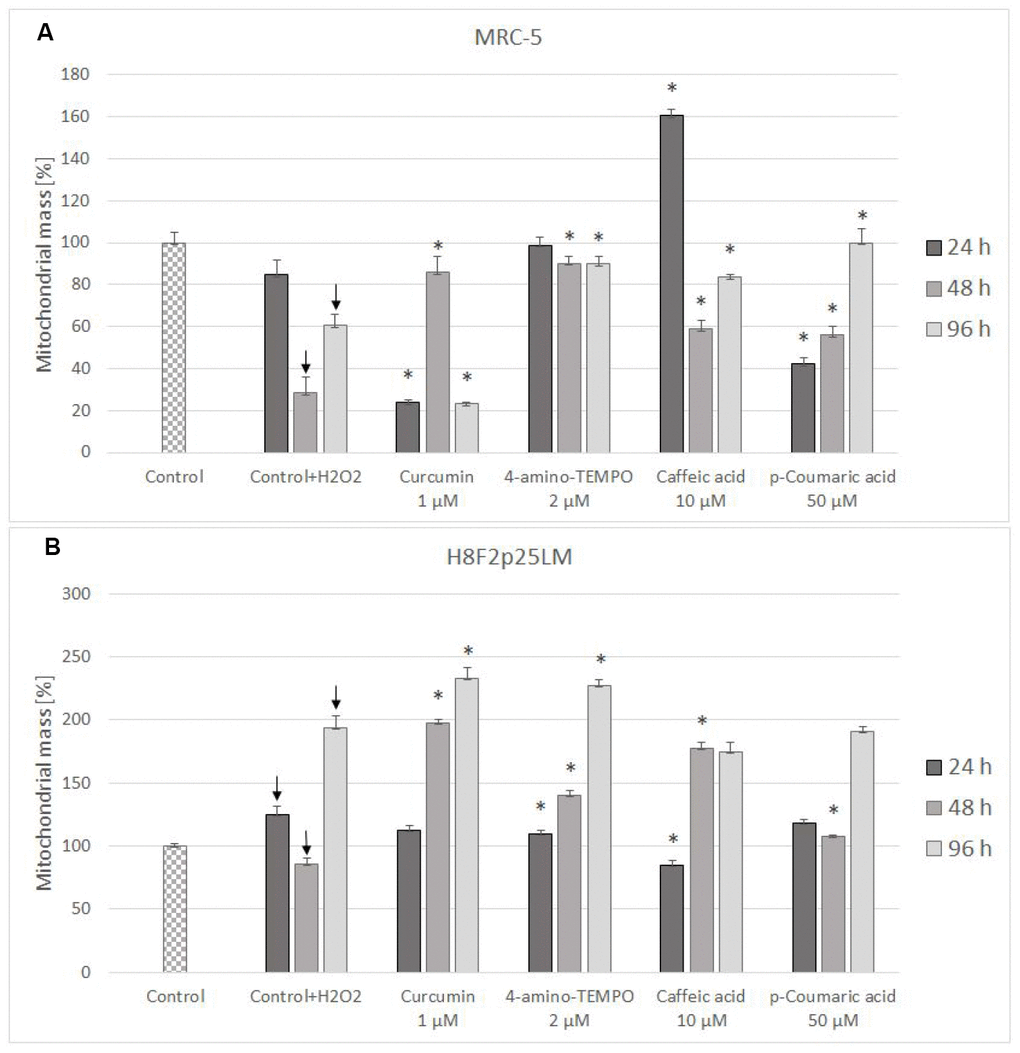
Figure 10. Changes in MRC-5 (A) and H8F2p25LM (B) cell mitochondrial mass after 24 h treatment with hydrogen peroxide and 24 h, 48 h, 96 h posttreatment with selected concentrations of antioxidants. * P≤0.05, t-Student test against H2O2 treated control; ↓ differences between treated and non-treated control.
Senescence-associated β-galactosidase
Staining for acidic β-galactosidase activity showed a gradual increase in the staining of H2O2-treated MRC-5 cells, which was not significantly affected by treatment with antioxidants. In H8F2p25LM cells, the staining was not increasing after 48 h and even decreased after 96 h. Again, no significant effects of the antioxidants was evident (Figure 11A, 11B).
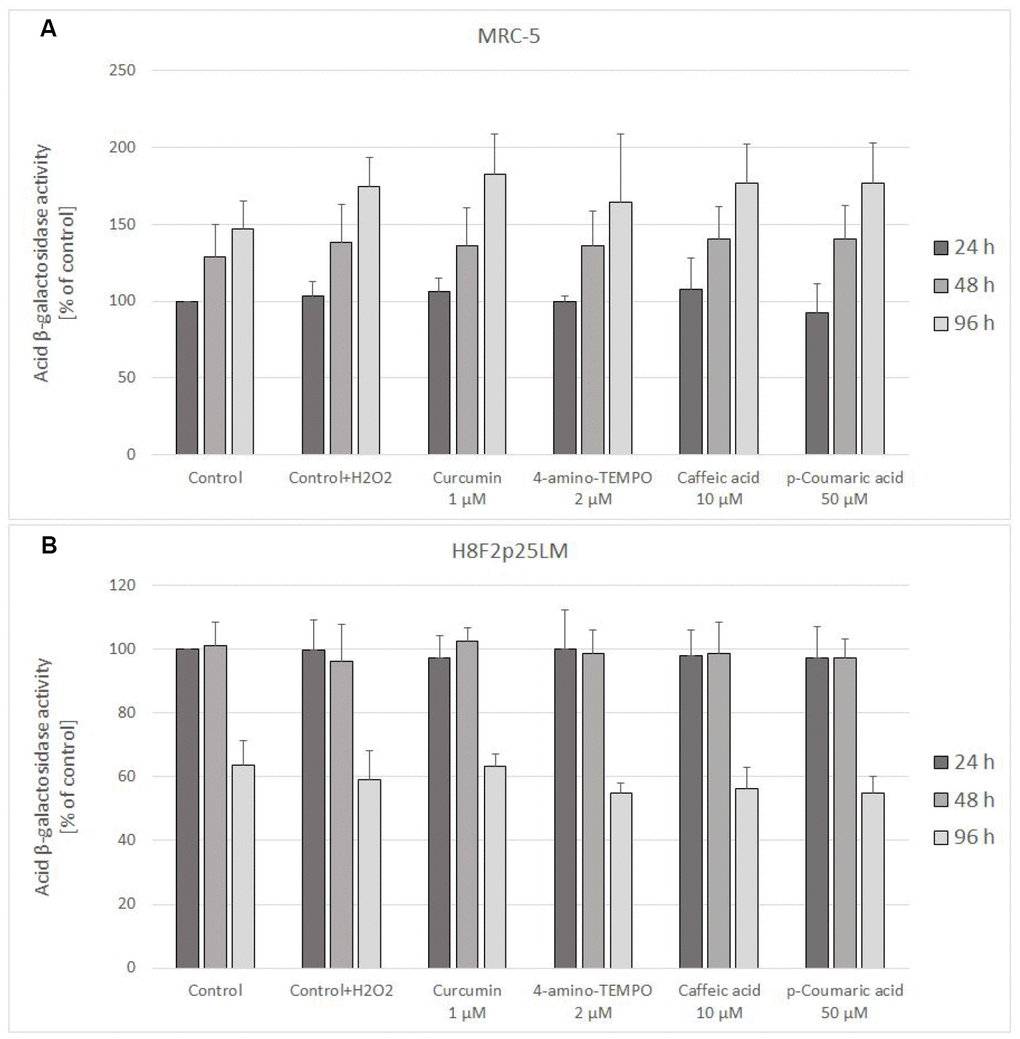
Figure 11. Senescence-associated β-galactosidase activity in MRC-5 (A) and H8F2p25LM (B) cells treated with hydrogen peroxide and posttreated with investigated compounds. Fluorescence value of control samples at 24-hour time point was considered 100% for each series. Data are presented as mean ± SD of 6 (MRC-5) or 2 (H8F2p25LM) independent experiments.
Discussion
Dermal fibroblasts are long lived cells undergoing age-associated damage accumulation underlying the age-related changes in the skin. Skin wrinkles and sagging are important factors defining skin aging. Fibroblasts play a main role in the production of extracellular matrix components in the skin. Skin aging is the consequence of reduced numbers of fibroblasts, decreased skin elasticity and tonus as well as lower levels of extracellular matrix proteins, thus resulting in the formation of wrinkles [11, 15]. Fibroblasts play also a role in the accelerated aging of the skin induced by UV radiation and other environmental factors [16–17].
Fibroblasts are also model cells in studies of in vitro cellular aging and SIPS is an acknowledged model of accelerated aging in vitro, mimicking some aspects of accelerated skin aging in vivo. Our results indicate that there may be significant differences between different fibroblast lines in the sensitivity to H2O2 (Figure 1A, 1B) linked to the capacity to decompose this compound (Figure 2A, 2B).
Hydrogen peroxide is naturally produced in the human cells during many physiologic and pathological processes and has been widely used as a model pro-oxidant in the study of oxidative stress. It has been reported that ROS, especially H2O2 and superoxide anions, are associated with the cellular proliferation of many cell types including fibroblasts [18]. However, elevated levels of H2O2 induce premature senescence and H2O2 treatment is a standard procedure used for this purpose [2, 7, 8].
Both cell lines studied by us were treated with H2O2 at concentrations corresponding to their IC50 values. Oxidative stress has been repeatedly proposed to be the factor responsible for the induction of fibroblast SIPS and antioxidants have been reported to be protective. For example, pretreatment with rapamycin decreased the extent of SIPS induced by UV exposure and this effect was ascribed to the modification of antioxidant defense by rapamycin and suppression of free radical production by irradiation [19]. We were interested in checking whether the mechanism of SIPS-induced cell death is dependent on the secondary production of ROS and if antioxidants can modulate the course of cellular changes following exposure to H2O2. Literature data do not allow for reaching an unanimous answer to this question.
Gamma-tocotrienol, biodynes, tocotrienol-rich fraction (TRF) and tocopherol were found to be protective against changes in collagen synthesis and degradation caused by H2O2-induced SIPS, nonetheless the cells were pretreated with these compounds prior to exposure to H2O2 [20, 21]. Centella asiatica herb extracts containing various pentacyclic triterpenes protected fibroblasts against the effects of H2O2-induced SIPS but, again, the cells were pre-exposed to the extracts before exposure to H2O2 [22]. Malvidin [23], cyanidin [24] and phloroglucinol [25] were reported to protect fibroblasts from H2O2-induced SIPS and decrease the level of lipid peroxidation enhanced by H2O2 exposure. Nevertheless, in these experiments the compounds were introduced soon after exposure to H2O2, so the results do not allow for distinguishing between effects of primary and secondary oxidative stress, if the latter was involved in the signaling mediating the development of SIPS.
The SIPS induced by exposure to H2O2 is known to proceed in a different way and to involve different pathways than replicative senescence. In our study, the senescence-associated β-galactosidase activity, one of indices of replicative aging, observed in H2O2-treated cells, was increased in MRC-5 cells, but its increase was not modified by antioxidants (Figure 11A). No increase in the acidic β-galactosidase activity was seen in H8F2p25LM cells, which are more sensitive to H2O2 and were treated with a lower concentration of H2O2 (Figure 11B). Interestingly, no increased staining for the senescence-associated β-galactosidase was also reported for Werner syndrome fibroblasts, which are more sensitive to H2O2 than normal fibroblasts [26]. Perhaps, higher H2O2 concentrations are required for induction of increase in acid β-galactosidase activity than for triggering the main signaling pathways inducing the SIPS program. Results from other studies indicate that these pathways include NF-κB, iNOS, p53, COX-2, the caspase-3/keratin-18 pathway and serine/threonine kinase Aurora A/MDM2 pathway as well as proteasome/ubiquitin ligase pathways of protein degradation [23, 27]. Hydrogen peroxide-induced SIPS was also found to involve pancreatic ER kinase (PERK)-mediated upregulation of CCAAT/enhancer-binding protein homologous protein and activation of unfolded protein response [28].
Posttreatment with antioxidants provided small and inconsistent protection against the toxicity of H2O2 (Figures 4A–4D and 5A–5D). Antioxidants did not affect considerably changes in GSH level induced by H2O2 treatment (Figure 6A, 6B).
The treatment with H2O2 did not induce secondary production of ROS but, at least initially, rather decreased it. The effect of antioxidants on the ROS level in H2O2-treated cells was slight or none (Figures 7A, 7B and 8A, 8B).
Hydrogen peroxide treatment decreased mitochondrial membrane potential in both cell lines studied; antioxidants provided some protection only in H8F2p25LM cells, but not in MRC-5 cells (Figure 9A, 9B).
Changes in the mitochondrial mass were inconsistent between the lines, a decrease being observed in MRC-5 cells and mostly an increase in H8F2p25LM cells. In both lines antioxidants were generally protective with respect to these changes (Figure 10A, 10B).
In summary, these results speak against the intermediacy of secondary ROS formation in the SIPS induced by H2O2. In line with our results, Le Boulch et al. analyzed protein carbonylation in human fibroblasts in the course of SIPS induced by H2O2 exposure identifying an “Oxi-proteome”, i.e. a set of proteins that are building up as oxidized. However, they did not observe an increase in the overall level of protein oxidation during SIPS; rather, this level was decreasing during several days after exposure [29]. These results speak against increase in ROS production after H2O2 exposure, which should lead to an increase in the overall protein carbonylation.
The small protective action of antioxidants observed in our study is most probably due to their effects on mitochondria of H2O2-treated cells. The critical role of mitochondrial changes involving release of cytochrome c in the development of SIPS has been documented by others [20].
Materials and Methods
Materials and equipment used in studies of cell-free systems
Xylenol Orange (cat. no. chem*237045902*5g) was obtained from Polish Chemical Reagents (POCh, Gliwice, Poland), perchloric acid (HClO4; cat. no. chem*115649402*1l) was purchased from Chempur (Piekary Śląskie, Poland), phosphate-buffered saline (PBS: 145 mM NaCl, 1.9 mM NaH2PO4, 8.1 mM Na2HPO4, cat. no. PBS405) was obtained from Lab Empire (Rzeszów, Poland). Dulbecco’s Modified Eagle Medium + GlutaMax (DMEM+GlutaMax) (cat. no. 21885-025) and Dulbecco’s Modified Eagle Medium (DMEM) (cat. no. 12430-054) and Dulbecco’s Phosphate Buffered Saline (DPBS) (cat. no. 14040-117) were purchased from Thermofisher Scientific (Waltham, MA, USA). All other reagents, if not mentioned otherwise, were purchased from Sigma-Aldrich Corp. (St. Louis, MO, USA) and were of analytical grade. Distilled water was purified using a Milli-Q system (Millipore, Bedford, MA, USA). In cell free system analysis absorptiometric measurements were done in a Spark multimode microplate reader (Tecan Group Ltd., Männedorf, Switzerland). Distilled water was purified using a Milli-Q system (Millipore, Bedford, MA, USA).
Assay of hydrogen peroxide generation
Protocol for evaluation of H2O2 generation by antioxidants consisted in addition of 18 μl of 10 mM antioxidant to 162 μl of DMEM/DMEM + glutaMAX + serum. The samples were incubated for 3 h at 37±1°C with shaking and the peroxide content was estimated before and after incubation by the ferric-Xylenol Orange method [30]. Then, to 180 μl samples, 20 μl of Xylenol Orange reagent was added [2.5 mM Xylenol Orange/2.5 mM Mohr’s salt [Fe2(NH4)2SO4; purity of 99.997 %] in 1.1 M perchloric acid]. After 30-min incubation at room temperature, absorbance of the samples was measured at 560 nm and hydrogen peroxide concentration was read from a standard curve.
Materials and equipment used to study the fibroblast cell lines
Human lung normal fibroblast cell line [MRC-5 (CCL-171)] was obtained from American Type Culture Collection (ATCC). The MRC-5 cell line was derived from normal lung tissue of a 14-week-old male foetus. This is a normal diploid human cell line with 46, XY karyotype. Before the onset of senescence MRC-5 are capable of 42 to 46 population doublings; they were used between 20th and 25th population doublings. Primary human fibroblast [H8F2p25LM] were isolated from ear skin of an adult donor; they were used between the 3rd and 7th population doubling.
Dulbecco’s Modified Eagle Medium + GlutaMax (DMEM+GlutaMax) (cat. no. 21885-025), Dulbecco’s Modified Eagle Medium (DMEM) (cat. no. 12430-054) and Dulbecco’s Phosphate Buffered Saline (DPBS) (cat. no. 14040-117) were purchased from Thermofisher Scientific (Waltham, MA, USA). Phosphate-Buffered Saline (PBS) without Ca2+ and Mg2+ (cat. no. 02-023-1A), Trypsin-EDTA solution (10x) (cat. no. 03-051-5B), Foetal Bovine Serum (cat. no. 04-001-1A) and Penicillin-Streptomycin solution (cat. no. 03-031-1B) were obtained from Biological Industries (Cromwell, CT, USA). 0.33% Neutral Red (NR) solution (cat. no. N2889), 0.4% Trypan Blue solution (cat. no. T8154), p-coumaric acid (cat. no. C9008), caffeic acid (cat. no. C0625), TEMPO (cat. no. T-7263), 4-hydroxy TEMPO (cat. no. H8258), 4-amino TEMPO (cat. no. 163945), ferulic acid (cat. no. 128708), aminoguanidine hydrochloride (cat. no. 396494), oleuropein (cat. no. O8889), resveratrol (cat. no. R5010), gallic acid (cat. no G7384), N-ethylmaleimide (NEM) (cat. no. E3876), trichloroacetic acid (TCA) (cat. no. T4885), diethylenetriaminepentaacetic acid (DTPA) (cat. no. D1133), L-ascorbic acid (cat. no. A0278), 2′,7′-dichlorodihydrofluorescein (H2DCF-DA) (cat. no. D6883), dimethyl sulfoxide (DMSO) (cat. no. D2438), ortho-phtal-dialdehyde (OPA) (cat. no. P1378) were provided by Sigma-Aldrich (St Louis, MO, USA). 96 % ethanol (cat. no. 396420113), glacial acetic acid (cat. no. 568760114) as well as methanol (cat. no. 6219900110) were obtained from Avantor Performance Materials Poland. Hydrogen peroxide, 30% was purchased from CHEMPUR (Poland). Curcumin (cat. no. SC200509) was obtained from Santa Cruz Biotechnology. Melatonin (cat. no. MEL550.500) was purchased from Bioshop. Ethoxyquin (cat. no. 02810) was provided by Fluka.
Cell culture: 75 cm2flasks (cat. no. 156499) were provided by Thermofisher Scientific (Waltham, MA, USA). Transparent 96-well culture plates (cat. no 655180) and black flat bottom 96-well plates (cat. no. 655209) were obtained from Greiner (Kremsmünster, Austria). Other sterile cell culture materials were provided by Nerbe (Winsen, Germany).
Stock solutions of antioxidants were freshly prepared in PBS (4-amino TEMPO, 4-hydroxy TEMPO, gallic acid, caffeic acid) or dimethyl sulfoxide (DMSO) (other antioxidants and filtered through a 0.22 μm filter before each experiment. The final highest concentration of DMSO in cell media was ≤ 0.02%, and had no significant effect on the treated cell lines. Absorptiometric and fluorometric measurements were done in a Spark multimode microplate reader (Tecan Group LTD., Männedorf, Switzerland). Measurements were performed in sixplicate.
Cell culture
MRC-5 cell were cultured in DMEM + GlutaMax and H8F2p 25LM were cultured in DMEM supplemented with 1% v/v penicillin and streptomycin solution and 10 % heat inactivated foetal bovine serum (FBS). Cells were incubated at 37°C under 5% carbon dioxide and 95°C humidity. Cells were passaged at about 85% confluence. Cell morphology was examined under an Zeiss Primo Vert (Oberkochen, Germany) inverted microscope with phase contrast. Fibroblasts viability was estimated by Trypan Blue exclusion test. Cells were counted in a Thoma hemocytometer (Superior Mrienfeld, Lauda-Königshofen, Germany).
The kinetics of hydrogen peroxide decomposition by fibroblasts
The fibroblasts were plated in wells of a multi-well plate. After 24 h the medium was removed and a new one containing H2O2 at a concentration of 50 μM was added. After 0, 10, 30, 45, 60, 120 and 180 minutes 90 μl of medium was collected from each well and the concentration of remaining H2O2 was determined.
To determine hydrogen peroxide, 10 μl of Xylenol Orange reagent was added to the collected 90 μl aliquots. After 30-min incubation at room temperature, absorbance of the samples was measured at 560 nm.
Determination of hydrogen peroxide inhibitory concentration (IC50)
The cell were seeded in 96-well clear plate at a density of 2.5×10³ cells/well in 100 μl culture medium and allowed to attach for 24 h at 37°C. After incubation cells were treated with hydrogen peroxide at concentrations ranging from 0-500 μM (MRC-5) or 0-100 μM (H8F2p25LM). Working solution of hydrogen peroxide was prepared in culture medium suitable for appropriate fibroblast line. After 24 h exposure to hydrogen peroxide medium was removed, replaced with 100 μl of 2% Neutral Red solution and incubated for 1 h at 37°C. Then the cells were washed with PBS, fixed with 100 μl/well 50% ethanol, 49% H2O and 1% glacial acetic acid, and shaken for 20 min (700 rpm) at room temperature. Absorbance was measured at 540 nm against 620 nm.
Antioxidant cytotoxicity
The cells were seeded in a transparent 96-well plate at a density of 5×10³ cells/well in 100 μl culture medium and allowed to attach for 24 h at 37°C. After incubation the cells were treated with different antioxidants (TEMPO, 4-amino TEMPO, 4-hydroxy TEMPO, melatonin, ethoxyquin, p-coumaric acid, ferulic acid, gallic acid, aminoguanidine hydrochloride, oleuropein, resveratrol, curcumin, caffeic acid) at 1, 10 and 100 μM concentrations. Working solutions of antioxidants were prepared in culture medium.
After 24 h exposure to antioxidants medium was removed and replaced with 100 μl of 1% Neutral Red solution and incubated for 1 h at 37°C. Than the cells were washed with PBS, fixed with 100 μl/well 50% ethanol, 49% H2O and 1% glacial acetic acid and shaken for 20 min (700 rpm) at room temperature. Absorbance was measured at 540 nm against 620 nm.
Stress-induced premature senescence (SIPS)
SIPS studies were performed on cells grown at a density of 5 x 10³ cell/well (both MRC-5 and H8F2p25LM), 24 h post-seeding. After incubation cells were treated with H2O2 at 50% inhibitory concentration (IC50) for 24 h at 37°C to induce senescence. Working solutions of H2O2 were prepared in culture medium (DMEM or DMEM+GlutaMax). After 24 h the cells were posttreated with studied antioxidants at various concentrations depending of substances (ranging from 0 to 100 μM) for 24, 48 or 96 h. Cells treated with H2O2, but not posttreated with antioxidants were used as a control. Subsequently, fibroblast viability was tested using NR assay, as a described above.
Catalase activity
Fibroblast cells (MRC-5, H8F2p25LM) were seeded in transparent 6-well plate and allowed to attach for 24 h at 37 °C. After incubation the cells were trypsinized and their number was counted. Then the cells were transferred to a 15 ml falcon, centrifuged at 900 rpm for 5 minutes, washed with PBS and centrifuged once again. After these steps, supernatant was removed and 50 mM phosphate buffer (pH 7) with 0.1% Triton X-100 was added. The samples were centrifuged at 14000 g for 25 minutes at 0°C and supernatant was collected and used for further determinations. 0.036% solution of H2O2 in 50 mM phosphate buffer was introduced into a quartz cuvette (1 ml). Then the supernatant from cell lysis was added and absorbance was measured at 240 nm for 5 minutes (kinetic measurement).
Content of reduced glutathione
To investigate the content of reduced glutathione in the fibroblasts, the method with ortho-phtal-dialdehyde was used. The cells were seeded in a transparent 96-well plate at an amount 7.5×10³/well and allowed to attach for 24 h at 37°C. After that, fibroblasts were treated with H2O2 at 600 μM concentration for MRC-5 and 35 μM for H8F2p25LM. After 24 h incubation, the medium was removed and replaced with antioxidant solutions: 1 μM curcumin, 2 μM 4-amino TEMPO, 10 μM caffeic acid and 50 μM p-coumaric acid. These concentrations were based on the effects of antioxidants on the survival of H2O2-treated cells. Tests were performed after 24 h, 48 hand 96 h incubation with studied substances. After incubation antioxidant solutions were removed, the cells were washed with PBS (150 μl per well) and then 60 μl/well of cold lysis buffer (RQB buffer: 20 mM HCl, 5% TCA, 5 mM DTPA, 10 mM L-ascorbic acid) were added. The plate was shaken for 5 minutes and centrifuged at 4000 rpm for 5 minutes. Next the cell lysate was transferred into two 96-well black bottom plates (‘+ NEM’ and ‘- NEM’) in an amount of 25 μl/well. Within the plate ‘+ NEM’, 4 μl/well freshly prepared 7.5 mM NEM in cold RQB buffer were added. Then 40 μl/well 1 M phosphate buffer (pH 7.0) were added into both plates and the plates were shaken for 5 min at 700 rpm. Subsequently, 160 μl/well of cold 0.1 M phosphate buffer (pH 6.8) and 25 μl/well of freshly prepared 0.5% OPA in methanol were added into both plates. Both plates were incubated for 30 minutes at room temperature under constant stirring. Fluorescence was measured at 355/430 nm [31]. The content of reduced glutathione was determined by subtracting the fluorescence of the ‘- NEM’ plate from the fluorescence ‘+ NEM’ plate and calculated with respect to the protein content. Protein content in cell lysates was determined according to Lowry et al. [32]. The results were expressed as a percentage of untreated control.
Fluorometric measurement of reactive oxygen species (ROS) with H2DCF-DA
The level of ROS in H2O2-treated fibroblasts posttreated with antioxidants was assayed with 2′,7′-dichlorofluorescein (H2DCF-DA). The cells were seeded in 96-well flat clear-bottom black plate at an amount of 7.5×10³/well and allowed to attach for 24 h in 37°C. After that, fibroblasts were treated with H2O2 at 600 μM concentration for MRC-5 and 35 μM for H8F2p25LM. After 24 h incubation, the medium was removed and replaced with antioxidants solutions: 1 μM curcumin, 2 μM 4-amino-TEMPO, 10 μM caffeic acid or 50 μM p-coumaric acid. Tests were performed after 24 h, 48 h and 96 h incubation with studied substances. After incubation with antioxidants the medium was removed and replaced by 10 μM 2′,7′-dichlorofluorescein (H2DCF-DA) (100 μl/well). Stock H2DCF-DA solution was prepared in DMSO, and working solution was prepared in phosphate buffer. Fluorescence was measured at 490/529 nm for 2 h at 37°C (fluorescence measurements every minute).
Fluorometric measurement of mitochondrial superoxide radical level
To estimate the level of superoxide in H2O2 treated cells posttreated with antioxidants, Cell meter TM Fluorimetric Mitochondrial Superoxide Activity Assay kit from AAT Bioquest (cat. no. 22971) was used. Briefly, cell were seeded in 96-well flat clear-bottom black plates at a density of 7.5×10³/well and allowed to attach for 24 h at 37°C. After incubation cells were treated with hydrogen peroxide (24 h) and posttreated with selected antioxidants (24, 48, 96 h) as described earlier. Subsequently the medium with antioxidants was removed, and 100 μl/well of MitoROSTM 580 working solution was added into the wells. Cells were incubated at 37°C for 45 minutes. Then, incubation fluorescence was measured at 540/590 nm for 4 h at 37°C (fluorescence measurements every minute).
Mitochondrial membrane potential (Δψm)
To estimated changes in the mitochondrial membrane potential after the use of selected antioxidants, JC-1 (5,5′,6,6′-tetrachloro-1,1′,3,3′-tetraethylbenzimida-zolylcarbocyanine iodide) with a Mitochondrial Membrane Potential Assay kit from Abnova was used. JC-1 is a lipophilic, cationic dye that can selectively enter the mitochondria and reversibly change color from green to red as the membrane potential increases. In cells with high Δψm, JC-1 spontaneously forms complexes known as J-aggregates with intense red fluorescence. However, in injured cells with low Δψm, JC-1 remains in the monomeric form and shows only green fluorescence.
Briefly, fibroblasts were seeded in a 96-well flat clear-bottom black plate at a density of 7.5×10³/well and allowed to attach at 37°C for 24 h. After incubation the cells were treated with H2O2 (24 h) and posttreated with selected antioxidants as described earlier. Then 10 μl of JC-1 staining solution were added into plate wells and the plate was incubated at 37°C for 30 min. After this time the cells were centrifuged at 4000 rpm for 5 min and the supernatant was gently removed. The plate was washed twice using the buffer included in the kit and centrifuged at 4000 rpm for 5 min. The supernatant was replaced by the buffer (100 μl/well) and fluorescence was measured at 535/595 nm (J-aggregates) and 485/535 nm (J-monomers). Data are shown as a ratio of fluorescence of J-aggregates to that of J-monomers.
Mitochondrial mass
MRC-5 and H8F2p25LM cells were seeded at an amount of 1×10⁵ cells/well into a 6-well plate and allowed to attach at 37°C. After incubation the cells were treated with H2O2 (24 h) and posttreated with selected antioxidants (curcumin, 4-amino-TEMPO, caffeic acid, p-coumaric acid) for 24, 48, 96 h. Subsequently the cells were trypsinized, counted, transferred to Eppendorf tubes and centrifuged for 5 minutes at 2000 rpm, then washed with 1 ml of PBS and centrifuged again. Subsequently, 1 ml of 10 μM N-nonyl acridine orange (NAO) in PBS was added and the cells were incubated at 37°C for 10 min. After incubation with NAO cells were centrifuged and washed with PBS (1 ml) and then the cell pellet was resuspended in 300 μl of PBS. Each sample was transferred into a 96-well black plate (100 μl/well, 3 repetitions). Fluorescence was measured at 435/535 nm. The results were calculated respectively to cell number.
Staining cells for senescence-associated β-galactosidase
2×10⁵ MRC-5 cells and 1.4×10⁵ H8F2p25LM cells were seeded into wells of 6-well plates and allowed to grow for 24 hours. Then the medium was exchanged for a fresh one containing H2O2 in a final concentration of 600 μM or 35 μM, respectively (except for control wells) and the cells were incubated for further 24 hours. The medium was again replaced by a fresh one containing 1 μM curcumin, 2 μM 4-amino-TEMPO, 10 μM caffeic acid or 50 μM coumaric acid. Cells were harvested after 24, 48 or 96 hours since the last medium exchange, centrifuged (100×g for 10 minutes, room temperature), resuspended in 200 μL of 1 μM 4-methylumbelliferyl β-D-galactopyranoside dissolved in fresh medium, incubated for 1 hour at 37°C and then analysed by flow cytometry (excitation: 355 nm, emission: 425-475 nm). Median fluorescence of control samples at 24-hour posttreatment was assumed as 100%.
Statistical analysis
Kruskal-Wallis test or t-Student test was performed to estimate differences between H2O2 treated control cells and antioxidant posttreated cells to assess their properties in each individual assay; P≤ 0.05 was considered as statistically significant in both cases. Also differences between H2O2-treated and non-treated controls were assessed by an appropriate test (one of two described above). Statistical analysis of the data was performed using STATISTICA software package (version 13.1, StatSoft Inc. 2016, Tulsa, OK, USA).
Author Contributions
I. S.-B. was responsible for the concept of the study, design of experiments and supervision of experimental work, performed part of experiments as well as had a leading role in the analysis of the results and preparation of the manuscript. N. P. performed main part of experiments in the cellular system and their statistical evaluation as well as contributed to reagents/materials/analysis tools. She further contributed also to data acquisition and interpretation and wrote parts of the manuscript. G. B. participated in the revision of the manuscript and was also responsible for providing the funding for the study. M. P. took part in the execution of experiments. M. G.-P. performed part of experiments in cell-free systems as well as helped with study of H2O2 sensitivity of fibroblasts and their statistical evaluation. M. G. carried out the assay of acid lysosomal β-galactosidase activity and statistical evaluation of its results. All authors have read and approved the final manuscript.
Acknowledgments
We would like to express our special appreciation and thanks to Edyta Bieszczad-Bedrejczuk, M.Sc., (Department of Analytical Biochemistry, University of Rzeszów, Poland) for the excellent technical assistance as well as Dr. J. Sroka (Department of Cell Biology, Faculty of Biochemistry, Biophysics and Biotechnology, Jagiellonian University, Poland) for kindly providing the H8F2p25LM cells.
Conflicts of Interest
The authors declare that they have no conflicts of interests.
Funding
This study was performed within the project "Modification of cellular aging in vitro by inhibitors of non-enzymatic protein modifications" (number of the application 2015/17/B/NZ3/03731) financed by National Science Centre, Poland in a programme "OPUS 9".
References
- 1. Frippiat C, Chen QM, Remacle J, Toussaint O. Cell cycle regulation in H(2)O(2)-induced premature senescence of human diploid fibroblasts and regulatory control exerted by the papilloma virus E6 and E7 proteins. Exp Gerontol. 2000; 35:733–45. https://doi.org/10.1016/S0531-5565(00)00167-4 [PubMed]
- 2. Toussaint O, Medrano EE, von Zglinicki T. Cellular and molecular mechanisms of stress-induced premature senescence (SIPS) of human diploid fibroblasts and melanocytes. Exp Gerontol. 2000; 35:927–45. https://doi.org/10.1016/S0531-5565(00)00180-7 [PubMed]
- 3. Höhn A, Weber D, Jung T, Ott C, Hugo M, Kochlik B, Kehm R, König J, Grune T, Castro JP. Happily (n)ever after: aging in the context of oxidative stress, proteostasis loss and cellular senescence. Redox Biol. 2017; 11:482–501. https://doi.org/10.1016/j.redox.2016.12.001 [PubMed]
- 4. Kornienko JS, Smirnova IS, Pugovkina NA, Ivanova JS, Shilina MA, Grinchuk TM, Shatrova AN, Aksenov ND, Zenin VV, Nikolsky NN, Lyublinskaya OG. High doses of synthetic antioxidants induce premature senescence in cultivated mesenchymal stem cells. Sci Rep. 2019; 9:1296. https://doi.org/10.1038/s41598-018-37972-y [PubMed]
- 5. Matos L, Gouveia A, Almeida H. Copper ability to induce premature senescence in human fibroblasts. Age (Dordr). 2012; 34:783–94. https://doi.org/10.1007/s11357-011-9276-7 [PubMed]
- 6. Chatterjee N, Kiran S, Ram BM, Islam N, Ramasarma T, Ramakrishna G. Diperoxovanadate can substitute for H(2)O(2) at much lower concentration in inducing features of premature cellular senescence in mouse fibroblasts (NIH3T3). Mech Ageing Dev. 2011; 132:230–39. https://doi.org/10.1016/j.mad.2011.04.005 [PubMed]
- 7. Toussaint O, Dumont P, Dierick JF, Pascal T, Frippiat C, Chainiaux F, Sluse F, Eliaers F, Remacle J. Stress-induced premature senescence. Essence of life, evolution, stress, and aging. Ann N Y Acad Sci. 2000; 908:85–98. https://doi.org/10.1111/j.1749-6632.2000.tb06638.x [PubMed]
- 8. Chen JH, Ozanne SE, Hales CN. Methods of cellular senescence induction using oxidative stress. Methods Mol Biol. 2007; 371:179–89. https://doi.org/10.1007/978-1-59745-361-5_14 [PubMed]
- 9. Hirsch I, Prell E, Weiwad M. Assessment of cell death studies by monitoring hydrogen peroxide in cell culture. Anal Biochem. 2014; 456:22–24. https://doi.org/10.1016/j.ab.2014.04.009 [PubMed]
- 10. Makino N, Mochizuki Y, Bannai S, Sugita Y. Kinetic studies on the removal of extracellular hydrogen peroxide by cultured fibroblasts. J Biol Chem. 1994; 269:1020–25. [PubMed]
- 11. Masaki H. Role of antioxidants in the skin: anti-aging effects. J Dermatol Sci. 2010; 58:85–90. https://doi.org/10.1016/j.jdermsci.2010.03.003 [PubMed]
- 12. Bürkle A. In memoriam Olivier Toussaint – Stress-induced premature senescence and the role of DNA damage. Mech Ageing Dev. 2018; 170:10–12. https://doi.org/10.1016/j.mad.2017.06.003
- 13. Dumont P, Burton M, Chen QM, Gonos ES, Frippiat C, Mazarati JB, Eliaers F, Remacle J, Toussaint O. Induction of replicative senescence biomarkers by sublethal oxidative stresses in normal human fibroblast. Free Radic Biol Med. 2000; 28:361–73. https://doi.org/10.1016/S0891-5849(99)00249-X [PubMed]
- 14. de Magalhães JP, Passos JF. Stress, cell senescence and organismal ageing. Mech Ageing Dev. 2018; 170:2–9. https://doi.org/10.1016/j.mad.2017.07.001 [PubMed]
- 15. Tanigawa T, Kanazawa S, Ichibori R, Fujiwara T, Magome T, Shingaki K, Miyata S, Hata Y, Tomita K, Matsuda K, Kubo T, Tohyama M, Yano K, Hosokawa K. (+)-Catechin protects dermal fibroblasts against oxidative stress-induced apoptosis. BMC Complement Altern Med. 2014; 14:133. https://doi.org/10.1186/1472-6882-14-133 [PubMed]
- 16. Krutmann J, Schroeder P. Role of mitochondria in photoaging of human skin: the defective powerhouse model. J Investig Dermatol Symp Proc. 2009; 14:44–49. https://doi.org/10.1038/jidsymp.2009.1 [PubMed]
- 17. Tanuja Yadav, Mishra S, Das S, Aggarwal S, Rani V. Anticedants and natural prevention of environmental toxicants induced accelerated aging of skin. Environ Toxicol Pharmacol. 2015; 39:384–91. https://doi.org/10.1016/j.etap.2014.11.003 [PubMed]
- 18. Burdon RH. Superoxide and hydrogen peroxide in relation to mammalian cell proliferation. Free Radic Biol Med. 1995; 18:775–94. https://doi.org/10.1016/0891-5849(94)00198-S [PubMed]
- 19. Qin D, Ren R, Jia C, Lu Y, Yang Q, Chen L, Wu X, Zhu J, Guo Y, Yang P, Zhou Y, Zhu N, Bi B, Liu T. Rapamycin Protects Skin Fibroblasts from Ultraviolet B-Induced Photoaging by Suppressing the Production of Reactive Oxygen Species. Cell Physiol Biochem. 2018; 46:1849–60. https://doi.org/10.1159/000489369 [PubMed]
- 20. Makpol S, Abdul Rahim N, Hui CK, Ngah WZ. Inhibition of mitochondrial cytochrome c release and suppression of caspases by gamma-tocotrienol prevent apoptosis and delay aging in stress-induced premature senescence of skin fibroblasts. Oxid Med Cell Longev. 2012; 2012:785743. https://doi.org/10.1155/2012/785743 [PubMed]
- 21. Makpol S, Jam FA, Khor SC, Ismail Z, Mohd Yusof YA, Ngah WZ. Comparative effects of biodynes, tocotrienol-rich fraction, and tocopherol in enhancing collagen synthesis and inhibiting collagen degradation in stress-induced premature senescence model of human diploid fibroblasts. Oxid Med Cell Longev. 2013; 2013:298574. https://doi.org/10.1155/2013/298574 [PubMed]
- 22. Kim YJ, Cha HJ, Nam KH, Yoon Y, Lee H, An S. Centella asiatica extracts modulate hydrogen peroxide-induced senescence in human dermal fibroblasts. Exp Dermatol. 2011; 20:998–1003. https://doi.org/10.1111/j.1600-0625.2011.01388.x [PubMed]
- 23. Seo HR, Choi MJ, Choi JM, Ko JC, Ko JY, Cho EJ. Malvidin Protects WI-38 Human Fibroblast Cells Against Stress-induced Premature Senescence. J Cancer Prev. 2016; 21:32–40. https://doi.org/10.15430/JCP.2016.21.1.32 [PubMed]
- 24. Choi MJ, Kim BK, Park KY, Yokozawa T, Song YO, Cho EJ. Anti-aging effects of cyanidin under a stress-induced premature senescence cellular system. Biol Pharm Bull. 2010; 33:421–26. https://doi.org/10.1248/bpb.33.421 [PubMed]
- 25. So MJ, Cho EJ. Phloroglucinol Attenuates Free Radical-induced Oxidative Stress. Prev Nutr Food Sci. 2014; 19:129–35. https://doi.org/10.3746/pnf.2014.19.3.129 [PubMed]
- 26. de Magalhães JP, Migeot V, Mainfroid V, de Longueville F, Remacle J, Toussaint O. No increase in senescence-associated beta-galactosidase activity in Werner syndrome fibroblasts after exposure to H2O2. Ann N Y Acad Sci. 2004; 1019:375–78. https://doi.org/10.1196/annals.1297.066 [PubMed]
- 27. Kural KC, Tandon N, Skoblov M, Kel-Margoulis OV, Baranova AV. Pathways of aging: comparative analysis of gene signatures in replicative senescence and stress induced premature senescence. BMC Genomics. 2016 (Suppl 14); 17:1030. https://doi.org/10.1186/s12864-016-3352-4 [PubMed]
- 28. Matos L, Gouveia AM, Almeida H. ER Stress Response in Human Cellular Models of Senescence. J Gerontol A Biol Sci Med Sci. 2015; 70:924–35. https://doi.org/10.1093/gerona/glu129 [PubMed]
- 29. Le Boulch M, Ahmed EK, Rogowska-Wrzesinska A, Baraibar MA, Friguet B. Proteome oxidative carbonylation during oxidative stress-induced premature senescence of WI-38 human fibroblasts. Mech Ageing Dev. 2018; 170:59–71. https://doi.org/10.1016/j.mad.2017.07.005 [PubMed]
- 30. Gay CA, Gebicki JM. Perchloric acid enhances sensitivity and reproducibility of the ferric-xylenol orange peroxide assay. Anal Biochem. 2002; 304:42–46. https://doi.org/10.1006/abio.2001.5566 [PubMed]
- 31. Senft AP, Dalton TP, Shertzer HG. Determining glutathione and glutathione disulfide using the fluorescence probe o-phthalaldehyde. Anal Biochem. 2000; 280:80–86. https://doi.org/10.1006/abio.2000.4498 [PubMed]
- 32. Lowry OH, Rosebrough NJ, Farr AL, Randall RJ. Protein measurement with the Folin phenol reagent. J Biol Chem. 1951; 193:265–75. [PubMed]