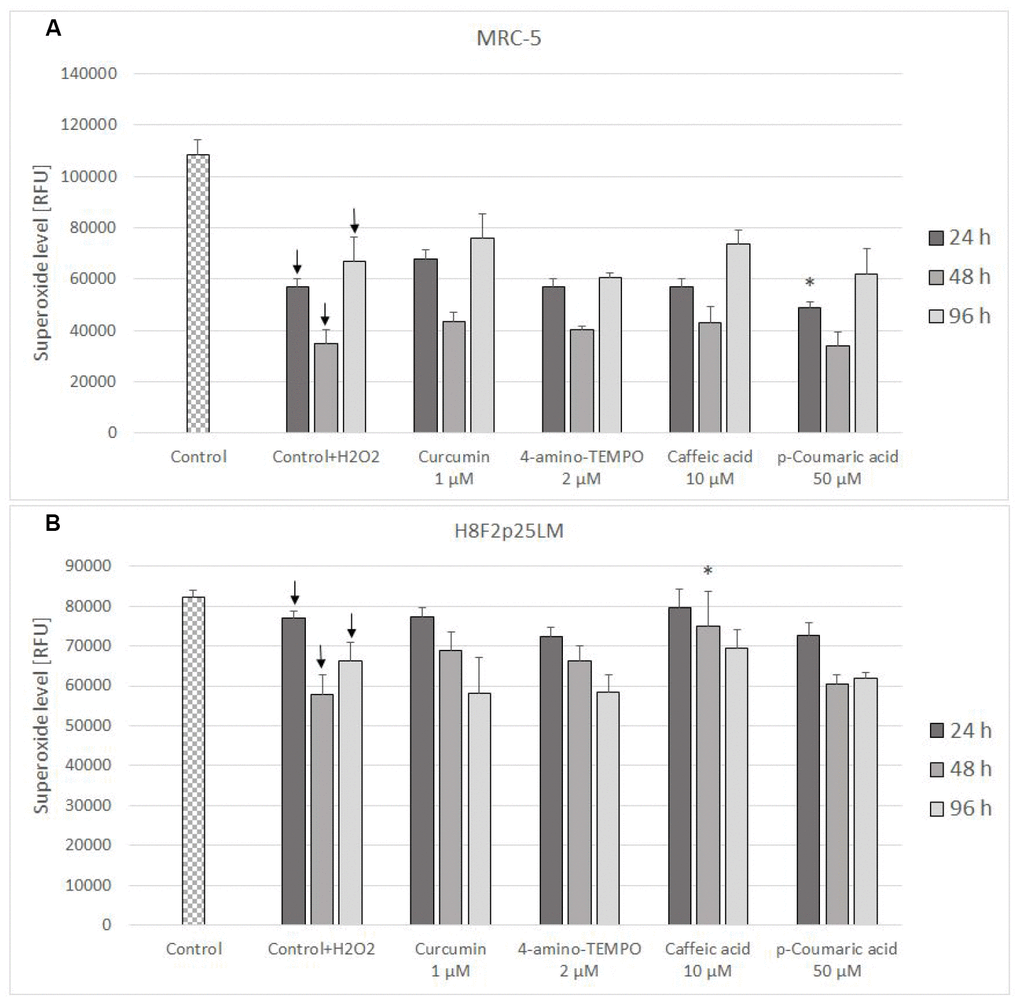
Figure 8.Mitochondrial superoxide level in MRC-5 (A) and H8F2p25LM (B) cells after 24 h treatment with hydrogen peroxide and 24 h, 48 h, 96 h posttreatment with selected concentrations of antioxidants. * P≤0.05 t-Student test against H2O2 treated control; ↓ differences between treated and non-treated control.