


Introduction
Body mass index (BMI) is a simple anthropometric measure of nutritional status, but it is also an important mortality indicator among hospitalized patients [1]. In the elderly population, low BMI, which was defined as a BMI <18.5 kg/m2, is more related to increased mortality than is being overweight [2, 3].
The serum albumin level is another important variable for assessing the nutritional status of patients with acute or chronic illness [4]. Hypoalbuminemia, defined as serum albumin levels <3.5 g/dL, is common among hospitalized patients [5] and is associated with mortality and increased risk for various diseases [6], including heart failure [7], cirrhosis [8], and nephrotic syndrome [9]. In addition, poor functional recovery from stroke was noted in a population of patients with low BMIs and serum albumin levels [10]. This suggests, the combination of BMI and serum or urine albumin levels may be predictive of all-cause mortality in the general population [11].
Aging is a major risk factor adversely affecting life expectancy among the elderly [12, 13]. Many of these individuals have a limited performance status (Eastern Cooperative Oncology Group (ECOG) [14] score >2) and use a wheelchair or are bedridden in long-term facilities. Indexes such as the Minimum Data Set (including: frailty index, nutrition, physical function and cognitive function) have been used to predict mortality in nursing homes [15–17]. However, most of those studies have focused on short-term mortality and used qualitative prognostic information instead of quantitative data [18]. We evaluated the utility of the combination of serum albumin and BMI for predicting mortality in elderly residents with limited performance status in long-term care facilities (ECOG score >2) and assessed whether a cut-off value could assist physicians in clinical settings.
Results
In total, 228 individuals (42% men) living in eight different long-term care facilities met our inclusion criteria for BMI and serum albumin at the end of a 6-year follow-up period. Among those, 46 (20%) were excluded due to ECOG scores <2 (Figure 1). Of the remaining 182 participants, 20 (11%) had serum albumin levels <2.8 g/dL, while 117 (64%) had serum albumin levels of 2.8–3.5 g/dL and 45 (25%) had levels >3.5 g/dL. Table 1 lists the basic characteristics of the participants segregated based on their albumin levels. The total number of deaths during follow-up was 139 (76%). The mean age of the participants with an ECOG score ≥2 was 78.8 years (57% women). Compared with the other two groups, participants with albumin levels <2.8 g/dL were older and had a significantly lower waist circumference (WC) and BMI as well as lower hemoglobin, albumin, total cholesterol, and triglyceride (TG) levels.
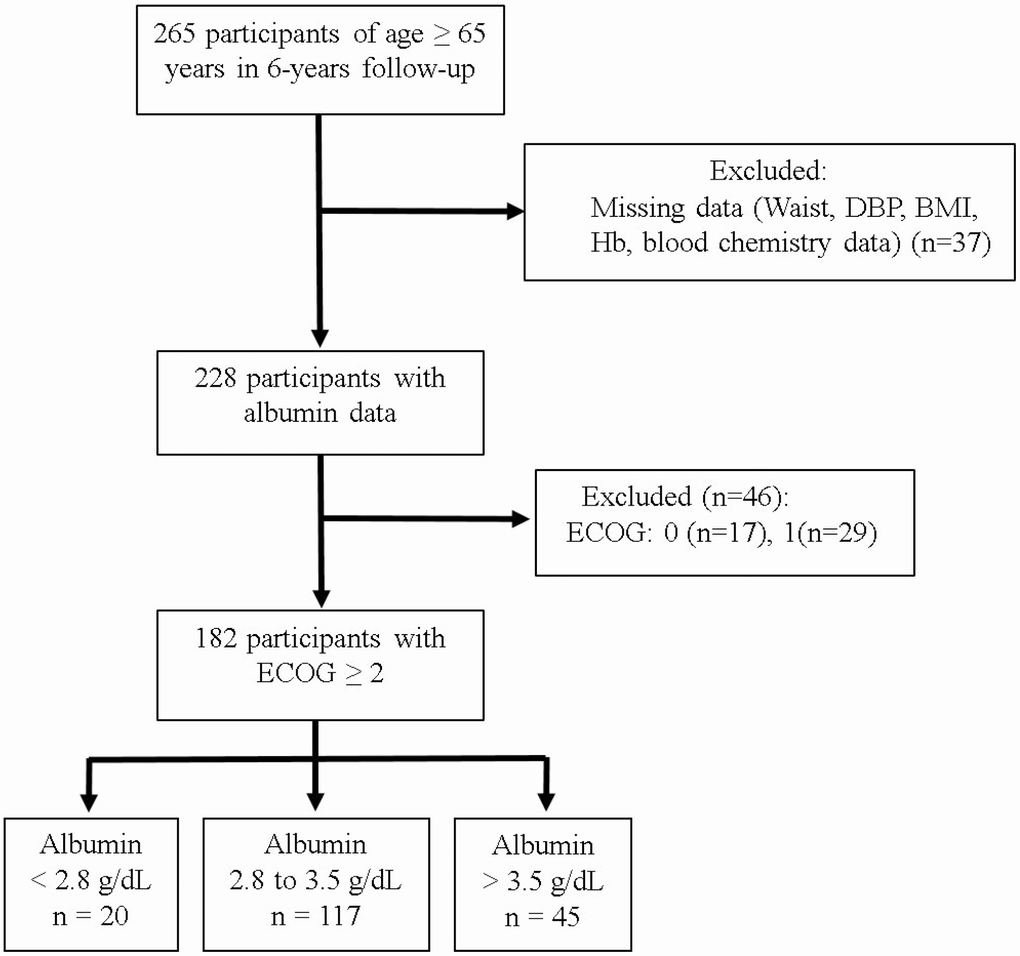
Figure 1. Study sample.
Table 1. Comparison of population characteristics in different serum albumin concentrations
| Variable | Study group (n=182) | Albumin (g/dL) | *P | ||||||||||||||||||||||||||||||||||||||||||||||||||||||||||||||||||||||||||||||||||||||||||||||||
| <2.8 (n=20) | 2.8-3.5 (n=117) | >3.5 (n=45) | |||||||||||||||||||||||||||||||||||||||||||||||||||||||||||||||||||||||||||||||||||||||||||||||||
| Age, years | 78.8 ± 7.5 | 83.6 ± 6.5 | 78.6 ± 7.5 | 77.1 ± 7.2 | 0.0048 | ||||||||||||||||||||||||||||||||||||||||||||||||||||||||||||||||||||||||||||||||||||||||||||||
| Female sex; % (n) | 57 (103) | 7 (7) | 64 (66) | 29 (30) | 0.06 | ||||||||||||||||||||||||||||||||||||||||||||||||||||||||||||||||||||||||||||||||||||||||||||||
| Death; % (n) | 76 (139) | 14 (19) | 64 (89) | 22 (31) | 0.07 | ||||||||||||||||||||||||||||||||||||||||||||||||||||||||||||||||||||||||||||||||||||||||||||||
| Systolic BP, mmHg | 127.0 ± 13.3 | 130.2 ± 12.2 | 126.4 ± 12.9 | 127.3 ± 14.7 | 0.5 | ||||||||||||||||||||||||||||||||||||||||||||||||||||||||||||||||||||||||||||||||||||||||||||||
| Diastolic BP, mmHg | 75.3 ± 8.6 | 77.6 ± 7.5 | 75.2 ± 8.3 | 74.8 ± 9.9 | 0.4 | ||||||||||||||||||||||||||||||||||||||||||||||||||||||||||||||||||||||||||||||||||||||||||||||
| Waist circumference, cm | 80.9 ± 10.1 | 74.2 ± 9.9 | 80.5 ± 9.6 | 84.7 ± 10.0 | 0.0004 | ||||||||||||||||||||||||||||||||||||||||||||||||||||||||||||||||||||||||||||||||||||||||||||||
| Body mass index, kg/m2 | 21.3 ± 4.1 | 18.3 ± 2.8 | 21.0 ± 3. | 23.1 ± 4.3 | <0.0001 | ||||||||||||||||||||||||||||||||||||||||||||||||||||||||||||||||||||||||||||||||||||||||||||||
| Biochemistry | |||||||||||||||||||||||||||||||||||||||||||||||||||||||||||||||||||||||||||||||||||||||||||||||||||
| Hemoglobin, g/dL | 12.1 ± 1.9 | 10.6 ± 1.2 | 11.9 ± 1.8 | 13.1 ± 1.7 | <0.0001 | ||||||||||||||||||||||||||||||||||||||||||||||||||||||||||||||||||||||||||||||||||||||||||||||
| Albumin, g/dL | 3.2 ± 0.4 | 2.5 ± 0.3 | 3.2 ± 0.2 | 3.7 ± 0.2 | <0.0001 | ||||||||||||||||||||||||||||||||||||||||||||||||||||||||||||||||||||||||||||||||||||||||||||||
| Glucose, mg/dL | 101.0 ± 29.3 | 95.8 ± 16.0 | 98.7 ± 21.1 | 109.2 ± 46.3 | 0.08 | ||||||||||||||||||||||||||||||||||||||||||||||||||||||||||||||||||||||||||||||||||||||||||||||
| Total cholesterol, mg/dL | 178.4 ± 42.6 | 149.2 ± 36.1 | 175.5 ± 38.7 | 198.9 ± 46.1 | <0.0001 | ||||||||||||||||||||||||||||||||||||||||||||||||||||||||||||||||||||||||||||||||||||||||||||||
| Triglyceride, mg/dL | 105.4 ± 108.1 | 79.1 ± 33.8 | 95.1 ± 63.4 | 143.9 ± 186.8 | 0.018 | ||||||||||||||||||||||||||||||||||||||||||||||||||||||||||||||||||||||||||||||||||||||||||||||
| High density lipoprotein, mg/dL | 40.2 ± 11.0 | 36.6 ± 11.1 | 40.5 ± 10.7 | 41.1 ± 11.6 | 0.3 | ||||||||||||||||||||||||||||||||||||||||||||||||||||||||||||||||||||||||||||||||||||||||||||||
| Urin acid, mg/dL | 5.3 ± 1.7 | 4.8 ± 1.5 | 5.1 ± 1.5 | 5.7 ± 2.1 | 0.06 | ||||||||||||||||||||||||||||||||||||||||||||||||||||||||||||||||||||||||||||||||||||||||||||||
| Blood urine nitrogen, mg/dL | 16.6 ± 8.3 | 17.8 ± 8.5 | 16.3 ± 8.9 | 16.6 ± 6.4 | 0.8 | ||||||||||||||||||||||||||||||||||||||||||||||||||||||||||||||||||||||||||||||||||||||||||||||
| Creatinine, mg/dL | 1.0 ± 0.5 | 1.0 ± 0.4 | 1.1 ± 0.6 | 1.0 ± 0.3 | 0.9 | ||||||||||||||||||||||||||||||||||||||||||||||||||||||||||||||||||||||||||||||||||||||||||||||
| Musculoskeletal conditions | |||||||||||||||||||||||||||||||||||||||||||||||||||||||||||||||||||||||||||||||||||||||||||||||||||
| ECOG; % (n) | 0.2 | ||||||||||||||||||||||||||||||||||||||||||||||||||||||||||||||||||||||||||||||||||||||||||||||||||
| 2 | 25 (45) | 9 (4) | 62 (28) | 29 (13) | |||||||||||||||||||||||||||||||||||||||||||||||||||||||||||||||||||||||||||||||||||||||||||||||
| 3 | 45 (81) | 9 (7) | 62 (50) | 30 (24) | |||||||||||||||||||||||||||||||||||||||||||||||||||||||||||||||||||||||||||||||||||||||||||||||
| 4 | 31 (56) | 16 (9) | 70 (39) | 14 (8) | |||||||||||||||||||||||||||||||||||||||||||||||||||||||||||||||||||||||||||||||||||||||||||||||
| BP: Blood Pressure; ECOG: Eastern Cooperative Oncology Group, | |||||||||||||||||||||||||||||||||||||||||||||||||||||||||||||||||||||||||||||||||||||||||||||||||||
| *ANOVA for continuous variables, chi-square test for categorical variables for the different albumin concentration | |||||||||||||||||||||||||||||||||||||||||||||||||||||||||||||||||||||||||||||||||||||||||||||||||||
In a univariate analysis, age, diastolic blood pressure (DBP), nutrition indices (i.e., WC, BMI, and albumin level), and renal function indices (i.e., blood urea nitrogen [BUN] and creatinine levels) were all associated with all-cause mortality (P <0.05 for all; Table 2). In a multivariate analysis, participants with DBPs ≥90 mmHg had shorter survival times than those with DBPs <90 mmHg (hazard ratio [HR] = 2.08; 95% confidence interval [CI] = 1.13-3.82; P = 0.018; Table 2). Moreover, mortality was higher among participants with BMIs <18.5 kg/m2 and albumin levels <2.8 g/dL than among those with BMIs of 18.5-24 kg/m2 and albumin levels >3.5 g/dL (HR = 1.80, 95% CI = 1.11-2.94 and HR = 2.54, 95% CI 1.22-5.30, respectively; P = 0.018 and 0.013, respectively).
Table 2. Cox regression models of mortality in elderly participants based on each covariate
| Individual covariates | Univariate analysis | Multivariate analysis | |||||||||||||||||||||||||||||||||||||||||||||||||||||||||||||||||||||||||||||||||||||||||||||||||
| HR | 95% CI | P | HR | 95% CI | P | ||||||||||||||||||||||||||||||||||||||||||||||||||||||||||||||||||||||||||||||||||||||||||||||
| Age, year | 1.04 | 1.02-1.07 | 0.0002 | 1.03 | 1.00-1.06 | 0.089 | |||||||||||||||||||||||||||||||||||||||||||||||||||||||||||||||||||||||||||||||||||||||||||||
| Gender Men vs women | 1.16 | 0.83-1.63 | 0.377 | 1.10 | 0.66-1.85 | 0.709 | |||||||||||||||||||||||||||||||||||||||||||||||||||||||||||||||||||||||||||||||||||||||||||||
| Systolic BP, mmHg | |||||||||||||||||||||||||||||||||||||||||||||||||||||||||||||||||||||||||||||||||||||||||||||||||||
| <120 | Reference | Reference | |||||||||||||||||||||||||||||||||||||||||||||||||||||||||||||||||||||||||||||||||||||||||||||||||
| 120-140 | 1.39 | 0.95-2.03 | 0.087 | 1.43 | 0.86-2.38 | 0.17 | |||||||||||||||||||||||||||||||||||||||||||||||||||||||||||||||||||||||||||||||||||||||||||||
| ≥140 | 1.20 | 0.75-1.92 | 0.449 | 1.17 | 0.63-2.17 | 0.62 | |||||||||||||||||||||||||||||||||||||||||||||||||||||||||||||||||||||||||||||||||||||||||||||
| Diastolic BP, mmHg | |||||||||||||||||||||||||||||||||||||||||||||||||||||||||||||||||||||||||||||||||||||||||||||||||||
| <80 | Reference | Reference | |||||||||||||||||||||||||||||||||||||||||||||||||||||||||||||||||||||||||||||||||||||||||||||||||
| 80-90 | 0.59 | 0.36-0.97 | 0.037 | 0.82 | 0.42-1.59 | 0.547 | |||||||||||||||||||||||||||||||||||||||||||||||||||||||||||||||||||||||||||||||||||||||||||||
| ≥90 | 0.56 | 0.28-1.15 | 0.115 | 2.08 | 1.13-3.82 | 0.018 | |||||||||||||||||||||||||||||||||||||||||||||||||||||||||||||||||||||||||||||||||||||||||||||
| Waist circumference, cm ≥90/80 vs <90/80* | 0.70 | 0.49-0.99 | 0.042 | 0.84 | 0.47-1.48 | 0.539 | |||||||||||||||||||||||||||||||||||||||||||||||||||||||||||||||||||||||||||||||||||||||||||||
| BMI, kg/m2 | |||||||||||||||||||||||||||||||||||||||||||||||||||||||||||||||||||||||||||||||||||||||||||||||||||
| 18.5-24 | Reference | Reference | |||||||||||||||||||||||||||||||||||||||||||||||||||||||||||||||||||||||||||||||||||||||||||||||||
| <18.5 | 1.81 | 1.22-2.68 | 0.003 | 1.80 | 1.11-2.94 | 0.018 | |||||||||||||||||||||||||||||||||||||||||||||||||||||||||||||||||||||||||||||||||||||||||||||
| 24-27 | 1.03 | 0.66-1.61 | 0.909 | 1.23 | 0.68-2.21 | 0.497 | |||||||||||||||||||||||||||||||||||||||||||||||||||||||||||||||||||||||||||||||||||||||||||||
| ≥27 | 0.44 | 0.19-1.01 | 0.052 | 0.39 | 0.14-1.07 | 0.068 | |||||||||||||||||||||||||||||||||||||||||||||||||||||||||||||||||||||||||||||||||||||||||||||
| Hemoglobin. g/dL <13.7/11.1 vs ≥13.7/11.1* | 1.39 | 1.00-1.95 | 0.051 | 1.28 | 0.79-2.06 | 0.317 | |||||||||||||||||||||||||||||||||||||||||||||||||||||||||||||||||||||||||||||||||||||||||||||
| Albumin, g/dL | |||||||||||||||||||||||||||||||||||||||||||||||||||||||||||||||||||||||||||||||||||||||||||||||||||
| >3.5 | Reference | Reference | |||||||||||||||||||||||||||||||||||||||||||||||||||||||||||||||||||||||||||||||||||||||||||||||||
| 2.8-3.5 | 1.35 | 0.89-2.03 | 0.155 | 1.11 | 0.67-1.84 | 0.686 | |||||||||||||||||||||||||||||||||||||||||||||||||||||||||||||||||||||||||||||||||||||||||||||
| <2.8 | 3.44 | 1.93-6.14 | <0.0001 | 2.54 | 1.22-5.30 | 0.013 | |||||||||||||||||||||||||||||||||||||||||||||||||||||||||||||||||||||||||||||||||||||||||||||
| Fasting glucose, mg/dL | |||||||||||||||||||||||||||||||||||||||||||||||||||||||||||||||||||||||||||||||||||||||||||||||||||
| <100 | Reference | Reference | |||||||||||||||||||||||||||||||||||||||||||||||||||||||||||||||||||||||||||||||||||||||||||||||||
| 100-126 | 1.04 | 0.70-1.53 | 0.853 | 1.25 | 0.80-1.94 | 0.331 | |||||||||||||||||||||||||||||||||||||||||||||||||||||||||||||||||||||||||||||||||||||||||||||
| ≥126 | 0.89 | 0.52-1.54 | 0.679 | 1.11 | 0.56-2.21 | 0.759 | |||||||||||||||||||||||||||||||||||||||||||||||||||||||||||||||||||||||||||||||||||||||||||||
| Total cholesterol, mg/dL >200 vs ≤200 | 0.84 | 0.57-1.24 | 0.378 | 1.02 | 0.64-1.63 | 0.94 | |||||||||||||||||||||||||||||||||||||||||||||||||||||||||||||||||||||||||||||||||||||||||||||
| Triglyceride, mg/dL ≥150 vs <150 | 1.08 | 0.69-1.67 | 0.741 | 1.76 | 0.98-3.17 | 0.061 | |||||||||||||||||||||||||||||||||||||||||||||||||||||||||||||||||||||||||||||||||||||||||||||
| HDL-C, mg/dL ≤40/50 vs >40/50* | 0.98 | 0.66-1.44 | 0.896 | 1.10 | 0.69-1.74 | 0.696 | |||||||||||||||||||||||||||||||||||||||||||||||||||||||||||||||||||||||||||||||||||||||||||||
| BUN, mg/dL >26 vs ≤26 | 3.67 | 2.14-6.28 | <0.001 | 4.34 | 2.03-9.30 | <0.001 | |||||||||||||||||||||||||||||||||||||||||||||||||||||||||||||||||||||||||||||||||||||||||||||
| Creatinine, mg/dL >1.3/1.1 vs ≤1.3/1.1* | 1.83 | 1.24-2.70 | 0.002 | 1.06 | 0.58-1.93 | 0.853 | |||||||||||||||||||||||||||||||||||||||||||||||||||||||||||||||||||||||||||||||||||||||||||||
| Uric Acid, mg/dL >7.5/6.5 vs ≤7.5/6.5* | 1.37 | 0.85-2.20 | 0.197 | 1.89 | 0.99-3.59 | 0.053 | |||||||||||||||||||||||||||||||||||||||||||||||||||||||||||||||||||||||||||||||||||||||||||||
| ECOG score | |||||||||||||||||||||||||||||||||||||||||||||||||||||||||||||||||||||||||||||||||||||||||||||||||||
| 2 | Reference | Reference | |||||||||||||||||||||||||||||||||||||||||||||||||||||||||||||||||||||||||||||||||||||||||||||||||
| 3 | 1.05 | 0.68-1.62 | 0.829 | 0.80 | 0.48-1.32 | 0.374 | |||||||||||||||||||||||||||||||||||||||||||||||||||||||||||||||||||||||||||||||||||||||||||||
| 4 | 1.40 | 0.89-2.20 | 0.144 | 1.52 | 0.84-2.72 | 0.164 | |||||||||||||||||||||||||||||||||||||||||||||||||||||||||||||||||||||||||||||||||||||||||||||
| BP: Blood Pressure; BMI: Body Mass Index; HDL-C: High-density lipoprotein-Cholesterol; BUN: Blood urine nitrogen; ECOG: Eastern Cooperative Oncology Group. | |||||||||||||||||||||||||||||||||||||||||||||||||||||||||||||||||||||||||||||||||||||||||||||||||||
| *Male/Female | |||||||||||||||||||||||||||||||||||||||||||||||||||||||||||||||||||||||||||||||||||||||||||||||||||
From year 1 of the follow-up period onward, participants with both BMIs <18.5 kg/m2 and albumin levels <2.8 mg/dL had a lower survival rate (Figure 2A and 2B). On the other hand, the survival rate did not differ significantly between participants with albumin levels of 2.8–3.5 mg/dL or >3.5 mg/dL. The highest mortality was among participants with albumin levels <2.8 mg/dL and BMIs <18.5 kg/m2 (HR = 6.12, 95% CI = 1.85-20.21, P = 0.003; Table 3).
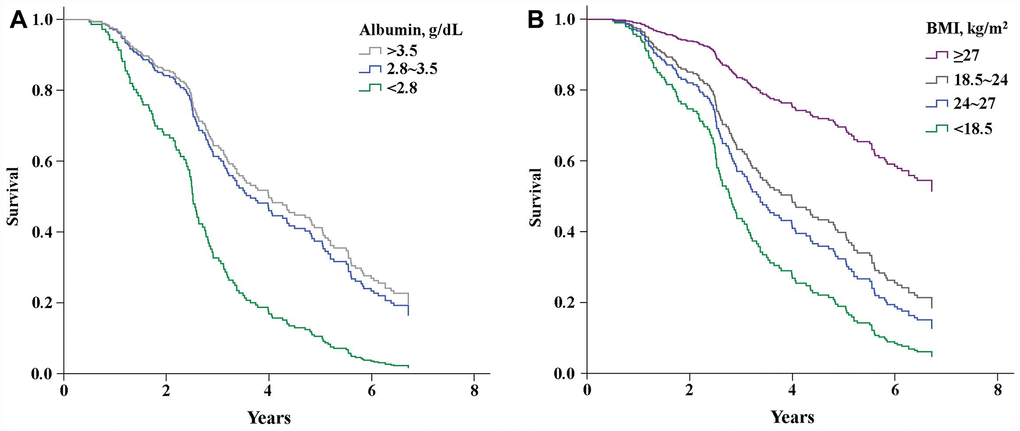
Figure 2. Kaplan-Meier curves showing the effects of serum albumin levels (A) (P<0.001) and BMI (B) (P<0.001) on survival.
Table 3. Multivariable adjusted Cox model in elderly patients at different BMIs and serum albumin levels with (A) DBP <90 mmHg or (B) DBP >90 mmHg
| A | |||||||||||||||||||||||||||||||||||||||||||||||||||||||||||||||||||||||||||||||||||||||||||||||||||
| BMI, kg/m2 | |||||||||||||||||||||||||||||||||||||||||||||||||||||||||||||||||||||||||||||||||||||||||||||||||||
| <18.5 | 18.5-24 | 24-27 | >27 | ||||||||||||||||||||||||||||||||||||||||||||||||||||||||||||||||||||||||||||||||||||||||||||||||
| % | HR | 95%CI | % | HR | 95%CI | % | HR | 95%CI | % | HR | 95%CI | ||||||||||||||||||||||||||||||||||||||||||||||||||||||||||||||||||||||||||||||||||||||||
| Albumin, g/dL | |||||||||||||||||||||||||||||||||||||||||||||||||||||||||||||||||||||||||||||||||||||||||||||||||||
| <2.8 | 3.8 | 6.12** | 1.85-20.21 | 4.9 | 3.40* | 1.25-9.28 | 0.5 | 2.65 | 0.29-24.05 | ||||||||||||||||||||||||||||||||||||||||||||||||||||||||||||||||||||||||||||||||||||||||||
| 2.8-3.5 | 14.8 | 2.55* | 0.11-5.87 | 29.1 | 1.36 | 0.66-2.78 | 11 | 2.19 | 0.88-5.47 | 1.6 | 1.005 | 0.18-5.74 | |||||||||||||||||||||||||||||||||||||||||||||||||||||||||||||||||||||||||||||||||||||||
| >3.5 | 2.7 | 4.01* | 1.09-14.75 | 9.9 | Reference | 4.9 | 0.81 | 0.26-2.55 | 3.3 | 0.649 | 0.15-2.75 | ||||||||||||||||||||||||||||||||||||||||||||||||||||||||||||||||||||||||||||||||||||||||
| B | |||||||||||||||||||||||||||||||||||||||||||||||||||||||||||||||||||||||||||||||||||||||||||||||||||
| BMI, kg/m2 | |||||||||||||||||||||||||||||||||||||||||||||||||||||||||||||||||||||||||||||||||||||||||||||||||||
| <18.5 | 18.5-24 | 24-27 | >27 | ||||||||||||||||||||||||||||||||||||||||||||||||||||||||||||||||||||||||||||||||||||||||||||||||
| % | HR | 95%CI | % | HR | 95%CI | % | HR | 95%CI | % | HR | 95%CI | ||||||||||||||||||||||||||||||||||||||||||||||||||||||||||||||||||||||||||||||||||||||||
| Albumin, g/dL | |||||||||||||||||||||||||||||||||||||||||||||||||||||||||||||||||||||||||||||||||||||||||||||||||||
| <2.8 | 1.1 | 12.75** | 2.12-76.58 | 0.5 | 3.02 | 1.25-36.19 | |||||||||||||||||||||||||||||||||||||||||||||||||||||||||||||||||||||||||||||||||||||||||||||
| 2.8-3.5 | 2.7 | 1.13 | 0.27-4.81 | 3.3 | 3.45* | 1.06-11.19 | 0.5 | 4.76 | 1.47-48.21 | ||||||||||||||||||||||||||||||||||||||||||||||||||||||||||||||||||||||||||||||||||||||||||
| >3.5 | 0.5 | 98.39** | 4.59-1126.33 | 1.1 | 2.58 | 0.28-23.67 | 1.6 | 5.50 | 1.13-26.80 | 0.5 | 5.25 | 1.49-55.80 | |||||||||||||||||||||||||||||||||||||||||||||||||||||||||||||||||||||||||||||||||||||||
| *P<0.05, **P<0.01 | |||||||||||||||||||||||||||||||||||||||||||||||||||||||||||||||||||||||||||||||||||||||||||||||||||
Discussion
Low serum albumin levels not only increase the risk of postoperative organ dysfunction, they are also predictive of mortality in the healthy elderly [19, 20]. BMIs are inversely related to mortality in the elderly, and the combination of albumin level and BMI is used to predict risk of mortality in cardiac surgery and dialysis patients [21–23]. Our cohort study demonstrated that among elderly participants with limited performance status (ECOG ≥2), the mortality rate was 6-fold when the serum albumin level was <2.8 mg/dL and BMI was <18.5 kg/m2.
BMI
Low BMI (<18.5 kg/m2) is predictive of mortality in the elder population. Large cohort studies of elders in Australia [24], Europe [25], and Taiwan [26] showed that being underweight associates with higher all-cause mortality risk. Similarly, we found an association between lower BMI and increased mortality risk in elders with limited musculoskeletal performance status (Figure 2B). We also found that mortality among participants with BMIs <18.5 kg/m2 and serum albumin levels <2.8 g/dL is higher than among those with BMIs <18.5 kg/m2 and albumin levels >2.8 g/dL (Table 3A). This is consistent with the finding of Engelman et al. [22], who reported that elders with lower BMIs and serum albumin levels (<2.8 g/dL) showed greater mortality than those with lower BMIs but normal serum albumin levels. This suggests that low BMI alone does not increase the risk of all-cause mortality.
Albumin
A large cross-sectional longitudinal cohort study of a general elderly population (mean age = 73 years) found an association between albumin levels <3.6 g/dL and higher mortality rates (HR = 2.8, 95% CI = 2.5-3.3) [26]. We found a similar association among limited-performance elders (mean age = 78.8 ± 7.5) when serum albumin levels were <3.5 mg/dL (Figure 2A). In addition, a low serum albumin level is a prognostic factor in cardiovascular disease [27], malnutrition [28], inflammatory reactions [29] and nephrotic syndrome [30] in elders. Similarly, we found that lower serum albumin levels associate with an increased risk of death (HR = 2.54, 95% CI = 1.22-5.30, P = 0.013) after adjusting for several potential confounders, including age, renal function, and BP (Table 2). Elderly patients undergoing surgical intervention are at higher risk than younger patients for such postoperative morbidities as pneumonia (OR = 1.76, 95% CI = 1.34-2.33, P <0.001) and sepsis (OR = 2.29, 95% CI = 1.22-4.30, P = 0.010) [31]. Consequently, a lower serum albumin may reflect physiological impairments such as inflammation, malnutrition or malabsorption in older adults [32]. Importantly, the survival rate among older patients depends not only on the aforementioned physiological impairments, but also on such preexisting conditions as limited performance status, cognitive impairment, and low BMI [33].
Albumin and BMI
Combined low albumin levels and BMIs in the elderly associate with poor prognoses in several diseases [10, 34–37]. Mechanisms to explain lower serum albumin [35, 38] and BMI [39] may involve chronic inflammation, which appears to be a common factor in various diseases affecting the elderly, including cancer, cardiovascular disease, diabetes, cognitive impairment, frailty, sarcopenia [40, 41]. Compared to individuals without inflammation or obesity, patients exhibiting chronic inflammation have a greater risk of mortality [HR = 2.68, 95%CI = 2.14-3.35] when BMI is <21.5 kg/m2 [42]. Moreover, inflammation may be the main cause of reduced serum albumin levels [43], and increasing the BMI can decrease the negative consequences of inflammation [42]. Our finding that mortality was highest when serum albumin was <2.8 g/dL and BMI was <18.5 kg/m2 is consistent with those earlier findings (Table 3A).
We also found that the risk of mortality increased about 2-fold in all categories of BMI and albumin when DBP was >90 mmHg (Table 3B). Likewise, Athanase et al. reported that all-cause mortality in the elderly is increased when DBP is >80 mmHg [44]. Thus, hypertension alone can increase the risk of all-cause mortality. However, a recent large prospective study of the general population reported that the combination of low-grade albuminuria and BMI predict mortality more accurately than low-grade albuminuria or BMI alone [11]. Our findings in elders with limited performance differs from those in middle aged individuals reported by Xiong et al. In elders, urinary tract infections and. cardiovascular diseases are common health conditions, and other conditions include musculoskeletal impairment, chronic obstructive pulmonary disease, cognitive impairment, cancer, diabetes mellitus, and inflammatory diseases [45]. Albuminuria can be affected by both physiological and abnormal stressors, such as exercise [46], posture [47], urinary tract infection [48], and myocardial ischemia [49]. Serum albumin is less affected by these conditions. For long-term medical care, therefore, combining BMI, albumin levels, and DBP as health condition indicators may be suitable for elderly individuals with limited performance status
Strengths and limitations
A key strength of our study is the relatively long follow-up period for elderly individuals with limited performance status. However, there were also several limitations. First, the number of participants was small. Second, the study did not use recent biological data or anthropometric indices. Therefore, changes in those factors could influence the results. Third, the height of some patients could not be measured, so arm length was used to estimate their BMI, which may have introduced bias into our results. Finally, because all of our participants were Taiwanese, our findings may not be applicable to other ethnic groups.
Conclusion
Combined hypoalbuminemia (<2.8 g/dL) and low BMI (<18.5 kg/m2) may be a useful prognostic indicator for predicting high risk of mortality in elderly individuals with limited performance status (ECOG score ≥2). These findings could aid in early identification of relevant vulnerable populations.
Materials and Methods
Participants
The nutritional status of elderly individuals in long-term care facilities (NSELCF) study is an ongoing longitudinal cohort study, which recruited 374 >65-year-old residents in eight long-term care facilities in Taiwan [50]. By the end of the follow-up on December 31, 2009, only 265 participants (men, 43.0%) remained. Of those, 37 were excluded because they had missing anthropometric or laboratory data, and 46 were excluded because they had ECOG scores <2 (Figure 1). Ultimately, 182 individuals were analyzed. Medical ethics approval for participant recruitment and data analyses was obtained from the Institutional Review Board of the China Medical University Hospital. All participants provided written informed consent.
Measurements
The anthropometric indices included age, sex, weight (to the nearest 0.1 kg), height (to the nearest 0.1 cm), BMI (calculated as weight (kg) / estimated height squared (m2)), WC (to the nearest 0.1 cm), blood pressure (in mmHg), and ECOG score. The participants were divided into five categories from 0 (completely active) to 4 (completely disabled). For participants whose height measurement could not be directly measured, height was estimated based on arm span (length from the fingertips of one hand to those of the other hand [51]).
Blood was drawn while patients were in a lying or seated position. In addition to blood counts, the chemistry profile included creatinine, BUN, albumin, fasting glucose, cholesterol, TG, high-density lipoprotein cholesterol (HDL-C), low-density lipoprotein cholesterol (LDL-C), and uric acid levels.
Mortality
Mortality data were obtained from the Department of Health and Welfare in Taiwan from January 2003 to December 2009.
Statistical analysis
Multivariable-adjusted Cox proportional hazards models were used to estimate HRs and 95% CIs. Anthropometric and laboratory data were categorized as follows: systolic blood pressure (≤120, 121–139, and ≥140 mmHg); DBP (≤80, 81–89, and ≥90 mmHg), BMI (≤18.5, 24–27, and ≥27 kg/m2); hemoglobin (male: <13.7 and ≥13.7 g/dL; female: <11.1 and ≥11.1 g/dL), albumin (>3.5, 2.8–3.5, and <2.8 g/dL), fasting glucose (≤100, 101-125, and ≥126 mg/dL), total cholesterol (>200 and ≤200 mg/dL), TG (>150 and ≤150 mg/dL), HDL-C (male: >40 and ≤40 mg/dL; female: >50 and ≤50 mg/dL), BUN (>26 and ≤26 mg/dL), creatinine (male: >1.3 and ≤1.3 mg/dL; female: >1.1 and ≤1.1 mg/dL), and uric acid (male: >7.5 and ≤7.5 mg/dL; female: >6.5 and ≤6.5 mg/dL); and ECOG score (2, 3, and 4). ANOVA was used for continuous variables and the chi-square test was used for categorical variables at different albumin levels. Effects of albumin and BMI levels on mortality were determined using the Kaplan-Meier method. The mortality risk corresponding to different BMIs and albumin levels was also calculated. All statistical tests were two-sided, and values of P <0.05 were considered significant. All statistical analyses were performed using the PC version of the SPSS statistical software (version 21.0; SPSS Inc., Chicago, IL, USA).
Acknowledgments
We are grateful to Dr. Chia-Ing Li for mortality data from the Department of Health and Welfare in Taiwan.
Conflicts of Interest
The authors declare no potential conflicts of interest.
Funding
This study was supported by grants CRS-106-037, DMR-104-068, DMR-105-072, and DMR-105-173 from the China medical University Hospital, Taichung, Taiwan and MOST105-2314-B-039-026-MY2 from Ministry of Science and Technology, Taipei, Taiwan.
References
- 1. Landi F, Onder G, Gambassi G, Pedone C, Carbonin P, Bernabei R. Body mass index and mortality among hospitalized patients. Arch Intern Med. 2000; 160:2641–44. https://doi.org/10.1001/archinte.160.17.2641 [PubMed]
- 2. Locher JL, Roth DL, Ritchie CS, Cox K, Sawyer P, Bodner EV, Allman RM. Body mass index, weight loss, and mortality in community-dwelling older adults. J Gerontol A Biol Sci Med Sci. 2007; 62:1389–92. https://doi.org/10.1093/gerona/62.12.1389 [PubMed]
- 3. Song X, Pitkäniemi J, Gao W, Heine RJ, Pyörälä K, Söderberg S, Stehouwer CD, Zethelius B, Tuomilehto J, Laatikainen T, Tabák AG, Qiao Q, Group DS, and DECODE Study Group. Relationship between body mass index and mortality among Europeans. Eur J Clin Nutr. 2012; 66:156–65. https://doi.org/10.1038/ejcn.2011.145 [PubMed]
- 4. Sung J, Bochicchio GV, Joshi M, Bochicchio K, Costas A, Tracy K, Scalea TM. Admission serum albumin is predicitve of outcome in critically ill trauma patients. Am Surg. 2004; 70:1099–102. [PubMed]
- 5. Gatta A, Verardo A, Bolognesi M. Hypoalbuminemia. Intern Emerg Med. 2012 (Suppl 3); 7:S193–99. https://doi.org/10.1007/s11739-012-0802-0 [PubMed]
- 6. Akirov A, Masri-Iraqi H, Atamna A, Shimon I. Low Albumin Levels Are Associated with Mortality Risk in Hospitalized Patients. Am J Med. 2017; 130:1465.e11–1465.e19. https://doi.org/10.1016/j.amjmed.2017.07.020 [PubMed]
- 7. Gotsman I, Shauer A, Zwas DR, Tahiroglu I, Lotan C, Keren A. Low serum albumin: A significant predictor of reduced survival in patients with chronic heart failure. Clin Cardiol. 2019; 42:365–72. https://doi.org/10.1002/clc.23153 [PubMed]
- 8. Feldman MF. Sleisenger and Fordtran’s gastrointestinal and liver disease: Pathophysiology, diagnosis, management. Philadelphia: Saunders Elsevier; 2006.
- 9. Levey AS, Coresh J. Chronic kidney disease. Lancet. 2012; 379:165–80. https://doi.org/10.1016/S0140-6736(11)60178-5 [PubMed]
- 10. Kimura Y, Yamada M, Kakehi T, Itagaki A, Tanaka N, Muroh Y. Combination of Low Body Mass Index and Low Serum Albumin Level Leads to Poor Functional Recovery in Stroke Patients. J Stroke Cerebrovasc Dis. 2017; 26:448–53. https://doi.org/10.1016/j.jstrokecerebrovasdis.2016.10.008 [PubMed]
- 11. Xiong J, Wang J, Zhao J, Zhang L. Association Between Body Mass Index Combined with Albumin: creatinine Ratio and All-cause Mortality in Chinese Population. Sci Rep. 2017; 7:10878. https://doi.org/10.1038/s41598-017-11084-5 [PubMed]
- 12. Kyu HH, Abate D, Abate KH, Abay SM, Abbafati C, Abbasi N, Abbastabar H, Abd-Allah F, Abdela J, Abdelalim A, Abdollahpour I, Abdulkader RS, Abebe M, et al, and GBD 2017 DALYs and HALE Collaborators. Global, regional, and national disability-adjusted life-years (DALYs) for 359 diseases and injuries and healthy life expectancy (HALE) for 195 countries and territories, 1990-2017: a systematic analysis for the Global Burden of Disease Study 2017. Lancet. 2018; 392:1859–922. https://doi.org/10.1016/S0140-6736(18)32335-3 [PubMed]
- 13. Austad SN. The Geroscience Hypothesis: Is It Possible to Change the Rate of Aging? In: Sierra F., Kohanski R. (eds) Advances in Geroscience. Springer, Cham. 2016;1–36. https://doi.org/10.1007/978-3-319-23246-1_1
- 14. Oken MM, Creech RH, Tormey DC, Horton J, Davis TE, McFadden ET, Carbone PP. Toxicity and response criteria of the Eastern Cooperative Oncology Group. Am J Clin Oncol. 1982; 5:649–55. https://doi.org/10.1097/00000421-198212000-00014 [PubMed]
- 15. Yourman LC, Lee SJ, Schonberg MA, Widera EW, Smith AK. Prognostic indices for older adults: a systematic review. JAMA. 2012; 307:182–92. https://doi.org/10.1001/jama.2011.1966 [PubMed]
- 16. Thomas JM, Cooney LM
Jr , Fried TR. Systematic review: health-related characteristics of elderly hospitalized adults and nursing home residents associated with short-term mortality. J Am Geriatr Soc. 2013; 61:902–11. https://doi.org/10.1111/jgs.12273 [PubMed] - 17. Tabue-Teguo M, Kelaiditi E, Demougeot L, Dartigues JF, Vellas B, Cesari M. Frailty Index and Mortality in Nursing Home Residents in France: Results From the INCUR Study. J Am Med Dir Assoc. 2015; 16:603–06. https://doi.org/10.1016/j.jamda.2015.02.002 [PubMed]
- 18. Flacker JM, Kiely DK. Mortality-related factors and 1-year survival in nursing home residents. J Am Geriatr Soc. 2003; 51:213–21. https://doi.org/10.1046/j.1532-5415.2003.51060.x [PubMed]
- 19. Rady MY, Ryan T, Starr NJ. Clinical characteristics of preoperative hypoalbuminemia predict outcome of cardiovascular surgery. JPEN J Parenter Enteral Nutr. 1997; 21:81–90. https://doi.org/10.1177/014860719702100281 [PubMed]
- 20. Klonoff-Cohen H, Barrett-Connor EL, Edelstein SL. Albumin levels as a predictor of mortality in the healthy elderly. J Clin Epidemiol. 1992; 45:207–12. https://doi.org/10.1016/0895-4356(92)90080-7 [PubMed]
- 21. Vashistha T, Mehrotra R, Park J, Streja E, Dukkipati R, Nissenson AR, Ma JZ, Kovesdy CP, Kalantar-Zadeh K. Effect of age and dialysis vintage on obesity paradox in long-term hemodialysis patients. Am J Kidney Dis. 2014; 63:612–22. https://doi.org/10.1053/j.ajkd.2013.07.021 [PubMed]
- 22. Engelman DT, Adams DH, Byrne JG, Aranki SF, Collins JJ
Jr , Couper GS, Allred EN, Cohn LH, Rizzo RJ. Impact of body mass index and albumin on morbidity and mortality after cardiac surgery. J Thorac Cardiovasc Surg. 1999; 118:866–73. https://doi.org/10.1016/S0022-5223(99)70056-5 [PubMed] - 23. Feingold E, Adams J, Penprase B, Tubie B. Effect of body mass index and albumin on mortality rates for adult African-American hemodialysis patients. J Am Assoc Nurse Pract. 2015; 27:637–45. https://doi.org/10.1002/2327-6924.12236 [PubMed]
- 24. Flicker L, McCaul KA, Hankey GJ, Jamrozik K, Brown WJ, Byles JE, Almeida OP. Body mass index and survival in men and women aged 70 to 75. J Am Geriatr Soc. 2010; 58:234–41. https://doi.org/10.1111/j.1532-5415.2009.02677.x [PubMed]
- 25. de Hollander EL, Van Zutphen M, Bogers RP, Bemelmans WJ, De Groot LC. The impact of body mass index in old age on cause-specific mortality. J Nutr Health Aging. 2012; 16:100–06. https://doi.org/10.1007/s12603-011-0077-6 [PubMed]
- 26. Wu CY, Hu HY, Huang N, Chou YC, Li CP, Chou YJ. Albumin levels and cause-specific mortality in community-dwelling older adults. Prev Med. 2018; 112:145–51. https://doi.org/10.1016/j.ypmed.2018.04.015 [PubMed]
- 27. Weijenberg MP, Feskens EJ, Souverijn JH, Kromhout D. Serum albumin, coronary heart disease risk, and mortality in an elderly cohort. Epidemiology. 1997; 8:87–92. [PubMed]
- 28. Hannan JL, Radwany SM, Albanese T. In-hospital mortality in patients older than 60 years with very low albumin levels. J Pain Symptom Manage. 2012; 43:631–37. https://doi.org/10.1016/j.jpainsymman.2011.04.009 [PubMed]
- 29. Hedlund JU, Hansson LO, Ortqvist AB. Hypoalbuminemia in hospitalized patients with community-acquired pneumonia. Arch Intern Med. 1995; 155:1438–42. https://doi.org/10.1001/archinte.1995.00430130132014 [PubMed]
- 30. Harris RC, Ismail N. Extrarenal complications of the nephrotic syndrome. Am J Kidney Dis. 1994; 23:477–97. https://doi.org/10.1016/S0272-6386(12)80369-6 [PubMed]
- 31. Morotti A, Marini S, Lena UK, Crawford K, Schwab K, Kourkoulis C, Ayres AM, Edip Gurol M, Viswanathan A, Greenberg SM, Anderson CD, Rosand J, Goldstein JN. Significance of admission hypoalbuminemia in acute intracerebral hemorrhage. J Neurol. 2017; 264:905–11. https://doi.org/10.1007/s00415-017-8451-x [PubMed]
- 32. Walston J, McBurnie MA, Newman A, Tracy RP, Kop WJ, Hirsch CH, Gottdiener J, Fried LP, and Cardiovascular Health Study. Frailty and activation of the inflammation and coagulation systems with and without clinical comorbidities: results from the Cardiovascular Health Study. Arch Intern Med. 2002; 162:2333–41. https://doi.org/10.1001/archinte.162.20.2333 [PubMed]
- 33. Bo M, Massaia M, Raspo S, Bosco F, Cena P, Molaschi M, Fabris F. Predictive factors of in-hospital mortality in older patients admitted to a medical intensive care unit. J Am Geriatr Soc. 2003; 51:529–33. https://doi.org/10.1046/j.1532-5415.2003.51163.x [PubMed]
- 34. Phung DT, Wang Z, Rutherford S, Huang C, Chu C. Body mass index and risk of pneumonia: a systematic review and meta-analysis. Obes Rev. 2013; 14:839–57. https://doi.org/10.1111/obr.12055 [PubMed]
- 35. Viasus D, Garcia-Vidal C, Simonetti A, Manresa F, Dorca J, Gudiol F, Carratalà J. Prognostic value of serum albumin levels in hospitalized adults with community-acquired pneumonia. J Infect. 2013; 66:415–23. https://doi.org/10.1016/j.jinf.2012.12.007 [PubMed]
- 36. Mafra D, Farage NE, Azevedo DL, Viana GG, Mattos JP, Velarde LG, Fouque D. Impact of serum albumin and body-mass index on survival in hemodialysis patients. Int Urol Nephrol. 2007; 39:619–24. https://doi.org/10.1007/s11255-007-9201-2 [PubMed]
- 37. Courtney D, Moloney B, Lowery A, Kerin M. Patients Nutritional Status: BMI and serum albumin as a predictive indicator of survival in patients with metastatic breast cancer. Eur J Surg Oncol. 2017; 43:S29–30. https://doi.org/10.1016/j.ejso.2017.01.120
- 38. Hong X, Yan J, Xu L, Shen S, Zeng X, Chen L. Relationship between nutritional status and frailty in hospitalized older patients. Clin Interv Aging. 2019; 14:105–11. https://doi.org/10.2147/CIA.S189040 [PubMed]
- 39. Veronese N, Cereda E, Solmi M, Fowler SA, Manzato E, Maggi S, Manu P, Abe E, Hayashi K, Allard JP, Arendt BM, Beck A, Chan M, et al. Inverse relationship between body mass index and mortality in older nursing home residents: a meta-analysis of 19,538 elderly subjects. Obes Rev. 2015; 16:1001–15. https://doi.org/10.1111/obr.12309 [PubMed]
- 40. Sanada F, Taniyama Y, Muratsu J, Otsu R, Shimizu H, Rakugi H, Morishita R. Source of Chronic Inflammation in Aging. Front Cardiovasc Med. 2018; 5:12. https://doi.org/10.3389/fcvm.2018.00012 [PubMed]
- 41. Accardi G, Caruso C. Immune-inflammatory responses in the elderly: an update. Immun Ageing. 2018; 15:11. https://doi.org/10.1186/s12979-018-0117-8 [PubMed]
- 42. Stenvinkel P, Gillespie IA, Tunks J, Addison J, Kronenberg F, Drueke TB, Marcelli D, Schernthaner G, Eckardt KU, Floege J, Froissart M, Anker SD, Committee AR, and ARO Steering Committee. Inflammation Modifies the Paradoxical Association between Body Mass Index and Mortality in Hemodialysis Patients. J Am Soc Nephrol. 2016; 27:1479–86. https://doi.org/10.1681/ASN.2015030252 [PubMed]
- 43. Kaysen GA, Dubin JA, Müller HG, Rosales L, Levin NW, Mitch WE, and HEMO Study Group NIDDK. Inflammation and reduced albumin synthesis associated with stable decline in serum albumin in hemodialysis patients. Kidney Int. 2004; 65:1408–15. https://doi.org/10.1111/j.1523-1755.2004.00520.x [PubMed]
- 44. Protogerou AD, Safar ME, Iaria P, Safar H, Le Dudal K, Filipovsky J, Henry O, Ducimetière P, Blacher J. Diastolic blood pressure and mortality in the elderly with cardiovascular disease. Hypertension. 2007; 50:172–80. https://doi.org/10.1161/HYPERTENSIONAHA.107.089797 [PubMed]
- 45. Odding E, Valkenburg HA, Stam HJ, Hofman A. Determinants of locomotor disability in people aged 55 years and over: the Rotterdam Study. Eur J Epidemiol. 2001; 17:1033–41. https://doi.org/10.1023/A:1020006909285 [PubMed]
- 46. Poortmans JR. Postexercise proteinuria in humans. Facts and mechanisms. JAMA. 1985; 253:236–40. https://doi.org/10.1001/jama.1985.03350260088032 [PubMed]
- 47. Montagna G, Buzio C, Calderini C, Quaretti P, Migone L. Relationship of proteinuria and albuminuria to posture and to urine collection period. Nephron. 1983; 35:143–44. https://doi.org/10.1159/000183064 [PubMed]
- 48. Carter JL, Tomson CR, Stevens PE, Lamb EJ. Does urinary tract infection cause proteinuria or microalbuminuria? A systematic review. Nephrol Dial Transplant. 2006; 21:3031–37. https://doi.org/10.1093/ndt/gfl373 [PubMed]
- 49. Berton G, Cordiano R, Palmieri R, Cucchini F, De Toni R, Palatini P. Microalbuminuria during acute myocardial infarction; a strong predictor for 1-year mortality. Eur Heart J. 2001; 22:1466–75. https://doi.org/10.1053/euhj.2000.2582 [PubMed]
- 50. Lin WY, Huang HY, Liu CS, Li CI, Lee SD, Lin CC, Huang KC. A hospital-based multidisciplinary approach improves nutritional status of the elderly living in long-term care facilities in middle Taiwan. Arch Gerontol Geriatr. 2010 (Suppl 1); 50:S22–26. https://doi.org/10.1016/S0167-4943(10)70007-8 [PubMed]
- 51. Weinbrenner T, Vioque J, Barber X, Asensio L. Estimation of height and body mass index from demi-span in elderly individuals. Gerontology. 2006; 52:275–81. https://doi.org/10.1159/000094608 [PubMed]